- Home
- About Journals
-
Information for Authors/ReviewersEditorial Policies
Publication Fee
Publication Cycle - Process Flowchart
Online Manuscript Submission and Tracking System
Publishing Ethics and Rectitude
Authorship
Author Benefits
Reviewer Guidelines
Guest Editor Guidelines
Peer Review Workflow
Quick Track Option
Copyediting Services
Bentham Open Membership
Bentham Open Advisory Board
Archiving Policies
Fabricating and Stating False Information
Post Publication Discussions and Corrections
Editorial Management
Advertise With Us
Funding Agencies
Rate List
Kudos
General FAQs
Special Fee Waivers and Discounts
- Contact
- Help
- About Us
- Search


The Open Fuels & Energy Science Journal
(Discontinued)
ISSN: 1876-973X ― Volume 11, 2018
Rheological and Emulsification Behavior of Xinjiang Heavy Oil and Model Oils
Jiaqiang Jing1, 2, Jiatong Tan1, *, Haili Hu1, Jie Sun1, Peiyu Jing1
Abstract
Transparent model oils are commonly used to study the flow patterns and pressure gradient of crude oil-water flow in gathering pipes. However, there are many differences between the model oil and crude oils. The existing literatures focus on the flow pattern transition and pressure gradient calculation of model oils. This paper compares two most commonly used model oils (white mineral oil and silicon oil) with Xinjiang crude oil from the perspectives of rheological properties, oil-water interfacial tensions, emulsion photomicrographs and demulsification process. It indicates that both the white mineral oil and the crude oils are pseudo plastic fluids, while silicon oil is Newtonian fluid. The viscosity-temperature relationship of white mineral oil is similar to that of the diluted crude oil, while the silicon oil presents a less viscosity gradient with the increasing temperature. The oil-water interfacial tension can be used to evaluate the oil dispersing ability in the water phase, but not to evaluate the emulsion stability. According to the Turbiscan lab and the stability test, the model oil emulsion is less stable than that of crude oil, and easier to present water separation.
Article Information

Identifiers and Pagination:
Year: 2016Volume: 9
First Page: 1
Last Page: 10
Publisher Id: TOEFJ-9-1
DOI: 10.2174/1876973X01609010001
Article History:
Received Date: 7/12/2015Revision Received Date: 22/06/2016
Acceptance Date: 23/06/2016
Electronic publication date: 09/08/2016
Collection year: 2016
open-access license: This is an open access article licensed under the terms of the Creative Commons Attribution-Non-Commercial 4.0 International Public License (CC BY-NC 4.0) (https://creativecommons.org/licenses/by-nc/4.0/legalcode), which permits unrestricted, non-commercial use, distribution and reproduction in any medium, provided the work is properly cited.
* Address correspondence to this author at the State Key Laboratory of Oil and Gas Reservoir Geology and Exploitation, Southwest Petroleum University, No.8 Xindu Avenue, Xindu District, Chengdu City, Sichuan Province, P.R. China; Tel: +86-152-028-57560; Email: tanjiatong@outlook.com
| Open Peer Review Details | |||
|---|---|---|---|
| Manuscript submitted on 7-12-2015 |
Original Manuscript | Rheological and Emulsification Behavior of Xinjiang Heavy Oil and Model Oils | |
1. INTRODUCTION
Heavy oil-water flow commonly occurs during the heavy oil exploitation in high water cut reservoirs, artificial lift, and pipeline transportation from wells to a refinery. Therefore, understanding the oil-water mixture structures and flow pattern transitions is important for predicting the pressure gradient of oil-water flow. Photographs taken by high-speed cameras [1Bannwart, A.C.; Rodriguez, O.M.; de Carvalho, C.H.; Wang, I.S.; Vara, R.M. Flow patterns in heavy crude oil-water flow. J. Energy Res. Technol., 2004, 126, 184-189.
[http://dx.doi.org/10.1115/1.1789520] -5Wegmann, A.; Rudolf von Rohr, P. Two phase liquid-liquid flows in pipes of small diameters. Int. J. Multiph. Flow, 2006, 32, 1017-1028.
[http://dx.doi.org/10.1016/j.ijmultiphaseflow.2006.04.001] ] through transparent pipes are the most commonly-used direct proof for classification of oil-water flow patterns.
However, using crude oil in the experiments would cause some problems due to its specific properties. First, crude oil is toxic and volatile. Crude oil has very strict requirements for transport, storage and processing, as it may cause safety problems such as fire and explosion [6Rodionova, G.; Pettersen, B.; Kelesoğlu, S.; Sjöblom, J. Preparation and characterization of reference fluid mimicking behavior of North Sea heavy crude oil. Fuel, 2014, 135, 308-314.
[http://dx.doi.org/10.1016/j.fuel.2014.07.003] ]. Second, crude oil, especially high-viscosity crude oil, contains natural surfactants, which would form water-in-oil emulsion after intensive shearing and mixing in a multiphase pipe. Emulsification would deteriorate the flowablity of crude oil and affect the flow pattern transition. Besides, most types of crude oil are black or brown, which makes the oil-water mixture opaque and unidentifiable. Its flow structure could be hardly described by high-speed imaging, the most commonly-used multiphase flow recording method. The low-viscosity crude oil water flow can be detected by an impedance probe or conductance probe [7Angeli, P.; Hewitt, G. Flow structure in horizontal oil-water flow. Int. J. Multiph. Flow, 2000, 26, 1117-1140.
[http://dx.doi.org/10.1016/S0301-9322(99)00081-6] , 8Zong, Y-B.; Jin, N-D.; Wang, Z-Y.; Gao, Z-K. Wang, C. Nonlinear dynamic analysis of large diameter inclined oil-water two phase flow pattern. Int. J. Multiph. Flow, 2010, 36, 166-183.
[http://dx.doi.org/10.1016/j.ijmultiphaseflow.2009.11.006] ], but high-viscosity crude oil will cling to the probe, thus interfering with the test results.
Model oil or reference oil helps researchers to get more detailed flow parameters in a friendly environment. Blank model oil is made of single component chemicals or mineral oil. It contains little volatile, toxic or surface-active compounds. Model oils are transparent and have a different light transmission from water. The model oil-water flow structure can be recorded by a high-speed camera. By controlling the test temperature, surfactants and other additives, we could ensure the model oils have similar viscosity and interfacial tensions as the crude oils [9Utvik, O.H.; Rinde, T.; Valle, A. An experimental comparison between a recombined hydrocarbon-water fluid and a model fluid system in three-phase pipe flow. J. Energy Res. Technol., 2001, 123, 253-259.
[http://dx.doi.org/10.1115/1.1410365] ].
The existing model oils mainly include white oil [10Nädler, M.; Mewes, D. Flow induced emulsification in the flow of two immiscible liquids in horizontal pipes. Int. J. Multiph. Flow, 1997, 23, 55-68.
[http://dx.doi.org/10.1016/S0301-9322(96)00055-9] -12Trallero, J.; Sarica, C.; Brill, J. A study of oil/water flow patterns in horizontal pipes. SPE Production and Facilities, 1997, 12, 165-172.
[http://dx.doi.org/10.2118/36609-PA] ], petroleum oil [13Chakrabarti, D.; Das, G.; Ray, S. Pressure drop in liquid-liquid two phase horizontal flow: experiment and prediction. Chem. Eng. Technol., 2005, 28, 1003-1009.
[http://dx.doi.org/10.1002/ceat.200500143] , 14Pal, R. Effect of droplet size on the rheology of emulsions. AIChE J., 1996, 42, 3181-3190.
[http://dx.doi.org/10.1002/aic.690421119] ] silicon oil [2Foroughi, H.; Kawaji, M. Viscous oil-water flows in a microchannel initially saturated with oil: flow patterns and pressure drop characteristics. Int. J. Multiph. Flow, 2011, 37, 1147-1155.
[http://dx.doi.org/10.1016/j.ijmultiphaseflow.2011.06.004] ], kerosene [7Angeli, P.; Hewitt, G. Flow structure in horizontal oil-water flow. Int. J. Multiph. Flow, 2000, 26, 1117-1140.
[http://dx.doi.org/10.1016/S0301-9322(99)00081-6] , 13Chakrabarti, D.; Das, G.; Ray, S. Pressure drop in liquid-liquid two phase horizontal flow: experiment and prediction. Chem. Eng. Technol., 2005, 28, 1003-1009.
[http://dx.doi.org/10.1002/ceat.200500143] , 15Angeli, P.; Hewitt, G. Pressure gradient in horizontal liquid-liquid flows. Int. J. Multiph. Flow, 1999, 24, 1183-1203.
[http://dx.doi.org/10.1016/S0301-9322(98)00006-8] ] and some other commercial oil productions [3Vuong, D.H.; Zhang, H-Q.; Sarica, C.; Li, M. Experimental study on high viscosity oil/water flow in horizontal and vertical pipes. In: SPE Annual Technical Conference and Exhibition; Society of Petroleum Engineers: Louisiana, USA, 2009.
[http://dx.doi.org/10.2118/124542-MS] , 5Wegmann, A.; Rudolf von Rohr, P. Two phase liquid-liquid flows in pipes of small diameters. Int. J. Multiph. Flow, 2006, 32, 1017-1028.
[http://dx.doi.org/10.1016/j.ijmultiphaseflow.2006.04.001] , 16Charles, M.E.; Govier, G.T.; Hodgson, G. The horizontal pipeline flow of equal density oil-water mixtures. Can. J. Chem. Eng., 1961, 39, 27-36.
[http://dx.doi.org/10.1002/cjce.5450390106] ], but very few types of high viscosity model oils have been studied. White oil, namely mineral oil or paraffin oil is the most widely-used high viscosity model oil, and silicon oil [2Foroughi, H.; Kawaji, M. Viscous oil-water flows in a microchannel initially saturated with oil: flow patterns and pressure drop characteristics. Int. J. Multiph. Flow, 2011, 37, 1147-1155.
[http://dx.doi.org/10.1016/j.ijmultiphaseflow.2011.06.004] ] has also been adopted. However, the emulsifying properties of crude oils and model oils are different due to their difference in chemical composition, especially asphaltene and resin. As reported [4Wang, W.; Gong, J.; Angeli, P. Investigation on heavy crude-water two phase flow and related flow characteristics. Int. J. Multiph. Flow, 2011, 37, 1156-1164.
[http://dx.doi.org/10.1016/j.ijmultiphaseflow.2011.05.011] ], under high water cut conditions, heavy oils remain water-in-oil(W/O) dispersed flow pattern, while model oils tend to form an O/W dispersed flow pattern. A transparent model oil could achieve the similar emulsion stability and flow ability with that of the North Sea heavy crude oil after adding some emulsifying agents [6Rodionova, G.; Pettersen, B.; Kelesoğlu, S.; Sjöblom, J. Preparation and characterization of reference fluid mimicking behavior of North Sea heavy crude oil. Fuel, 2014, 135, 308-314.
[http://dx.doi.org/10.1016/j.fuel.2014.07.003] ]. However, little work has been carried out on the difference between crude oil and model oil or their effects on oil-water flow. The objective of this paper is to compare the physical properties between model oils and crude oil, and to study how these differences affect oil-water flow.
In this work, white mineral oil (Model oil 1#) and silicon oil (Model oil 2#) were determined as the model oils of XJ heavy oil. Two types of diluted crude oil were prepared as references. Model oils were characterized by comparing with the reference crude oils. The rheological properties, temperature dependence of viscosity, and oil-water interfacial tensions were tested, and their effects on oil-water flow were analyzed. W/O emulsions were prepared and their differences in photomicrographs and stability were tested. This study contributes to the selection and modification of model oils and helps to better understand the transition from model-oil-based models to field application.
2. MATERIALS AND METHODS
2.1. Materials
Table 1 shows some physical properties of the oil samples at 25 °C. The dehydrated crude oil samples contained less than 1% water. Diluted crude oil 1# and Diluted crude oil 2# were prepared by diluting the XJ heavy oil with different proportions of diesel. Tap water collected from Chengdu Water Supply Company was used in this study. According to the Company's water analysis report, the pH and salinity were 7.32 and 132 mg/L respectively.

2.2. Preparation of Diluted Crude Oils
Diluted crude oil 1#, which is of the viscosity as Model oil 1#, is prepared by diluting XJ heavy oil with 6.16%wt diesel. Diluted crude oil 2#, which is of the viscosity as Model oil 2#, is prepared by diluting XJ heavy oil with 9.61%wt diesel. The reference condition is 25 °C and 400 s-1.
The diluted crude oils were prepared using a JB50-D electric homogenizer (Shanghai Specimen Model Factory, China) with a 4-bladed propeller stirrer at the constant speed of 400 rpm for 5 min.
2.3. Preparation of Emulsions
At the oil-water ratio of 1:1, the emulsions for oil water separation tests were prepared using the instruments mentioned in section 2.2. The stirring lasted for 20 min at 1000 rpm. The emulsions for Turbiscan multiple light scattering tests were prepared by a 78-1 magnetic heating stirrer with a two-blade propeller (Shanghai Shuangjie Laboratory Equipment Company, China). The stirring lasted at 2000 rpm and 60 °C for 20 min. The corresponding parameters were tested immediately after the stirring.
2.4. Rheology
A Rheolab QC rotational rheometer (Anton Paar, Austria), equipped with a CC27 concentric cylinder (bob radius, 13.33 mm; cup radius, 14.46 mm; gap length 40.00 mm), was used to test the shear rate-shear stress relationship. Each test involving an oil sample of 18.38 mL was conducted using the CR mode, with shear rate as the input and shear stress as the output. The oil sample was first kept at the predetermined temperature for 15 min and then tested over the shear rate ranging from 0.1 to 800 s-1 for 4 min, with 40 measuring points. The software package “Rheoplus” was applied to control the test routine and evaluate the data.
A MCR302 Rheometer (Anton Paar, Austria) equipped with a measuring plate PP50 (diameter, 50 mm; gap width, 1 mm) was used to test the viscoelasticity. First, each oil sample was swept from 0.1 to 100 Pa to find out the linear range. Then the 2/3 of the maximum shear stress in the linear range was treated as the constant shear stress in the subsequent viscous and elastic moduli tests. The testing shear stress of model oil 1#, model oil 2# and XJ heavy oil is 5, 2, 5 Pa respectively at 25 °C and all 0.6 Pa at 55 °C. The oscillatory shear was increased at a logarithmic scale over the range of 0.1-10 Hz. Five measuring points were recorded per decade.
2.5. Stability Tests
The transmission and backscattering light intensity was characterized with a TurbiScan Lab device (Formulaction, Inc., France), whose reading head consists of a pulse near-infrared source (880 nm) and two synchronous detectors. Fig. (1 ) shows the measuring principle of TurbiScan Lab. The transmission detector received the light flux transmitted through the product, while the backscattering detector measured the light backscattered by the product. The reading head acquired the transmission every 40 µm when moving along the cell height (55 mm). When it detected any variation in the transmission, the reading head monitored the coalescence or flocculation in the emulsions.
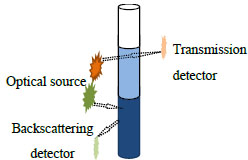 |
Fig. (1) Measuring principle of TurbiScan Lab. |
Before the tests, the Turbiscan Lab device was set to keep at 60 °C for 30 min. During the tests, the test cell containing 20 mL of a dispersion sample was scanned every 3 min for 2 h. The software package “TLAB EXPERT ” controlled the test routine and provided the test results.
3. RESULTS AND DISCUSSION
3.1. Rheology
3.1.1. Rheological Model
The shear rate vs. shear stress plots for different oils at 20 °C are shown in Fig. (2 ). The shear stress of Model oil 1# and crude oils increase with shear rate in nonlinear form and can be described by power law equations shown in Eq. (1). The shear stress of Model oil 2# increase with shear rate in linear form and can be described by Bingham model shown in Eq. (2).
 |
(1) |
 |
(2) |
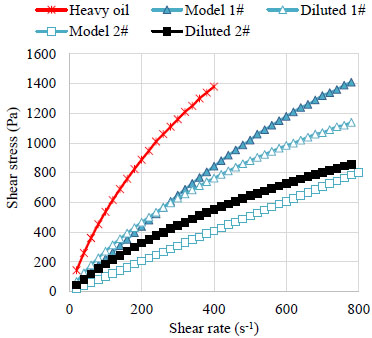 |
Fig. (2) Rheograms of the oil samples. |
Where τ is shear stress in Pa. γ is shear rate in s-1. K is consistency index. n is rheological index. τ 0 is apparent yield stress in Pa. η is apparent viscosity in Pa.
According to the previous study [17Li, C.; Li, G. Frictional drag behavior of non-newtonian crude oil. Oil Gas Storage Trans., 1997. 17+61-14], as the flow rate increases, the friction loss of pseudoplastic fluids increases less than Newtonian fluids. This difference is attributed to the shear thinning behavior of the non-Newtonian fluids. Therefore, under the same operating condition, with the improvement of flow rate, the pressure gradient in Model oil 1# increases more severely than in the crude oil.
3.1.2. Viscosity
Fig. (3 ) indicates that at 20 °C,the apparent viscosity of XJ heavy oil is high at low shear rate and become lower at higher shear rate. Both XJ heavy oil and the diluted crude oils presented a shear-thinning behavior. This is due to chain type molecules in crude oils are disentangled, stretched, and reoriented parallel to the driving force with the increasing shear rates [18Ghannam, M.T.; Esmail, M.N. Rheological properties of carboxymethyl cellulose. J. Appl. Polym. Sci., 1997, 64, 289-301.
[http://dx.doi.org/10.1002/(SICI)1097-4628(19970411)64:2<289::AID-APP9>3.0.CO;2-N] ]. The shear-thinning behavior in Model oil 1# is less obvious than crude oils, partly because it is made from crude oil deprived of asphaltenes contain large molecules. The viscosity of Model oil 2# keep constant with the increasing of shear stress because it is composed of pure polydimethylsiloxane, quite different from crude oils.
Fig. (4 ) depicts the apparent viscosity between model oils and crude oils at the flow rate of 400 s-1 and within the temperature range from 20 to 60 °C. The viscosity of all oil samples decreases with the temperature. The viscosity-temperature relationships of XJ heavy oil, diluted crude oils and Model oil 1# are nonlinear. The viscosity decreasing gradient become lower with the temperature. The viscosity-temperature relationship of Model oil 2# is linear and its viscosity decreasing gradient is smaller than other samples. Moreover, in the flow loop experiments, the temperatures of the pump keep increasing with the prolonging of time, leading to the temperature difference between the start and end of the experiment [1Bannwart, A.C.; Rodriguez, O.M.; de Carvalho, C.H.; Wang, I.S.; Vara, R.M. Flow patterns in heavy crude oil-water flow. J. Energy Res. Technol., 2004, 126, 184-189.
[http://dx.doi.org/10.1115/1.1789520] ]. Thus it is hard to obtain stable pressure gradient data in a short period. According to the viscosity-temperature relationships, the use of Model oil 2# instead of Model oil 1# or heavy crude oil will overcome such disadvantages and help to achieve constant pressure gradient.
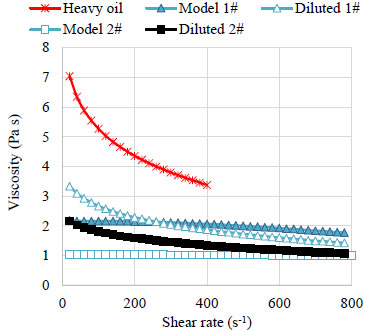 |
Fig. (3) Apparent viscosity for the oil samples at 20°C. |
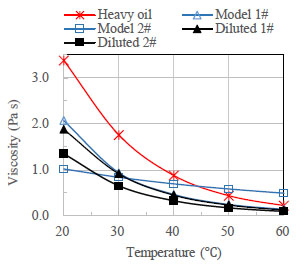 |
Fig. (4) Viscosity behavior for the oil samples. |
3.1.3. Viscoelasticity
The state of the sample relative to solid or liquid was evaluated using viscous moduli (G”) and elastic moduli (G'). Fig. (5 ) shows the results of G” and G' of model oils and heavy crude oil at 25 °C.
G' of both the model oils and heavy crude oil are higher than G' within the experimental temperature range, demonstrating that the flow ability is mainly dominated by the viscidity, and rarely by the elasticity. Therefore, these samples can be considered as viscous fluids. Model oil 1# and Model oil 2# are very similar to the XJ heavy oil in respect of viscoelasticity.
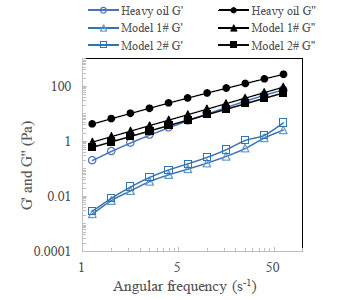 |
Fig. (5) The elastic modulus and the viscous modulus of the oil samples at 25 °C. |
3.2. Interfacial Tensions
Table 1 shows the oil-water interfacial tensions of the model oils and the crude oils. According to the test results, the interfacial tension between oil and water decreases in the order of Model oil 1#, Model oil 2#, XJ heavy oil, Diluted crude oil 1#, Diluted crude oil 2#. As reported [5Wegmann, A.; Rudolf von Rohr, P. Two phase liquid-liquid flows in pipes of small diameters. Int. J. Multiph. Flow, 2006, 32, 1017-1028.
[http://dx.doi.org/10.1016/j.ijmultiphaseflow.2006.04.001] ], lower interfacial tension, easier to form specific surface. Therefore, it is reasonable to predict that for a given Reynolds number oil-water system, Model oils are harder to form dispersed flow than diluted crude oils of the same viscosity.
3.3. Emulsions
3.3.1. Photomicrographs
Photomicrographs can reflect the microstructure of the emulsions. In this study, the emulsions were prepared by stirring oil and water at a weight ratio of 1:1. Fig. (6 ) shows the photomicrographs sampled from the upper part of the emulsion. According to visual observation, after experiencing the same shear history, both types of diluted crude oil have formed homogeneous emulsions, while both Model oils presented separated water phase. W/O emulsions are form in all oil-water samples. Furthermore, the water concentration and average droplet size are larger in Model oil 2# emulsion than Model oil 1# emulsion, and in Diluted crude oil 2# emulsion than Diluted crude oil 1# emulsion. According to Wegmann et al. [5Wegmann, A.; Rudolf von Rohr, P. Two phase liquid-liquid flows in pipes of small diameters. Int. J. Multiph. Flow, 2006, 32, 1017-1028.
[http://dx.doi.org/10.1016/j.ijmultiphaseflow.2006.04.001] ], it is because the higher oil-water interfacial tension will prevent the dispersed phase from building small droplets.
3.3.2. Stability
Bottle tests or morphology can only record emulsions at a specific point of time. Turbiscan lab can reflect real-time coalescence, sedimentation and clarification process in emulsions in a non-destructive way. The principle of this measurement is based on the variation of the droplet volume fraction (migration) or mean size (coalescence), thus resulting in the variation of backscattering and transmission signals [19Celia, C.; Trapasso, E.; Cosco, D.; Paolino, D.; Fresta, M. Turbiscan lab expert analysis of the stability of ethosomes and ultradeformable liposomes containing a bilayer fluidizing agent. Colloids Surf. B Biointerfaces, 2009, 72(1), 155-160.
[http://dx.doi.org/10.1016/j.colsurfb.2009.03.007] [PMID: 19376689] ]. In this section, Turbiscan lab is adopted to analyze the kinetics during the destabilization process.
Fig. (7 ) shows the destabilization process of model oil emulsions. The transmission intensity is expressed in the scale of %, referring to the detected light intensity relative to the standard sample (Latex suspension: 0.3 m - 10% and Silicone oil). The Y-axis stands for the transmission intensity, while the X-axis for the height of the glass-made sample cell. The legends at the right side indicate the aging time in the scale of day: hour: minute: second. Each test lasted for 2 h. The data is valid within the height within the height range of 3 to 38 mm, because the light will be refracted at the interface between the glass and the emulsion at the cell bottom, or between the emulsion and air at the cell top.
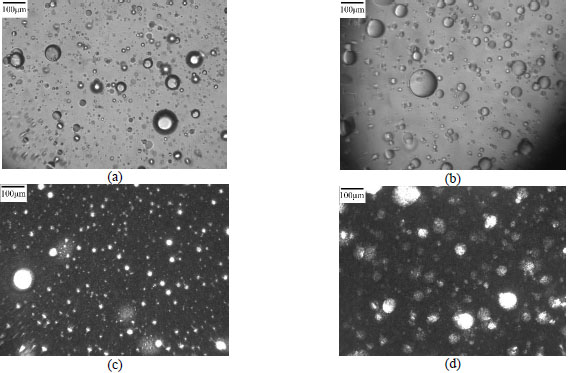 |
Fig. (6) The photo and the photomicrographs of the emulsions. (a) Model oil 1#; (b) Model oil 2#; (c) Diluted crude 1#; (d) Diluted crude 2#. |
 |
Fig. (7) Transmission profiles of the emulsification process. (a) Model oil 1#; (b) Model oil 2#. |
The upper part of the sample cell (18-40 mm) proved to be W/O emulsion and the lower part(3-17 mm) O/W emulsion. The transmission intensity changing with time can reflect the destabilization process. In the model oil emulsion, the transmission changes in the water is bigger than in the oil. This is attribute to the dispersed oil droplets in the bottom water flow upward and the dispersed water droplets in the top coalesce and sediment. According to Liu et al. [20Liu, J.; Huang, X-F.; Lu, L-J.; Li, M-X.; Xu, J-C.; Deng, H-P. Turbiscan Lab® Expert analysis of the biological demulsification of a water-in-oil emulsion by two biodemulsifiers. J. Hazard. Mater., 2011, 190(1-3), 214-221.
[http://dx.doi.org/10.1016/j.jhazmat.2011.03.028] [PMID: 21458159] ], in the initial period, coalescence play a main role in the emulsion, proved by the decreasing of transmission. As the droplets become bigger, they migrated from top to the bottom. Gradually, the water layer separated at the bottom of the sample cell. Meanwhile, the oil phase migrated to the top of the sample cell.
Fig. (8 ) displays the intensity of the backscattered light versus the sample height in the Diluted crude oil 2# emulsions. As it can be observed, W/O emulsion presents at the upper part(23-38mm) and O/W emulsion at the lower part(3-23 mm). Considering the backscattering signal decrease in very small extents, the diluted crude oils emulsions should be treated as stable emulsions.
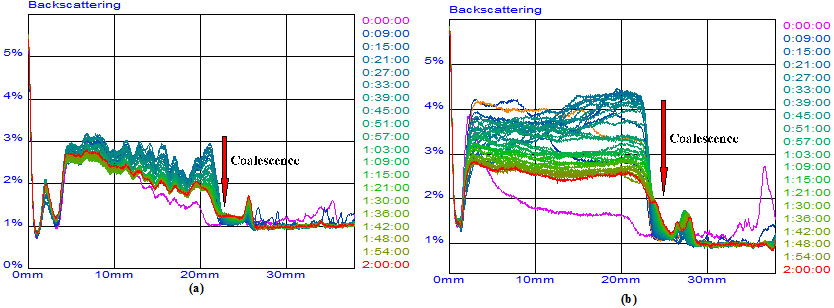 |
Fig. (8) Backscattering profiles of the emulsification process. (a) Diluted crude 1#; (b) Diluted crude 2#. |
The emulsion stability was assessed with the proportion of water separated from the total water volume. The separated water fraction was recorded after each fresh emulsion was holding for 24 h at 25 °C, as shown in Fig. (9 ). Observation shows that the separated water fraction from left to right are 98%(Model oil 1#), 88%(Model oil 2#), 53%(XJ heavy oil), 86%(Diluted crude oil 1#), 87%(Diluted crude oil 2#), respectively. Therefore, the emulsion stability increases in the order of Model oil 1#, Model oil 2#, Diluted crude oil 2#, Diluted crude oil 1#, XJ heavy oil. This sequence differs from the oil-water interfacial tension sequence. It indicates that the oil-water interfacial tension is not the determining factor for emulsion stability. According to the interfacial tension theory [21Murray, B.S.; Dickinson, E.; Wang, Y. Bubble stability in the presence of oil-in-water emulsion droplets: influence of surface shear versus dilatational rheology. Food Hydrocoll., 2009, 23, 1198-1208.
[http://dx.doi.org/10.1016/j.foodhyd.2008.07.015] ], the emulsion stability is the result of the dispersed droplet size and the presence of the interfacial film. The properties of the interfacial film is affected by crude oil type(asphaltic, paraffinic, etc.), composition and pH of the water, temperature, concentration of polar molecules in the oil phase, contact or aging time, the compressed degree of the adsorbed film, etc [22Jones, T.; Neustadter, E.; Whittingham, K. Water-in-crude oil emulsion stability and emulsion destabilization by chemical demulsifiers. J.
Canadian Petrol. Tech., 1978, 17.
[http://dx.doi.org/10.2118/78-02-08] -24Sridhar, S.; Zhang, H-Q.; Sarica, C.; Pereyra, E.J. Experiments and Model Assessment on High-Viscosity Oil/Water Inclined Pipe Flows. In: SPE Annual Technical Conference and Exhibition; Society of Petroleum Engineers: Denver, Colorado, USA, 2011.
[http://dx.doi.org/10.2118/146448-MS] ].
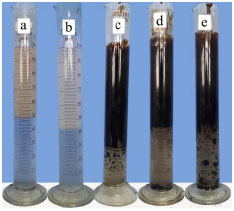 |
Fig. (9) Photos of the emulsions after setting for 24h (a) Model oil 1#; (b) Model oil 2#; (c) XJ heavy oil; (d)Diluted crude 1#; (e) Diluted crude 2#. |
Based on the droplet size variation and droplet migration, TSI (Turbiscan Stability Index) can reflect the stability of emulsions during the standing. A larger TSI indicates the lower stability of an emulsion. Fig. (10 ) shows the TSI profiles during the oil-water separation. The experimental results show that the two transparent model oils are very similarly stable and both are less stable than the two diluted crude oils. The two diluted crude oils are less stable than the corresponding original undiluted heavy crude oils. This phenomenon can be mainly attributed to the surface- active molecules (e.g. asphaltenes and resin) in the natural heavy crude oil. It is generally believed that asphaltene could form stable thick network at the interface, and is one of the main amphiphilic compounds responsible for the stability of water-in-oil emulsion [25Alvarez, G.; Poteau, S.; Argillier, J-F.; Langevin, D.; Salager, J-L. Heavy oil-water interfacial properties and emulsion stability: influence of dilution. Energy Fuels, 2008, 23, 294-299.
[http://dx.doi.org/10.1021/ef800545k] ]. Dilution changes the interface rigidity. Model oil contains no surfactants, so its emulsion is the least stable. The TSI tests are consistent with the bottle tests.
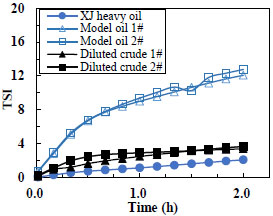 |
Fig. 10 TSI profile of dispersions. |
CONCLUSION
In this work, we analyzed the differences between model oils and reference crude oils from two perspectives: 1. Rheological properties of the pure oils; 2. Kinetics and stability of the emulsions.
The experimental results show that the white mineral oil is more similar to crude oils in terms of rheological properties and viscosity-temperature relationship. Silicon oil is similar to crude oil in terms of wave formation and droplet coalescence due to its low oil-water interfacial tension. The emulsion kinetics suggests that the model oil-water mixture is less structurally stable than the crude oils. Blank model oil can be used to simulate the unemulsified oil-water mixing behavior. However, additives are required by emulsification centered investigation because there is still a big difference in emulsion stability between model oils and crude oils.
CONFLICT OF INTEREST
The authors confirm that this article content has no conflicts of interest.
ACKNOWLEDGEMENTS
The authors are grateful for financial support from the Specialized Research Fund for the Doctoral Program of Higher Education, SRFDP 20115121110004.
REFERENCES
| [1] | Bannwart, A.C.; Rodriguez, O.M.; de Carvalho, C.H.; Wang, I.S.; Vara, R.M. Flow patterns in heavy crude oil-water flow. J. Energy Res. Technol., 2004, 126, 184-189. [http://dx.doi.org/10.1115/1.1789520] |
| [2] | Foroughi, H.; Kawaji, M. Viscous oil-water flows in a microchannel initially saturated with oil: flow patterns and pressure drop characteristics. Int. J. Multiph. Flow, 2011, 37, 1147-1155. [http://dx.doi.org/10.1016/j.ijmultiphaseflow.2011.06.004] |
| [3] | Vuong, D.H.; Zhang, H-Q.; Sarica, C.; Li, M. Experimental study on high viscosity oil/water flow in horizontal and vertical pipes. In: SPE Annual Technical Conference and Exhibition; Society of Petroleum Engineers: Louisiana, USA, 2009. [http://dx.doi.org/10.2118/124542-MS] |
| [4] | Wang, W.; Gong, J.; Angeli, P. Investigation on heavy crude-water two phase flow and related flow characteristics. Int. J. Multiph. Flow, 2011, 37, 1156-1164. [http://dx.doi.org/10.1016/j.ijmultiphaseflow.2011.05.011] |
| [5] | Wegmann, A.; Rudolf von Rohr, P. Two phase liquid-liquid flows in pipes of small diameters. Int. J. Multiph. Flow, 2006, 32, 1017-1028. [http://dx.doi.org/10.1016/j.ijmultiphaseflow.2006.04.001] |
| [6] | Rodionova, G.; Pettersen, B.; Kelesoğlu, S.; Sjöblom, J. Preparation and characterization of reference fluid mimicking behavior of North Sea heavy crude oil. Fuel, 2014, 135, 308-314. [http://dx.doi.org/10.1016/j.fuel.2014.07.003] |
| [7] | Angeli, P.; Hewitt, G. Flow structure in horizontal oil-water flow. Int. J. Multiph. Flow, 2000, 26, 1117-1140. [http://dx.doi.org/10.1016/S0301-9322(99)00081-6] |
| [8] | Zong, Y-B.; Jin, N-D.; Wang, Z-Y.; Gao, Z-K. Wang, C. Nonlinear dynamic analysis of large diameter inclined oil-water two phase flow pattern. Int. J. Multiph. Flow, 2010, 36, 166-183. [http://dx.doi.org/10.1016/j.ijmultiphaseflow.2009.11.006] |
| [9] | Utvik, O.H.; Rinde, T.; Valle, A. An experimental comparison between a recombined hydrocarbon-water fluid and a model fluid system in three-phase pipe flow. J. Energy Res. Technol., 2001, 123, 253-259. [http://dx.doi.org/10.1115/1.1410365] |
| [10] | Nädler, M.; Mewes, D. Flow induced emulsification in the flow of two immiscible liquids in horizontal pipes. Int. J. Multiph. Flow, 1997, 23, 55-68. [http://dx.doi.org/10.1016/S0301-9322(96)00055-9] |
| [11] | Russell, T.; Hodgson, G.; Govier, G. Horizontal pipeline flow of mixtures of oil and water. Can. J. Chem. Eng., 1959, 37, 9-17. [http://dx.doi.org/10.1002/cjce.5450370104] |
| [12] | Trallero, J.; Sarica, C.; Brill, J. A study of oil/water flow patterns in horizontal pipes. SPE Production and Facilities, 1997, 12, 165-172. [http://dx.doi.org/10.2118/36609-PA] |
| [13] | Chakrabarti, D.; Das, G.; Ray, S. Pressure drop in liquid-liquid two phase horizontal flow: experiment and prediction. Chem. Eng. Technol., 2005, 28, 1003-1009. [http://dx.doi.org/10.1002/ceat.200500143] |
| [14] | Pal, R. Effect of droplet size on the rheology of emulsions. AIChE J., 1996, 42, 3181-3190. [http://dx.doi.org/10.1002/aic.690421119] |
| [15] | Angeli, P.; Hewitt, G. Pressure gradient in horizontal liquid-liquid flows. Int. J. Multiph. Flow, 1999, 24, 1183-1203. [http://dx.doi.org/10.1016/S0301-9322(98)00006-8] |
| [16] | Charles, M.E.; Govier, G.T.; Hodgson, G. The horizontal pipeline flow of equal density oil-water mixtures. Can. J. Chem. Eng., 1961, 39, 27-36. [http://dx.doi.org/10.1002/cjce.5450390106] |
| [17] | Li, C.; Li, G. Frictional drag behavior of non-newtonian crude oil. Oil Gas Storage Trans., 1997. 17+61-14 |
| [18] | Ghannam, M.T.; Esmail, M.N. Rheological properties of carboxymethyl cellulose. J. Appl. Polym. Sci., 1997, 64, 289-301. [http://dx.doi.org/10.1002/(SICI)1097-4628(19970411)64:2<289::AID-APP9>3.0.CO;2-N] |
| [19] | Celia, C.; Trapasso, E.; Cosco, D.; Paolino, D.; Fresta, M. Turbiscan lab expert analysis of the stability of ethosomes and ultradeformable liposomes containing a bilayer fluidizing agent. Colloids Surf. B Biointerfaces, 2009, 72(1), 155-160. [http://dx.doi.org/10.1016/j.colsurfb.2009.03.007] [PMID: 19376689] |
| [20] | Liu, J.; Huang, X-F.; Lu, L-J.; Li, M-X.; Xu, J-C.; Deng, H-P. Turbiscan Lab® Expert analysis of the biological demulsification of a water-in-oil emulsion by two biodemulsifiers. J. Hazard. Mater., 2011, 190(1-3), 214-221. [http://dx.doi.org/10.1016/j.jhazmat.2011.03.028] [PMID: 21458159] |
| [21] | Murray, B.S.; Dickinson, E.; Wang, Y. Bubble stability in the presence of oil-in-water emulsion droplets: influence of surface shear versus dilatational rheology. Food Hydrocoll., 2009, 23, 1198-1208. [http://dx.doi.org/10.1016/j.foodhyd.2008.07.015] |
| [22] | Jones, T.; Neustadter, E.; Whittingham, K. Water-in-crude oil emulsion stability and emulsion destabilization by chemical demulsifiers. J.
Canadian Petrol. Tech., 1978, 17. [http://dx.doi.org/10.2118/78-02-08] |
| [23] | Kimbler, O.K.; Reed, R.; Silberberg, I. Physical characteristics of natural films formed at crude oil-water interfaces. Soc. Pet. Eng. J., 1966, 6, 153-165. [http://dx.doi.org/10.2118/1201-PA] |
| [24] | Sridhar, S.; Zhang, H-Q.; Sarica, C.; Pereyra, E.J. Experiments and Model Assessment on High-Viscosity Oil/Water Inclined Pipe Flows. In: SPE Annual Technical Conference and Exhibition; Society of Petroleum Engineers: Denver, Colorado, USA, 2011. [http://dx.doi.org/10.2118/146448-MS] |
| [25] | Alvarez, G.; Poteau, S.; Argillier, J-F.; Langevin, D.; Salager, J-L. Heavy oil-water interfacial properties and emulsion stability: influence of dilution. Energy Fuels, 2008, 23, 294-299. [http://dx.doi.org/10.1021/ef800545k] |