- Home
- About Journals
-
Information for Authors/ReviewersEditorial Policies
Publication Fee
Publication Cycle - Process Flowchart
Online Manuscript Submission and Tracking System
Publishing Ethics and Rectitude
Authorship
Author Benefits
Reviewer Guidelines
Guest Editor Guidelines
Peer Review Workflow
Quick Track Option
Copyediting Services
Bentham Open Membership
Bentham Open Advisory Board
Archiving Policies
Fabricating and Stating False Information
Post Publication Discussions and Corrections
Editorial Management
Advertise With Us
Funding Agencies
Rate List
Kudos
General FAQs
Special Fee Waivers and Discounts
- Contact
- Help
- About Us
- Search


The Open Fuels & Energy Science Journal
(Discontinued)
ISSN: 1876-973X ― Volume 11, 2018
Optimal Designs of Well Pattern for the Development of Tight Gas Reservoirs (TGRs)
Jiao Yuwei1, *, Xia Jing1, Yan Jianye2, Xu Daicai2
Abstract
Both horizontal well and fractured-horizontal well have been widely used to develop TGRs. However, the costs of horizontal well and fractured-horizontal well are much higher than the vertical well. Therefore, it is necessary to consider the reservoir conditions for evaluating the potential benefit when choosing well pattern or designing well parameters. In this paper, a simulator of simulating the development of TGRs including slippage flow and stress dependence in matrix, and high-velocity non-Darcy flow and stress effect in hydraulic fractures was firstly developed. Then, it was used to study the development effects of different TGRs using different well patterns and well parameters. Based on the simulation results, the incremental ratio models of horizontal well to vertical well and fractured-horizontal well to horizontal well were achieved. These models can be used to predict the incremental production using horizontal well or fractured-horizontal well. We also obtained the plates of choosing well pattern and designing the corresponding parameters to achieve a good profit in the field.
Article Information

Identifiers and Pagination:
Year: 2016Volume: 9
First Page: 77
Last Page: 90
Publisher Id: TOEFJ-9-77
DOI: 10.2174/1876973X01609010077
Article History:
Received Date: 16/6/2015Revision Received Date: 21/09/2016
Acceptance Date: 26/09/2016
Electronic publication date: 31/10/2016
Collection year: 2016
open-access license: This is an open access article licensed under the terms of the Creative Commons Attribution-Non-Commercial 4.0 International Public License (CC BY-NC 4.0) (https://creativecommons.org/licenses/by-nc/4.0/legalcode), which permits unrestricted, non-commercial use, distribution and reproduction in any medium, provided the work is properly cited.
* Address correspondence to this author at the CNPC Research Institute of Petroleum Exploration & Development, Beijing 100083, China; Tel: 86.134-6679-9517; E-mail: jywkty@163.com
| Open Peer Review Details | |||
|---|---|---|---|
| Manuscript submitted on 16-6-2015 |
Original Manuscript | Optimal Designs of Well Pattern for the Development of Tight Gas Reservoirs (TGRs) | |
INTRODUCTION
Tight gas as one of the main unconventional resources is playing more and more important role in recent years throughout the world. In USA, tight gas comprised 26% by the end of 2010, and it will still keep about 21% by the end of 2035 [1Nitze, P.H.; Gruenspecht, H. Annual Energy Outlook 2012 Early Release; Energy Information Administration, U.S. Department of Energy: Washington, DC, 2012. ] (Fig. 1). 70% of the current worldwide annual production of tight gas is coming from USA, and it will further expand in 2030. However, the production of tight gas outside of North America is an emerging business, and it appears that China and Russia have significant stakes in this domain [2Lepoutre, M. Technical Challenges for Tight & Sour Gas. Proceedings in the 19th World Petroleum Congress, June 29-July 3, Madrid, Spain, 2008.].
In 1970s, the U.S. government decided that the definition of TGR is one in which the expected value of permeability to gas flow would be less than 0.1 md [3Holditch, S.A. Tight gas sands. JPT, 2006, 58(6), 86-93.
[http://dx.doi.org/10.2118/103356-JPT] ]. Holditch [3Holditch, S.A. Tight gas sands. JPT, 2006, 58(6), 86-93.
[http://dx.doi.org/10.2118/103356-JPT] ] reported that the best definition of TGR is “a reservoir that cannot be produced at economic flow rates nor recover economic volumes of natural gas unless the well is stimulated by a large hydraulic fracture treatment or produced by use of a horizontal wellbore or multilateral wellbores”. Some experts thought that the permeability should be between 0.1md and 0.0001md [4Wang, P.; Liu, F.; Ma, F.; Yang, M.; Lin, Y.; Lu, C. Upper limit and distribution of physical property of tight gas sandstones. Oil Gas Geol., 2014, 35(2), 238-243., 5Xie, J.
Tight Gas Wells Type Scheme Selection and Economic Benefit Evaluation, MD thesis, Northeast Petroleum University: Daqing, China, 2014.].
From the above definitions or discussions, we can see that economic development is the ultimate objective of TGR. Actually, the production of gas is not only a function of permeability, and to define TGR is of limited significance by choosing only a single value of permeability [3Holditch, S.A. Tight gas sands. JPT, 2006, 58(6), 86-93.
[http://dx.doi.org/10.2118/103356-JPT] ]. The reservoir thickness, porosity, permeability and other factors have significant impacts on gas production [2Lepoutre, M. Technical Challenges for Tight & Sour Gas. Proceedings in the 19th World Petroleum Congress, June 29-July 3, Madrid, Spain, 2008., 6Brashear, J.P.; Elkins, L.E.; Haas, M.R. Tight Gas Research and Development: The Industry Perspective. Proceeding in the SPE/DOE Unconventional Gas Recovery Symposium of the Society of Petroleum Engineers held in Pittsburgh, May 16-18, PA: USA, 1982.-8Wattenbarger, R.A. Trends in tight gas sand production. JCPT, 2002, 41(7), 17-20.
[http://dx.doi.org/10.2118/02-07-DAS] ]. Moreover, the well pattern also significantly affects the gas recovery, and horizontal and fractured-horizontal wells are common for tight gas development. Comparing with that of the vertical well, the cost of horizontal well is 1.5 to 2.5 times of vertical well, and the overall current commercial success rate of horizontal wells appears to be 65% [9Joshi, S.D. Cost/benefits of horizontal wells, Proceeding in the SPE Western Regional/AAPG Pacific Section Joint Meeting, Long Beach, California, 2003.]. Moreover, the cost will sharply increase as the length of horizontal segment increases. Hydraulic fracturing is also a high cost treatment for increasing production rate contrast to horizontal well. The cost of proppant is approximately 90% of the total cost, and if larger and more fractures are created, it may result in a totally uneconomical project [10Hareland, G.; Rampersad, P.; Dharaphop, J.; Sasnanand, S. Hydraulic Fracturing Design Optimization. Proceeding in the SPE Eastern Regional Meeting, Pittsburgh, Pennsylvania, 1993.]. Thus, a project for horizontal well or fractured-horizontal well should consider the reservoir condition to evaluate the potential benefit.
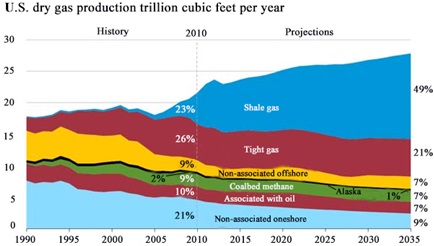 |
Fig. (1) US natural gas production, 1990-2035, EIA Annual Energy Outlook 2012 Early Release. |
The objective of this paper is to achieve the models for optimizing well pattern and parameters in different TGRs. We first developed a simulator of simulating the development of TGR including slippage flow and stress dependence in matrix, and high-velocity non-Darcy flow and stress effect in hydraulic fractures. Then, we studied the development effects of different well patterns and parameters in TGRs with different petro-physical properties. The incremental production-ratio models of horizontal well to vertical well and fractured-horizontal well to horizontal well were achieved for the TGRs with different features, and two TGRs in China are used to perform the design of well pattern. These models can be effectively used to optimize well patterns and corresponding parameters.
MODELING OF GAS TRANSPORT
Based on the mass balance equation and extended Darcy's law, gas transport in tight reservoirs should be
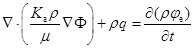 |
(1) |
where Ka is the apparent permeability; ρ is the gas density; μ is the gas viscosity; Φ is the potential; q is the sink/source term; φe is the effective porosity; t is time.
Incorporation of Non-darcy Flow Regimes
In TGRs, the pore size is in nano-scale. Non-Darcy flow has a significant impact on the apparent permeability [11Wang, J.; Liu, H.; Wang, L.; Zhang, H.; Luo, H.; Gao, Y. Apparent permeability for gas transport in nanopores of organic shale reservoirs including multiple effects. Int. J. Coal Geol., 2015, 152, 50-62.
[http://dx.doi.org/10.1016/j.coal.2015.10.004] ]. The apparent permeability of TGRs significantly deviates from the intrinsic permeability because gas flow in such formation occurs by various mechanisms different from the viscous flow regime represented by Darcy’s law [12Bird, R.B.; Stewart, W.E.; Lightfoot, E.N. Transport Phenomena, 2nd ed; John Wiley & Sons: New York, USA, 2002. -14Roy, S.; Raju, R.; Chuang, H.F.; Cruden, B.A.; Meyyappan, M. Modeling gas flow through microchannels and nanopores. J. Appl. Phys., 2003, 93(8), 4870-4879.
[http://dx.doi.org/10.1063/1.1559936] ]. Gas slippage effect or Klinkenberg effect is incorporated into this model by modifying the apparent permeability of gas flow [15Wu, Y.; Pruess, K.; Persoff, P. Gas flow in porous media with Klinkenberg effects. Transp. Porous Media, 1998, 32(1), 117-137.
[http://dx.doi.org/10.1023/A:1006535211684] ]:
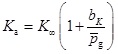 |
(2) |
in which,
 |
(3) |
where K∞ is the absolute permeability; c is a proportional coefficient; λ is the molecular mean free path;
 is the mean gas pressure; r is the hydraulic radius.
Incorporation of Stress Dependence
The impacts of effective stress on gas permeability in tight formation were studied by Soeder, Bustin et al. and Wang and Reed [16Bustin, R.M.; Bustin, A.M.; Cui, A.; Ross, D.; Pathi, V.M. Impact of Shale Properties on Pore Structure and Storage Characteristics. Proceedings in the SPE Shale Gas Production Conference, November 16-18, Fort Worth, Texas, USA, 2008.-18Wang, F.P.; Reed, R.M. Pore Networks and Fluid Flow in Gas Shales. Proceeding in the SPE Annual Technical Conference and Exhibition, October 4-7, New Orleans, Louisiana, 2009.]. The stress-dependent relationship between permeability and effective mean stress for the first type of rock (Type-I rock) called by Raghavan and Chin [19Raghavan, R.; Chin, L.Y. Productivity changes in reservoirs with stress-dependent permeability. SPE Reservoir Eval. Eng., 2004, 7(4), 308-315.
[http://dx.doi.org/10.2118/88870-PA] ] is in well agreement with the experimental data,
 |
(4) |
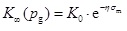
Thus, the absolute permeability at the initial scenario should be:
 |
(5) |
where K0 is the permeability at effective mean stress σm=0; η is a parameter; σm is the mean effective stress, which is mainly related to the vertical overburden load and reservoir pressure by [19Raghavan, R.; Chin, L.Y. Productivity changes in reservoirs with stress-dependent permeability. SPE Reservoir Eval. Eng., 2004, 7(4), 308-315.
[http://dx.doi.org/10.2118/88870-PA] ]:
 |
(6) |
and the initial mean effective stress σm,i by:
 |
(7) |
where
 is the total mean stress pressure, which is a function of σob,v and is nearly a constant value for the system studied. Substituting Eqs. (6) and (7) into Eqs. (4) and (5) for σm and σm,i, respectively, the absolute permeability considering stress dependence effect becomes [20Wang, J.; Luo, H.; Liu, H.; Ji, Y.; Cao, F.; Li, Z.; Sepehrnoori, K. Variations of Gas Flow Regimes and Petro-physical Properties During Gas Production Considering Volume Consumed by Adsorbed Gas and Stress Dependence Effect in Shale Gas Reservoirs. Proceeding in the SPE Annual Technical Conference and Exhibition, Houston, Texas, USA, 2015.].
 |
(8) |
Stress Dependence and High-velocity Non-darcy Flow in Hydraulic Fractures
According to the theory of equivalent fracture conductivity, the relationship between the hydraulic fracture and its equivalent refined grid used in simulation is:
 |
(9) |
where Khf is the permeability of the hydraulic fracture; whf is the fracture aperture;
 is the equivalent permeability of the hydraulic fracture because it is usually handled by a refined grid; Δxhf is the length of the refined grid along the well.
According to experimental results [21Kamenov, A.; Zhu, D.; Hill, A.D.; Zhang, J. Laboratory Measurement of Hydraulic Fracture Conductivities in the Barnett Shale. Proceeding in the SPE Hydraulic Fracturing Technology Conference, The Woodlands, Texas, USA, 2013.], the relationship between the effective permeability and gas pressure can be written as:
 |
(10) |
Similarly handling Eq. (10) with Eq. (8) yields:
 |
(11) |
where αs is stress sensitivity coefficient for hydraulic fracture; Khf(pg) is the permeability of hydraulic fracture considering stress effect. Applying Eqs. (9) and (11) yields:
 |
(12) |
In order to consider the high-velocity non-Darcy effect, the Forchheimer equation is usually used [22Forchheimer, P. Wasserbewegung durch Boden. Z. Ver. Deutsch. Ing, 1901, 45, 1782-1788.-24Li, D.; Engler, T.W. Literature Review on Correlations of the Non-darcy Coefficient. Proceeding in the SPE Permian Basin Oil and Gas Recovery Conference Midland, Texas, USA, 2001.]:
 |
(13) |
By introducing the equivalent permeability and applying the Darcy's law, the following equation is obtained:
 |
(14) |
Applying Eqs. (12), (13), and (14) yields:
 |
(15) |
where β is the high-velocity non-darcy coefficient. The correction of Evans and Civan [25Evans, R.D.; Civan, F. Characterization of non-darcy multi-phase flow in petroleum bearing formation, Final Report for US Department of Energy Assistant Secretary for Fossil Energy, 1994.] is used to determine the high-velocity non-Darcy coefficient,
 |
(16) |
This correlation for β matched with more than 180 data points including those for propped fractures and was found to match the data very well with the correlation coefficient of 0.974 [26Rubin, B. Accurate Simulation of Non-Darcy Flow in Stimulated Fractured Shale Reservoirs. Proceeding in the SPE Western Regional Meeting, Anaheim, California, USA, 2010.
[http://dx.doi.org/10.2118/132093-MS] ].
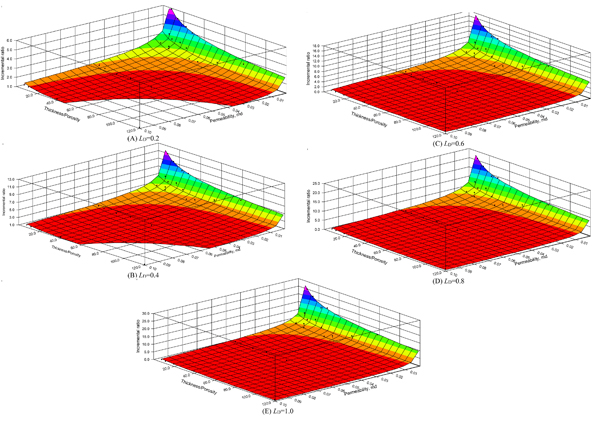 |
Fig. (2) The fitting results of incremental ratios for horizontal wells with different lengths. |
RESULTS AND DISCUSSION
Based on the above model, a simulator of simulating tight gas production was developed. After that, it was used to simulate the development of TGR using vertical well, horizontal well, or fractured-horizontal well.
Modeling of the Incremental Ratio (IR) of Horizontal Well to Vertical Well in Different TGRs
Based on the features of horizontal well and sensitivity analysis, the permeability, porosity, and reservoir thickness are the dominant factors of the IR of horizontal well to vertical well. Moreover, the length of the horizontal well is the key parameter of drilling cost and IRs. Thus, we first choose permeability, porosity, and reservoir thickness to set up simulation cases using Orthogonal Experimental Design (OED), as shown in Table 1. Then, the horizontal wells with different well lengths (LH) for developing TGRs are performed to obtain the IRs.
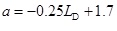
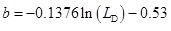
The model of the IRs of horizontal well to vertical well is obtained based on the simulation results using data regression. The fitting results of IRs for horizontal wells with different lengths are shown in Fig. (2). We can see that as the permeability and reservoir thickness increase, the IRs decreases; as the porosity increases, the IRs increases. In order to extend the application of Eq. (17), we further obtain the relations between the coefficients a, b, c and LD based on Fig. (3), which are shown as follows:
 |
(17) |
 |
(18) |
 |
(19) |
 |
(20) |
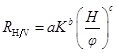
where RH/V is the IR of horizontal well to vertical well; K is the intrinsic permeability; H is reservoir thickness; φ is the intrinsic porosity; LD is the dimensionless length of horizontal well, which equals to the ratio of well length to reservoir length; a, b, and c are the coefficients. Then, the above models are used to predict the IRs of different TGRs, and the comparison of predicted value with simulated value is shown in Fig. (4). Thus, the above predicted model is validated.
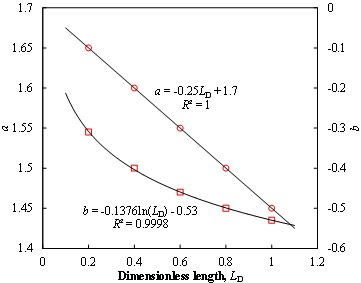 |
Fig. (3) Coefficients a and b vs. Dimensionless length LD. |
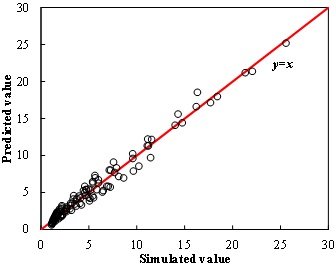 |
Fig. (4) Comparisons between predicted value and simulated value. |
Modeling of The IR of Fractured-horizontal Well to Horizontal Well in Different TGRs
Based on the features of fractured-horizontal well and sensitivity analysis, the permeability, porosity, reservoir thickness, and hydraulic fracture parameters are the dominant factors of the IRs of fractured-horizontal well to horizontal well. But the hydraulic fracture parameters also significantly affect the cost. Hence, we firstly choose permeability, porosity and reservoir thickness to set up simulation cases using Orthogonal Experimental Design (OED), as shown in Table 2. Then, we compare the IRs of fractured-horizontal well to horizontal well with different products of fracture number (nf) and half-length (hf) for developing TGR.
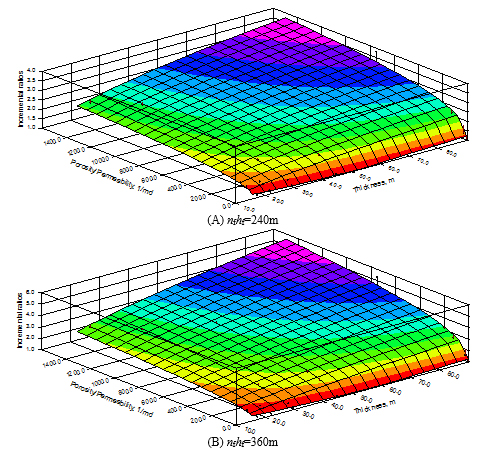 |
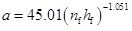
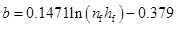
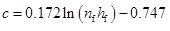
Fig. (5) The fitting results of IRs for horizontal wells with different hydraulic fractures nfhf.. |
The model of the IRs of fractured-horizontal well to horizontal well is obtained based on the simulation results. The fitting results of IRs with different products of nf and hf are shown in Fig. (5). We can see that as the permeability increases, the IRs decreases; as the porosity and reservoir thickness increase, the IRs increases. In order to extend the application of Eq. (21), we obtained the relation between the coefficients a, b, c and nfhf based on Fig. (6), which are shown as follows:
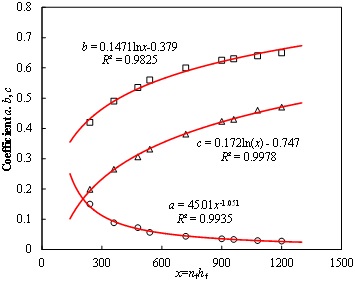 |
Fig. (6) Comparisons between calculated value and simulated value. |
 |
(21) |
 |
(22) |
 |
(23) |
 |
(24) |
where RHf/Hw is the IR of fractured-horizontal well to horizontal well; nf is the fracture number; hf is the half-length of the hydraulic fracture; a, b, and c are the coefficients. Then, the above models are used to predict the IRs of different TGRs with fractured-horizontal well, and the comparison of predicted value with simulated value is shown in Fig. (7). We can see that the agreement is pretty well.
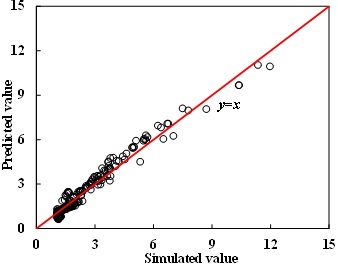 |
Fig. (7) Coefficients a, b, and c vs. nfhf.. |
Model Application for Designing Projects
It is an essential problem to determine the well pattern or horizontal segment length for developing TGR. High profit is the ultimate objective of TGR development. From the economic perspective, horizontal well is not always better than vertical well, and a long horizontal well is not always better than a short horizontal well as well; Moreover, hydraulic fracturing is not always necessary due to its high cost.
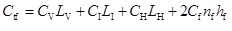
Firstly, we study how to optimize the length of horizontal well. The cost of a horizontal well includes initial and production investment. In this paper, the initial investment which is the main difference between horizontal well and vertical well is taken into account. The initial investment is the sum of vertical segment cost, inclined segment cost, horizontal segment cost, and the well completion cost of horizontal segment [27Hu, J.; Zhou, Z.; Li, X. A method of determining the horizontal-well lateral length with optimal economic value. Natural Gas Industry, 2014, 34(12), 142-146.]:
 |
(25) |
Thus, the cost ratio (CR) of horizontal well to vertical well is as follows:
 |
(26) |
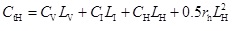
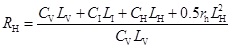
where CtH is the initial investment; CV, CI, CH are the vertical segment cost, inclined segment cost, horizontal segment cost per meter, respectively; rh is incremental coefficient of well completion cost of horizontal segment per square meter.
A higher cost must require a higher gas production. We introduce the coefficient ξ as the ratio of minimum incremental ratio of production (PIR) to the incremental ratio of cost (CIR). In fact, ξ is related to the gas price, and a higher gas price permits a smaller ξ. ξ can be described as:
 |
(27) |
Hence, the following relation must be met for achieving an ideal profit with horizontal well,
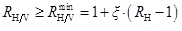 |
(28) |
We first use the above models to study the feasibility of horizontal well in different reservoirs with different scenarios. The related parameters are shown in Table 3. Then, we can obtain the plate of different reservoir thicknesses with different ξ, as shown in Fig. (8). We can see that the plate can be used to determine the reasonable well length for different reservoirs. Thin reservoir is more suitable to use a horizontal well, and longer well does not mean better profit.
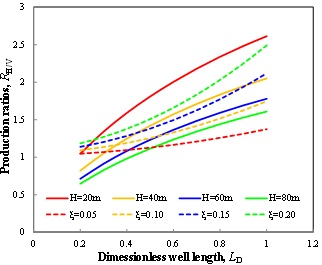 |
Fig. (8) Dimensionless well length vs. Production ratios of different thicknesses and ξ. |
As it is discussed above, hydraulic fractures also need be designed. The cost of hydraulic fracturing is higher than 5,000,000 $ in USA, which is twice of well drilling. Similarly, we can compare the initial investment of fractured-horizontal well with horizontal well. The initial investment is the sum of vertical segment cost, inclined segment cost, horizontal segment cost, and hydraulic fracturing:
 |
(29) |
Thus, the cost ratio of fractured-horizontal well to horizontal well is as follows,
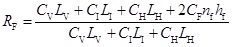 |
(30) |
where CF is the cost of hydraulic fracturing per meter. Similarly, the following relation must be met for achieving an ideal profit with fractured-horizontal well,
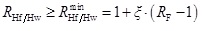 |
(31) |
We first use the above models to study the feasibility of fractured-horizontal well in different reservoirs with different scenarios. The related parameters are shown in Table 4. Then, we can obtain the plate of different permeability with different ξ, as shown in Fig. (9). We can find that the plate can be used to determine the hydraulic fracture parameters; and the lower the permeability is, the more necessary to carry out hydraulic fracturing.
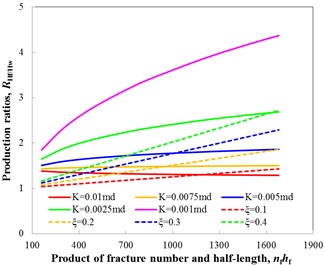 |
Fig. (9) Product of fracture number and half-length vs. Production ratios of different permeability and ξ. |
Cases Study
Two TGRs in China are used to perform the design of different well patterns. The parameter is shown in Table 5.
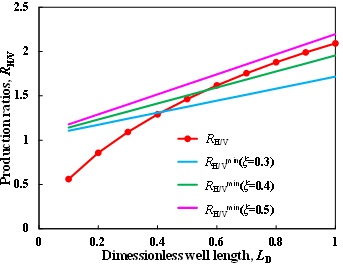 |
Fig. (10) Production ratios vs. Dimenssionless well length in TGR A. |
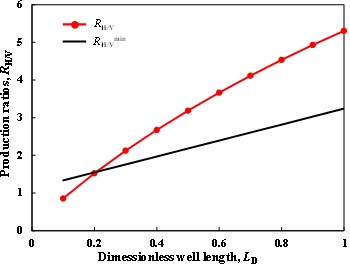 |
Fig. (11) Production ratios vs. Dimenssionless well length in TGR B. |

In TGR A, the permeability is 0.01md, which is relatively high for gas flow into well, so hydraulic fracturing may be not necessary, and vertical well and horizontal well are compared. Fig. (10) shows the production ratios of horizontal well to vertical well with different well lengths. We can see that when LD is less than 0.2, the production ratio is less than 1, vertical well is apparently better. For ξ=0.3, LD must be larger than 0.4 to satisfy the requirement that RH/V> RH/Vmin; Similarly, LD must be larger than 0.6 for ξ=0.4; whereas horizontal well is always unreasonable for ξ=0.5.
In TGR B, the permeability is 0.002md. We first evaluate the feasibility of horizontal well. Fig. (11) shows the production ratios of horizontal well to vertical well with different well lengths. We can see that RH/V is much greater than RH/Vmin even for ξ=1.0, so horizontal well is significantly necessary. Then, we evaluate the feasibility of fractured-horizontal well. Fig. (12) shows the production ratios of fractured-horizontal well to horizontal well with different products of fracture number and half-length. We can see that when ξ=0.3, the product should be less than 900 to satisfy the requirement that RHf/Hw> RHf/Hwmin; Similarly, it must be less than 600 and 400 and for ξ=0.4 and ξ=0.5, respectively.
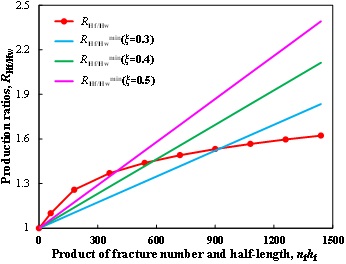 |
Fig. (12) Production ratios vs. Product of fracture number and half-length in TGR B. |
CONCLUSION
In this paper, we first developed a simulator for simulating the development of TGRs including slippage flow and stress dependence in matrix, and high-velocity non-Darcy flow in hydraulic fractures. Then, we studied the development effects of different well patterns and well parameters for developing TGRs. The incremental ratio models of horizontal well to vertical well and fractured-horizontal well to horizontal well were achieved. Moreover, some conclusions were achieved:
(1) The models can be used to obtain the plates of choosing a suitable well type and corresponding parameters;
(2) The effect of horizontal well is significant in the tight gas reservoirs with low permeability, high porosity and small thickness;
(3) The effect of fractured-horizontal well is significant in the tight gas reservoirs with low permeability, high porosity and large thickness;
(4) Longer horizontal well or larger nfhf does not mean to achieve a better economic benefit.
CONFLICT OF INTEREST
The authors confirm that this article content has no conflict of interest.
ACKNOWLEDGEMENTS
This study was supported by Science Foundation of CNPC Research Institute of Petroleum Exploration & Development, Research on Key Technologies of Natural Gas Development (No. 2014B-1507).
REFERENCES
| [1] | Nitze, P.H.; Gruenspecht, H. Annual Energy Outlook 2012 Early Release; Energy Information Administration, U.S. Department of Energy: Washington, DC, 2012. |
| [2] | Lepoutre, M. Technical Challenges for Tight & Sour Gas. Proceedings in the 19th World Petroleum Congress, June 29-July 3, Madrid, Spain, 2008. |
| [3] | Holditch, S.A. Tight gas sands. JPT, 2006, 58(6), 86-93. [http://dx.doi.org/10.2118/103356-JPT] |
| [4] | Wang, P.; Liu, F.; Ma, F.; Yang, M.; Lin, Y.; Lu, C. Upper limit and distribution of physical property of tight gas sandstones. Oil Gas Geol., 2014, 35(2), 238-243. |
| [5] | Xie, J. Tight Gas Wells Type Scheme Selection and Economic Benefit Evaluation, MD thesis, Northeast Petroleum University: Daqing, China, 2014. |
| [6] | Brashear, J.P.; Elkins, L.E.; Haas, M.R. Tight Gas Research and Development: The Industry Perspective. Proceeding in the SPE/DOE Unconventional Gas Recovery Symposium of the Society of Petroleum Engineers held in Pittsburgh, May 16-18, PA: USA, 1982. |
| [7] | Hayton, S.; Heine, C.; Gratto, B.E. Tight Gas Exploration in Saudi Arabia. Proceeding in the SPE Deep Gas Conference and Exhibition, Manama, Bahrain, 2010. |
| [8] | Wattenbarger, R.A. Trends in tight gas sand production. JCPT, 2002, 41(7), 17-20. [http://dx.doi.org/10.2118/02-07-DAS] |
| [9] | Joshi, S.D. Cost/benefits of horizontal wells, Proceeding in the SPE Western Regional/AAPG Pacific Section Joint Meeting, Long Beach, California, 2003. |
| [10] | Hareland, G.; Rampersad, P.; Dharaphop, J.; Sasnanand, S. Hydraulic Fracturing Design Optimization. Proceeding in the SPE Eastern Regional Meeting, Pittsburgh, Pennsylvania, 1993. |
| [11] | Wang, J.; Liu, H.; Wang, L.; Zhang, H.; Luo, H.; Gao, Y. Apparent permeability for gas transport in nanopores of organic shale reservoirs including multiple effects. Int. J. Coal Geol., 2015, 152, 50-62. [http://dx.doi.org/10.1016/j.coal.2015.10.004] |
| [12] | Bird, R.B.; Stewart, W.E.; Lightfoot, E.N. Transport Phenomena, 2nd ed; John Wiley & Sons: New York, USA, 2002. |
| [13] | Ho, C.K.; Webb, S.W. Gas Transport in Porous Media; Springer: Netherlands, 2006. [http://dx.doi.org/10.1007/1-4020-3962-X] |
| [14] | Roy, S.; Raju, R.; Chuang, H.F.; Cruden, B.A.; Meyyappan, M. Modeling gas flow through microchannels and nanopores. J. Appl. Phys., 2003, 93(8), 4870-4879. [http://dx.doi.org/10.1063/1.1559936] |
| [15] | Wu, Y.; Pruess, K.; Persoff, P. Gas flow in porous media with Klinkenberg effects. Transp. Porous Media, 1998, 32(1), 117-137. [http://dx.doi.org/10.1023/A:1006535211684] |
| [16] | Bustin, R.M.; Bustin, A.M.; Cui, A.; Ross, D.; Pathi, V.M. Impact of Shale Properties on Pore Structure and Storage Characteristics. Proceedings in the SPE Shale Gas Production Conference, November 16-18, Fort Worth, Texas, USA, 2008. |
| [17] | Soeder, D.J. Porosity and permeability of Eastern Devonian gas shale. SPE Form. Eval., 1988, 3(1), 116-124. [http://dx.doi.org/10.2118/15213-PA] |
| [18] | Wang, F.P.; Reed, R.M. Pore Networks and Fluid Flow in Gas Shales. Proceeding in the SPE Annual Technical Conference and Exhibition, October 4-7, New Orleans, Louisiana, 2009. |
| [19] | Raghavan, R.; Chin, L.Y. Productivity changes in reservoirs with stress-dependent permeability. SPE Reservoir Eval. Eng., 2004, 7(4), 308-315. [http://dx.doi.org/10.2118/88870-PA] |
| [20] | Wang, J.; Luo, H.; Liu, H.; Ji, Y.; Cao, F.; Li, Z.; Sepehrnoori, K. Variations of Gas Flow Regimes and Petro-physical Properties During Gas Production Considering Volume Consumed by Adsorbed Gas and Stress Dependence Effect in Shale Gas Reservoirs. Proceeding in the SPE Annual Technical Conference and Exhibition, Houston, Texas, USA, 2015. |
| [21] | Kamenov, A.; Zhu, D.; Hill, A.D.; Zhang, J. Laboratory Measurement of Hydraulic Fracture Conductivities in the Barnett Shale. Proceeding in the SPE Hydraulic Fracturing Technology Conference, The Woodlands, Texas, USA, 2013. |
| [22] | Forchheimer, P. Wasserbewegung durch Boden. Z. Ver. Deutsch. Ing, 1901, 45, 1782-1788. |
| [23] | Teng, H.; Zhao, T.S. An extension of Darcy’s law to non-Stokes flow in porous media. Chem. Eng. Sci., 2000, 55(14), 2727-2735. [http://dx.doi.org/10.1016/S0009-2509(99)00546-1] |
| [24] | Li, D.; Engler, T.W. Literature Review on Correlations of the Non-darcy Coefficient. Proceeding in the SPE Permian Basin Oil and Gas Recovery Conference Midland, Texas, USA, 2001. |
| [25] | Evans, R.D.; Civan, F. Characterization of non-darcy multi-phase flow in petroleum bearing formation, Final Report for US Department of Energy Assistant Secretary for Fossil Energy, 1994. |
| [26] | Rubin, B. Accurate Simulation of Non-Darcy Flow in Stimulated Fractured Shale Reservoirs. Proceeding in the SPE Western Regional Meeting, Anaheim, California, USA, 2010. [http://dx.doi.org/10.2118/132093-MS] |
| [27] | Hu, J.; Zhou, Z.; Li, X. A method of determining the horizontal-well lateral length with optimal economic value. Natural Gas Industry, 2014, 34(12), 142-146. |