- Home
- About Journals
-
Information for Authors/ReviewersEditorial Policies
Publication Fee
Publication Cycle - Process Flowchart
Online Manuscript Submission and Tracking System
Publishing Ethics and Rectitude
Authorship
Author Benefits
Reviewer Guidelines
Guest Editor Guidelines
Peer Review Workflow
Quick Track Option
Copyediting Services
Bentham Open Membership
Bentham Open Advisory Board
Archiving Policies
Fabricating and Stating False Information
Post Publication Discussions and Corrections
Editorial Management
Advertise With Us
Funding Agencies
Rate List
Kudos
General FAQs
Special Fee Waivers and Discounts
- Contact
- Help
- About Us
- Search

The Open Medical Informatics Journal
(Discontinued)
ISSN: 1874-4311 ― Volume 13, 2019
Syndrome Diagnosis: Human Intuition or Machine Intelligence?
Øivind Braaten*, Johannes Friestad
Abstract
The aim of this study was to investigate whether artificial intelligence methods can represent objective methods that are essential in syndrome diagnosis. Most syndromes have no external criterion standard of diagnosis. The predictive value of a clinical sign used in diagnosis is dependent on the prior probability of the syndrome diagnosis. Clinicians often misjudge the probabilities involved. Syndromology needs objective methods to ensure diagnostic consistency, and take prior probabilities into account. We applied two basic artificial intelligence methods to a database of machine-generated patients - a ‘vector method’ and a set method. As reference methods we ran an ID3 algorithm, a cluster analysis and a naive Bayes’ calculation on the same patient series. The overall diagnostic error rate for the the vector algorithm was 0.93%, and for the ID3 0.97%. For the clinical signs found by the set method, the predictive values varied between 0.71 and 1.0. The artificial intelligence methods that we used, proved simple, robust and powerful, and represent objective diagnostic methods.
Article Information
Identifiers and Pagination:
Year: 2008Volume: 2
First Page: 149
Last Page: 159
Publisher Id: TOMINFOJ-2-149
DOI: 10.2174/1874431100802010149
Article History:
Received Date: 21/8/2008Revision Received Date: 21/9/2008
Acceptance Date: 21/10/2008
Electronic publication date: 19/11/2008
Collection year: 2008
open-access license: This is an open access article licensed under the terms of the Creative Commons Attribution Non-Commercial License (http://creativecommons.org/licenses/by-nc/3.0/) which permits unrestricted, non-commercial use, distribution and reproduction in any medium, provided the work is properly cited.
* Address correspondence to this author at the Department of Medical Genetics, Ullevål University Hospital, Kirkeveien 166, 0407 Oslo, Norway; E-mail: oivind.braaten@medisin.uio.no
| Open Peer Review Details | |||
|---|---|---|---|
| Manuscript submitted on 21-8-2008 |
Original Manuscript | Syndrome Diagnosis: Human Intuition or Machine Intelligence? | |
1. INTRODUCTION
This study aims to investigate whether artificial intelligence methods can represent objective methods in syndrome diagnosis. Such methods are essential because most syndromes lack a criterion standard of diagnosis, and because clinicians often misjudge the effect that prior probabilities have on the predictive value of diagnostic handles, such as clinical signs.
When a child is born with malformations, it is devastating for the parents. To quickly find a diagnosis is important for possible treatment, prognosis, and for the parents’ need to know.
The child’s malformations may represent a syndrome. But syndrome diagnosis is beset with difficulties, e.g. the lack of an external validation of the diagnosis for most syndromes.
We argue that objective methods are essential in syndrome diagnosis, and, indeed, necessary in all forms of clinical diagnosis.
We show that simple artificial intelligence (AI) methods may be such objective methods, capable of establishing diagnostic criteria in syndrome diagnosis.
1.1. Syndromes: No Criterion Standard of Diagnosis
In this article the word ‘syndrome’ means ‘congenital malformation syndrome’. (For example Table 6 in the results section gives examples of syndromes and the associated clinical signs or features). A syndrome is a clinical delineation based on the presence of a set of clinical signs. The standard method in clinical syndrome diagnosis is the ‘pattern recognition’ method where the clinician looks for the clinical signs that make up a certain syndrome.
For most syndromes, there is no ‘gold standard’ or ‘criterion standard’ of diagnosis. There may thus be no biochemical, radiological, DNA diagnostic or chromosomal investigation to verify the diagnosis. The accuracy (validity, ‘correctness’) of the diagnosis may for many syndromes have to be relinquished because of this lack of a criterion standard of diagnosis. Still, the sine qua non of scientific method - consistency - remains a fundamental goal.
1.2. The Effect of Prior Probability on Predictive Value Confuses the Issue
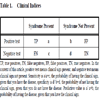
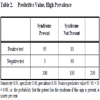
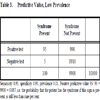
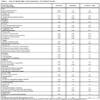
The predictive value of clinical signs is strongly dependent on how common the syndrome is, the ‘prior probability’. Tables 1, 2 and 3 show the striking effect of the prior probability on a clinical sign’s worth as a diagnostic measure. Clinicians do not always estimate the prior probability of a disease correctly [1Cahan A, Gilon D, Manor O, Paltiel O. Probabilistic reasoning and clinical decision-making: do doctors overestimate diagnostic probabilities? QJM 2003; 96: 763-9.-3Richardson WS. Five uneasy pieces about pre-test probability J Gen Intern Med 2002; 17: 882-3.] -- the standard prevalence figures do not necessarily apply in a differential diagnostic situation. This often leads to confusion about the diagnostic value of a particular diagnostic sign.
1.3. The Philosophical-Scientific Issue
The lack of objective methods has a philosophical-scientific, and a practical aspect.
The question may seem a problem of marginal importance, of interest to those involved in the mathematical side of medicine. On the contrary, it is a major, though not much recognised problem. Objective methods are necessary in the reductionist philosophy of science that medicine claims to be a part of. The question is at the foundation of medicine as a scientific discipline. If diagnoses cannot be validated against a criterion standard, and are not even consistent, it is not possible to consider medicine a scientific discipline.
It could be argued that the problem of ‘no criterion standard’ of diagnosis extends to virtually all areas of medicine. Both clinical diagnosis and laboratory diagnosis may vary from one medical practitioner to another. Even for diseases such as diabetes, hypertension or peptic ulcer, doctors may differ in what the definition of the disease is. Although professional bodies establish diagnostic criteria, these may not be congruent with what an individual doctor uses. For clinical diagnoses there may be no agreed-upon diagnostic criteria. Since a diagnosis links to information about prognosis and treatment, vague diagnostic criteria may be harmful both in medical practice and in medicine as science.
1.4. The Consequences of Diagnostic Errors
A false positive diagnosis may lead to the patient receiving unnecessary and potentially harmful treatment. It may mean fear and worry for the patient and her or his relatives.
A false negative diagnosis may mean the patient will forgo life-saving or disease modifying treatment, or important educational measures.
Depending on the situation, both false positive and false negative diagnoses may lead to further unnecessary, potentially harmful, and costly investigations.
1.5. Objective Methods are Needed to Establish Diagnostic Criteria
It is obviously important to avoid the diagnostic errors and their consequences. The prevalent intuitive pattern recognition approach to syndrome diagnosis is open to misdiagnoses. Objective methods can act as a corrective to the intuitive approach and help remedy some of its shortcomings.
We approach this by trying to establish diagnostic criteria to be used by clinicians.
1.6. Objective Methods: Mathematical--Statistical Approaches
Mathematical-statistical methods might represent methods that could establish diagnostic criteria. But there are problems with using statistical methods, primarily because basic assumptions often are not met. A number of statistical classification methods have been applied to syndromology, such as factor analysis/ principal component analysis [4Haley RW, Kurt TL, Hom J. Is there a Gulf War Syndrome? Searching for syndromes by factor analysis of symptoms JAMA 1997; 277: 215-2.,5Kosaki K, Jones MC, Stayboldt C. Zimmer phocomelia: delineation by principal coordinate analysis Am J Med Genet 1996; 66: 55-9.], discriminant analysis [6Ross JL, Kushner H, Zinn AR. Discriminant analysis of the Ullrich-Turner syndrome neurocognitive profile Am J Med Genet 1997; 72: 275-80.-10Astley SJ, Clarren SK. A fetal alcohol syndrome screening tool Alcohol Clin Exp Res 1995; 19: 1565-71.], log-linear analysis [11Neel JV, Julius S, Weder A, et al. Syndrome X: is it for real? Genet Epidemiol 1998; 15: 19-32.], latent class analysis [12Volk HE, Henderson C, Neuman RJ, Todd RD. Validation of population-based ADHD subtypes and identification of three clinically impaired subtypes Am J Med Genet B Neuropsychiatr Genet 2006; 141B: 312-8.], and cluster analysis [13Preus M. The Williams syndrome: objective definition and diagnosis Clin Genet 1984; 25: 422-8.,14Verloes A. Numerical syndromology: a mathematical approach to the nosology of complex phenotypes Am J Med Genet 1995; 55: 433-.].
Most multivariate statistical methods are parametric, and require multinomial normal distributions of the variables, as well as continuous variable values. These basic assumptions can rarely be met. Missing values for one or more variables is often an additional problem.
1.7. Objective Methods: Sophisticated AI Methods
Several artificial intelligence and informatics methods could be used to tease out the clinical signs with the highest predictive value in syndrome diagnosis. Neural nets, support vector machines, and non-negative matrix factorization [15Kotsia I, Zafeiriou S, Pitas I. A novel discriminant non-negative matrix factorization algorithm with applications to facial image characterization problems IEEE Trans Forensic Security 2007; 2: 588-95.,16Pascual-Montano A, Carmona-Saez P, Chagoyen M, et al. bioNMF: a versatile tool for non-negative matrix factorization in biology BMC Bioinform 2006; 7: 366.] are examples of such methods.
Case based reasoning [17Evans CD. A case-based assistant for diagnosis and analysis of dysmorphic syndromes Med Inform (Lond) 1995; 20: 121-31.,18Evans CD, Winter RM. A case-based learning approach to grouping cases with multiple malformations MD Comput 1995; 12: 127-36.] and the ID3 algorithm [19Braaten O. Artificial intelligence in pediatrics: important clinical signs in newborn syndromes Comput Biomed Res 1996; 29: 153-61.] have previously been tried as alternatives to statistical methods.
Problems with the more sophisticated AI methods are that they may seem so complex and unfamiliar as to alienate clinicians who would be the ones to use the results of the analyses. Especially with small data sets there is also the problem of using too much sample specific information and not getting generalizable results, i.e. overfitting.
1.8. Objective Methods: Our Approach
We hold that some fundamental artificial intelligence techniques can successfully be applied to the problem of establishing diagnostic criteria.
We introduce a feature vector method, a set method, and also apply other artificial intelligence methods.
The techniques we propose are variants of known methods rather than basically new. What we argue is that the situation in syndrome diagnosis warrants objective methods, i.e. these methods are a necessity, and the methods we propose represent a possible practical solution. The application of these methods to syndrome diagnosis is new, and, in our opinion, an example of a type of approach that is necessary.
1.9. Conclusion
In syndrome diagnosis there is often no criterion standard of diagnosis.
In syndrome diagnosis as in medical diagnosis in general there is a need to be alert to the strong effect of prior probability on the predictive value of diagnostic indicators, such as clinical signs. Objective methods can help counteract the misdiagnoses that can be caused by neglecting this. The human intuitive approach is not very good at estimating and taking into account the probabilities involved.
Objective methods are warranted as a corrective to the intuitive approach to syndrome diagnosis.
Using mathematical-statistical approaches entails problems with the basic assumptions of these methods.
Using the more sophisticated AI methods may also violate basic assumptions. The complexity of these methods may alienate clinicians.
We apply two simple informatics/ artificial intelligence methods to see whether these methods can help establish diagnostic criteria for syndromes.
2. MATERIAL AND METHODOLOGY
We created a database of machine-generated patients.
We applied ‘the vector method’ and the set method as well as one artificial intelligence reference method - the ID3 -, and two mathematical reference methods -- cluster analysis and the naive Bayes -- to this patient series.
The Birth Defects Encyclopedia (BDE) [20Buyse M. Birth Defects Encyclopedia Dover: Center for Birth Defects Information Services Inc 1990.] -- a classical catalogue of clinical syndromes -- lists the occurrence (prevalence or incidence) of syndromes along with the clinical signs found in the syndrome. It also lists the frequency of these clinical signs in each syndrome.
In this study, we included syndromes with a listed occurrence of one per fifty thousand or more. Some conditions were excluded, such as isolated neural tube defect, as well as several groups of syndromes, for example the arthrogryposes.
We generated ‘artificial patients’ based on the BDE.
The data from the BDE was transformed into artificial patients in the following manner: For each syndrome the figure for occurrence, e.g. 1/ 20 000, was multiplied by a common arbitrary figure, e.g. 100 000. This gave the number of artificial patients, in this case five artificial patients. For each artificial patient, the algorithm had to decide whether each clinical sign was to be present or not. For this, it used the listed frequency of the clinical sign for this syndrome. For each sign, a random number between zero and one was generated. If the random number was smaller than the listed frequency of the sign, it was decided that this sign would be present in this particular artificial patient. If the random number was larger than the listed frequency of the sign, it was decided that this sign would not be present in this artificial patient.
Each artificial patient therefore consisted of a syndrome name and a list of signs present (‘1’) or not present (‘0’).
We generated six thousand artificial patients. This gave a reasonable number of patients even for the least common syndromes.
The list of artificial patients had the syndromes in ‘true proportion’ to their occurrence as given in the BDE. The clinical signs had the same overall frequency as listed in the BDE. Any non-random co-existence of clinical signs was lost by the randomization process.
2.1. The ‘Vector Method’
The vector method algorithm starts with a set of patients with known diagnoses on the one hand and a patient to be diagnosed on the other hand.
In our context, the database of patients with known diagnoses was the artificially generated patients.
When presented with a new case - the patient to be diagnosed - the main procedure of the vector method algorithm compared the new case to all existing cases. For each individual case in the database, it calculated the ‘distance’ between the patient to be diagnosed and the database case. The algorithm assigned a new case to the syndrome diagnosis where the ‘distance’ was smallest.
Basically, the ‘distance’ is the number of clinical signs that two patients do not have in common, i.e. those signs that either of the patients has and the other does not have.
The algorithm calculated this distance by finding the ‘exclusive or’ for a pair of patients, i.e., the signs present in one syndrome patient but not the other.
This represents the difference or the dissimilarity or the distance between the two cases.
2.1.1. Ties
In some instances, two cases or more in the database had equally small distances to the case that was to be diagnosed. In this situation, the new case was assigned the diagnosis of the database case belonging to the most prevalent of the syndromes with the same distance.
2.2. The Set Method
The vector method algorithm would diagnose a new patient, but did not give information about which signs were used in diagnosis.
To present such a list of clinical signs, we applied a set method to the database of artificial patients as well.
The approach of the set method is similar to the one used by the vector method algorithm, but with the set method there were no individual patients to be diagnosed. The set method finds a list of clinical signs common to each syndrome group - a ‘feature vector’.
The algorithm first found the intersection of the lists of clinical signs for all pairs of patients for a given diagnostic group. We thus got all sets of features common to at least two patients. The algorithm then proceeded by intersecting all pairs of these sets again, producing sets of clinical signs common to at least four patients, and so on. We repeated this cycle until no more feature sets were produced. In this way, we found the most common sets of features for each syndrome.
However, the most common set of features may not be the most predictive. The clinical signs that are common in one syndrome, may be common in another syndrome as well. This set of features then cannot be used to distinguish between diagnostic groups.
We therefore searched for prototypes - feature vectors which were common to a large number of the patients in a given diagnostic group, but which differed from common feature vectors of other diagnostic groups. The algorithm also identified subclasses within diagnostic groups. If a large subclass existed within a syndrome, the algorithm rendered the feature vector for that subclass.
2.2.1. Computer and Programming Language
We used the Lisp programming language. The programs were run on a PC with the Linux operating system.
2.3. The Reference Methods
As a reference for basic artificial intelligence methods, we used the ID3 algorithm, cluster analysis, as well as a ‘naive Bayes’ ‘calculation’.
2.3.1. The ID3 Identification Tree Method
The ID3 starts by dividing the patients into two subgroups, where each subgroup is as homogeneous as possible. Homogeneous in our context means that the patients have the same clinical signs. After the first division into subgroups, each subgroup is subdivided into two new subgroups, and so on. This procedure builds a tree, where the original group is the root/ trunk, subgroups are branches, subsubgroups are twigs, and the basic unit of analysis is a leaf. The basic unit of analysis is e.g. an individual patient or a syndrome. The signs used to discriminate between groups, are the branching points in the tree.
To decide how homogeneous a group is, the ID3 algorithm uses an information theory formula:
where nb is the number of instances in branch b, nt is the total number of instances in the whole tree, and nbc is the total of instances in branch b of type c. In our context, ‘type c’ stands for ‘syndrome patients who have a certain clinical sign’. At each branching point in the tree, the remaining syndrome patients are divided into two groups, those who have the clinical sign and those who do not have the clinical sign.
2.3.2. Cluster Analysis
With the cluster analysis runs, we used the same data sets as we used for the runs using the basic artificial intelligence methods.
We ran cluster analyses using average linkage between groups, and nearest neighbour as the clustering method. Since our data were binary, we used a binary measure of similarity (‘Sokal and Sneath 5’, the squared geometric mean of conditional probabilities of positive and negative matches). Clinical signs were used as the basic unit of analysis.
2.3.3. ‘Naive Bayes’ Calculations
Theoretically, the optimal way of finding which clinical signs have the largest predictive value, is using a calculation based on Bayes’ formula. This formula takes into account the sensitivity as well as the specificity of the clinical sign, and the prior probability of the syndrome.
There are two problems with using ‘Bayes’ formula. First, it assumes that clinical signs are independent. This does not always hold true. ‘Upward slanting palpebral fissures’ as a sign clearly is not independent mathematically from ‘downward slanting palpebral fissures’. ‘Low set ears’ and ‘upward slanting palpebral fissures’ probably occur together more often than expected by chance, etc.
Secondly, the figures that go into Bayes’ formula are often not readily available.
2.4. Runs Using Artificial Intelligence Methods
In these runs, the results presented for the vector method algorithm, the set method, the ID3 and the ‘naive Bayes’ ‘ are all averages of ten runs with six thousand artificial patients in each run. The vector method algorithm was directly applied to ten consecutive batches of six thousand patients, i.e. with no training phase. The ID3 and set methods were first trained on a set of six thousand patients, and then tested with the ten batches of six thousand patients each. Each batch of six thousand patients for the test runs was new, in that it was generated anew. However, the batches were all made using the same procedure for generating patients.
3. RESULTS
3.1. General Observations
3.1.1. Feasibility of the Artificial Intelligence Approach
The vector method had a low diagnostic error rate. This holds true for the global error rate, as well as for the error rates of the individual syndromes. The set method attained a high predictive value for most of the sets of clinical signs.
These basic artificial intelligence methods were easy to implement, rapid, and showed consistent results in repeated runs.
3.1.2. Correspondence Between Artificial Intelligence Methods and Reference Methods
There was a good correspondence between comparable methods.
The set method on the one hand, and the cluster analysis using clinical signs as the basic unit on the other hand, gave signs or groups of signs that match.
3.2. The Artificial Intelligence Methods
3.2.1. The Vector Method Algorithm
With the vector method algorithm, there was no learning phase. This algorithm directly diagnosed the patients.
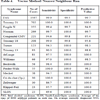
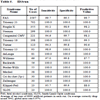
As seen in Table 4, the predictive values were high, with the lowest being 94.9 for fragile X syndrome. Fragile X syndrome does not have many distinguishing features in the newborn period.
The global error rate is satisfactory. However, quite low sensitivities were observed for some syndromes, with Smith-Lemli-Opitz syndrome (SLOS) at a low of 69.6%.
The vector method did not produce any output other than diagnoses. Thus, the algorithm did not have to make any concessions for the sake of readability. The algorithm could therefore use all available information without doing any pruning. (‘Pruning’ here means removing twigs on an ID3 tree, or parts of other search results which do not cover many cases, but which contribute to making it more complex). The nearest neighbour algorithm attained very high specificities, at one hundred per cent, or close to a hundred per cent.
3.2.2. The Set Method
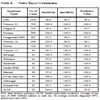
The set method table (Table 6) lists the sets of signs found by the set method, along with their clinical indices. It should be stressed that these are sets of signs, i.e. either the full set listed is present, or it is not. This theoretically should have the effect of lowering sensitivity and increasing specificity. The impression from the tables is definitely that the specificity is higher than is usual, in many instances 100%.
Yet, the sensitivity does not seem to be dramatically lowered, though e.g. Smith-Lemli-Opitz syndrome (SLOS) with the set method is down to a 15% sensitivity. Although the predictive value is very good, this particular set will therefore not be a very useful set of signs in diagnosis.
The lists of signs found by the set method have been pruned to make them more accessible to a human reader. We have tried to strike a balance between two concerns. The lists of clinical signs that we present are few per syndrome, and fairly short, in some instances the list of signs is just one single clinical sign. The sensitivity and specificity are still in general quite acceptable. The signs found make sense from a clinical point of view. The most cumbersome diagnoses are trisomy 13 and Zellweger syndrome. In trisomy 13 four lists of three clinical signs each are presented. In Zellweger syndrome, the longest list has four clinical signs that have to be present simultaneously.
On the other hand, ten of the seventeen syndromes have fairly predictive lists of only one sign.
The clinical sign ‘short palpebral fissures’ has a predictive value of one hundred per cent. It has a sensitivity of 89%, so this is a useful clinical sign.
3.3. The Reference Methods
3.3.1. The ID3
As seen in Table 5, the global error rate is low for the ID3 run, at about the same level as the vector method.
3.3.2. Cluster Analysis
Table 7 shows a dendrogram, after a cluster analysis has been run, where the clinical signs were used as the basic measure of analysis.
The triad of long eyelashes, synophrys and hirsutism is characteristic of Cornelia de Lange syndrome. Hepatosplenomegaly and omphalocoele are less distinctive, but point to Beckwith-Wiedeman syndrome. The hepatosplenomegaly alone also fits with Zellweger syndrome or congenital cytomegalovirus infection (CMV). Though not syndrome specific, this sign could be seen as pointing to this group of syndromes. ‘Cat like cry’ and round face are hallmarks of ‘Cri du chat’ or monosomy of the short arm of chromosome five. Williams syndrome is characterized by broad nasal tip/ broad nasal bridge. The single sign occipital encephalocoele is a strong pointer to Meckel syndrome.
Three syndromes have several similarities as far as clinical signs are concerned: Noonan syndrome, Turner syndrome and Klippel-Feil syndrome. The next group of clinical signs, hypertelorism, downward slanting palpebral fissures, short neck, and low hairline fit these syndromes. It can be seen from the arbitrary scale of the dendrogram that hyperelorism and downward slanting palpebral fissures are closely related, and in comparison stand apart from short neck and low hairline. This may distinguish Noonan syndrome from Turner syndrome and Klippel-Feil syndrome. Turner syndrome patients when newborn also have edema of hands and feet, found as a single clinical sign at line nine from the bottom of the dendrogram.
A large group of clinical signs, from polydactyly to simian crease, denote the trisomies (trisomy 21, 18 and 13). The first and smallest subgroup of this group fits trisomy 13 and 18, with the signs polydactyly, prominent calcaneus, cryptorchidism and micrognathia. The second, larger subgroup of clinical signs here is consistent with trisomy 21 (Down syndrome).
Because of the relatively high prevalence of the trisomies, some clinical signs seem to have been ‘stolen’ from the less prevalent syndromes. An example of this is the Prader-Willi syndrome (hypotonia, cryptorchidism).
No individual syndrome springs to mind for hypogenitalism as a single sign. In this context, however, hypogenitalism would strongly suggest Prader-Willi syndrome. Similarly, large ears strongly indicate Fragile X/ Martin-Bell syndrome.
Short palpebral fissures, long philtrum, and midface hypoplasia define fetal alcohol syndrome.
This leaves the signs microphtalmia, low birth weight and microcephaly as signs with no associated syndrome.
The syndromes that have not been taken into account are Smith-Lemli-Opitz syndrome (SLOS) and to a certain degree Zellweger syndrome and congenital cytomegalovirus infection. Smith-Lemli-Opitz syndrome (SLOS) seems to be difficult to diagnose for several of the methods with the data used here.
3.3.3. ‘Naive Bayes’ Calculations
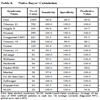
The results for the ‘naive Bayes’ ‘calculations are listed in Table 8. Although the difference is not large, the naive Bayes’ calculations attain the lowest global error rate of diagnosis. Like in the vector method runs, the naive Bayes’ calculation uses all available information, and does not have to compromise to satisfy a demand for human readability.
3.4. Comparing the Methods
3.4.1. The Vector Method Versus the Set Method Versus ID3
These three methods did roughly equally well as judged by the overall error rate. None of the methods did very badly in any of the syndrome groups. (It would have been possible to have a good overall performance, even with a poor performance in the smaller syndrome groups).
Small variations in specificity could lead to relatively large variations in predictive value.
3.4.2. The Set Method Versus Cluster Analysis
These two methods are comparable in that they both rendered lists or clusters of clinical signs. We chose cluster analysis as a reference method since it is a mainstream mathematical method. The cluster analysis with clinical signs as the basic unit is most appropriate for comparison with the set method. This analysis did not name syndromes, it just grouped clinical signs. Given this restriction, the clinical signs grouped by the cluster analysis, and the sets of signs found by the set method match reasonably well. For example, Table 6 shows, from the top, that FAS (fetal alcohol syndrome) according to the set method has the signs short palpebral fissures, and midface hypoplasia. Table 7, the cluster anaysis, shows in line 5, 4 and 3 from the bottom, that short palpebral fissures, long philtrum, and midface hypoplasia are grouped closely together. Next, for trisomy 21 (Down syndrome) in Table 6 the set method found the signs flat occiput, upward slanting palpebral fissures, and flat face. In Table 7 (the cluster analysis) in the middle of the figure finds a narrow grouping of flat face, upward slanting palpebral fissures, and flat occiput.
4. DISCUSSION
The principal aim of this study was to demonstrate that our vector method and other basic artificial intelligence methods represent objective methods that are essential in establishing diagnostic criteria in syndromology.
4.1. The Artificial Intelligence Methods
The vector method attained high rates of correct diagnoses. The set method did find a set of clinical signs for each syndrome diagnosis. These findings were corroborated by the results of the cluster analysis. The clinical signs teased out by the set method are also reasonable from a clinical point of view.
In contrast to many other studies, our study had a data set with correct proportions between the different syndrome diagnoses.
Thus, the study has dealt with the problem of prior probabilities.
If the artificial intelligence methods can successfully be applied to data from artificially generated patients, it seems valid to infer that they could be used on data from real patients.
The algorithms found clinically useful signs, signs that may be used both by clinicians, and for machine diagnosis.
The vector method and set method’s main advantages are
- Robustness
These methods are robust in that:
- They do not require normal distributions of variable values.
- They do not require statistical independence of signs.
- They can handle binary variables.
- They can handle missing values.
- Simplicity
- The methods are basic and easy to understand.
- Power
- The methods are powerful in that they can handle larger amounts of data than most of its competitor methods. They are also very fast.
- Scalability
- Some methods which are useful with a small number of cases/ patients do not scale up to large numbers. The vector method should be able to manage tens of thousands of features and hundreds of thousands of patients. In practice this means the limiting factor will be how many patients the researcher is able to collect.
The term predictive value used for the vector method algorithm is to a certain degree a misnomer, since there was no clinical sign or set of clinical signs that could be evaluated for predictive value. The ‘predictive value’ here is calculated post hoc. The term has been kept for consistency.
The time used by the vector method algorithm increases linearly with the number of cases (O(n)), while the time increases as the square of the number of cases for the set method (O(n*n)).
4.2. Cluster Analysis
In this study, we used cluster analysis as a control, to see if the findings by the set method could be substantiated. The cluster analysis lends support to the set method findings.
4.3. Details of Our Study -- Discussion of Validity of Results
4.3.1. General Considerations
Using Randomly Generated Patients
Doctors as well as informaticians often prefer using ‘real patients’ to e.g. machine generated patients. Syndromes are rare, so it would in practice be a prohibitive task to find a representative number of patients for each syndrome group. Furthermore, biases may be introduced when using selected groups of ‘real patients’, e.g. by the inclusion of only the ‘classical cases’ in the patient series. Thus, it may actually be the better option to use machine-generated patients.
In a situation with no criterion standard, it would be potentially misleading to directly compare the performance of the artificial intelligence methods with clinicians’ performance. If either approach - AI or clinical - were chosen as the reference standard, that approach by definition would outperform the other.
There are overwhelming practical and methodological problems with doing a prospective study encompassing all syndromes to establish the frequency of clinical signs in each individual syndrome and in the patient group at large.
Our primary goal was to demonstrate that the artificial intelligence methods could be used to pick out the most predictive clinical signs in syndrome diagnosis. We were not concerned with diagnosis of individual syndrome patients. We therefore chose the scheme described using figures from the Birth Defects Encyclopedia, and randomly generated artificial patients.
Our randomization procedure generated a small number of ‘patients’ with very few clinical signs just by chance. Since it was set up to generate a clinical sign in an individual patient with a probability of 0.9 if 90% of patients were listed in BDE to have the sign, 1 in 10 would not have the clinical sign in question. The probability that a given artificially generated patient would lack both of two such signs, would be 0.1*0.1, or one in a hundred. When a large number of patients were generated, the occasional patient would have very few signs altogether.
This will obviously make the diagnostic task more difficult, for an artificial intelligence method, as well as for any other method.
Any co-existence of clinical signs would be lost by the randomization procedure. This may be a source of error when the methods are applied to artificially generated patients, but the first order predictive value of signs is probably greater than the second order or combined effect of two individual clinical signs.
4.3.2. The Set Method
Pruning and Prototyping
The original lists of clinical signs found by the set method are obviously the best to use to arrive at a diagnosis. The set method, though, may also be counter-intuitive, stating that the patient should have all the signs listed. Pruning and prototyping will simplify matters for a clinician as the less important signs are removed, and the remaining list is more manageable. We have arbitrarily pruned by removing lists of clinical signs that contain more than 3-4 signs.
When it comes to machine diagnosis, however, pruning is unnecessary and will only lower the diagnostic performance.
4.4. General Considerations in Syndrome Diagnosis with Respect to our Study
4.4.1. Accept old Diagnoses or form New Ones?
Most studies on syndrome diagnosis accept established diagnoses. Diagnoses in single patients may be questioned, but the diagnostic groups themselves are often considered untouchable.
Using methods such as the vector method or cluster analysis, it is an option to challenge the existing diagnostic groups. Set up in this way, it is conceivable that the nearest neighbour algorithm could suggest lumping or splitting of diagnostic groups, that new groups with different boundaries should be formed, or that totally new groups should be established.
‘New’ syndromes As far as establishing new diagnoses is concerned, an objective method has advantages compared to the pattern recognition method.
The pattern recognition method would be dependent on a single clinician seeing enough cases of a new syndrome to realize it was actually a new syndrome.
The syndromologist would then have to report it, other syndromologists would have to read the report and recognize the syndrome themselves. This obviously works in many cases, since new syndromes are regularly reported.
It is a disturbing fact, though, that we cannot know how many syndromes are not reported. It is reasonable to think that an international central database of syndromes would be useful for awareness to detect new syndromes. One important group would be teratogenic syndromes, e.g. possibly caused by the mother living close to a nuclear plant, caused by estrogen-like pollutants in the environment, caused by maternal drug abuse etc.
4.4.2. Using One Sign Versus Using a Set of Signs
The solution provided by the set method is a set of clinical signs that have to be present simultaneously.
This is different from the single-sign method, where one sign, when found, increases the probability of the syndrome, the next sign may increase or decrease the probability etc.
In general, the requirement for several signs to be present at the same time, increases specificity and decreases sensitivity.
This is reflected in the tables of the Results section, where several lists of signs have a very high specificity, often one hundred per cent. Once found, these clinical signs (the set of clinical signs) will be better predictor variables.
A very long list of signs that have to be present simultaneously, may not be of value to a human diagnostician. Such a list would make perfect sense in machine diagnosis, though.
4.4.3. Using the Sign to Find a Diagnosis Versus Using the Sign to Partition the Universe of Possible Diagnoses
The most common approach with syndrome diagnosis based on clinical signs, is to use single signs to get closer to a diagnosis. With other methods, like the ID3 method, one partitions the ‘universe’ of possible diagnoses and thus continually circles in the few diagnoses that remain. In artificial intelligence, this way of searching is common, whereas in clinical thinking it may not seem that natural (although many diagnosticians use this way of thinking, perhaps unconsciously).
4.4.4. The ‘Closed World Assumption’
In artificial intelligence, it is common to make explicit the concept of the ‘closed world’. Many studies make this assumption, but do not state it explicitly. In the closed world of our study, there were only seventeen syndromes. Thus, if sixteen of the syndromes could be ruled out, the diagnosis would have to be the seventeenth syndrome. This may be unrealistic in a real-world situation.
4.4.5. Inclusion of Negative Signs
Syndromologists often speak of ‘handles’, i.e. clinical signs with a high positive predictive value. We kept to this standard approach of using positive signs, i.e. signs present.
Of course, signs not present may help single out diagnosis just as effectively. Conversely, a sign may have a high negative predictive value, i.e. if this sign is present, the diagnosis becomes much less likely.
4.4.6. Clinical Phenotype or DNA Based Diagnosis?
DNA diagnosis and diagnosis based on the clinical phenotype could either give the same result, or different results. In some cases the problem is small, since there is no alternative to clinical classification and diagnosis.
In other cases, one might ask which would be the ‘correct’ classification.
The clinical classification may be more practical. The DNA diagnosis is easier, more clear cut, and may have a higher status [21Biesecker LG. Lumping and splitting: molecular biology in the genetics clinic Clin Genet 1998; 53: 3-7.].
However, clinical classification is not outdated, and never will be. What is of interest, is ultimately the phenotype, the human being. If the overlap between a phenotypic classification and a DNA classification is little, so is the interest in the DNA ‘defect’.
5. CONCLUSION
For most syndromes there is no criterion standard of diagnosis.
In many cases, one will therefore have to forgo an accurate diagnosis. It is therefore of paramount importance to have a consistent set of diagnostic criteria. Thus, there is a need for objective methods of diagnosis. Traditionally, these have been various statistical methods. However, statistical methods have certain weaknesses, e.g. they require basic assumptions that often cannot be met.
The vector method and the set method used here, are objective methods that are robust, simple and powerful. This study has shown they can successfully be applied to a database of clinical signs and syndrome diagnoses. In this study, we used these basic methods to elicit objective clinical signs with high predictive value; signs that can be used by clinicians.
These methods may also be used in computer assisted diagnostic systems.
In conclusion, the two basic methods used here, can embody the objective methods that are mandatory in syndrome diagnosis, and necessary in all forms of medical diagnosis.
SUPPLEMENTARY MATERIAL
This article is accompanied by an overview slide presentation and it can be viewed at www.bentham.org/open/tominfoj


