- Home
- About Journals
-
Information for Authors/ReviewersEditorial Policies
Publication Fee
Publication Cycle - Process Flowchart
Online Manuscript Submission and Tracking System
Publishing Ethics and Rectitude
Authorship
Author Benefits
Reviewer Guidelines
Guest Editor Guidelines
Peer Review Workflow
Quick Track Option
Copyediting Services
Bentham Open Membership
Bentham Open Advisory Board
Archiving Policies
Fabricating and Stating False Information
Post Publication Discussions and Corrections
Editorial Management
Advertise With Us
Funding Agencies
Rate List
Kudos
General FAQs
Special Fee Waivers and Discounts
- Contact
- Help
- About Us
- Search


The Open Medical Informatics Journal
(Discontinued)
ISSN: 1874-4311 ― Volume 13, 2019
Association Rule Based Similarity Measures for the Clustering of Gene Expression Data
Prerna Sethi*, 1, Sathya Alagiriswamy2
Abstract
In life threatening diseases, such as cancer, where the effective diagnosis includes annotation, early detection, distinction, and prediction, data mining and statistical approaches offer the promise for precise, accurate, and functionally robust analysis of gene expression data. The computational extraction of derived patterns from microarray gene expression is a non-trivial task that involves sophisticated algorithm design and analysis for specific domain discovery. In this paper, we have proposed a formal approach for feature extraction by first applying feature selection heuristics based on the statistical impurity measures, the Gini Index, Max Minority, and the Twoing Rule and obtaining the top 100-400 genes. We then analyze the associative dependencies between the genes and assign weights to the genes based on their degree of participation in the rules. Consequently, we present a weighted Jaccard and vector cosine similarity measure to compute the similarity between the discovered rules. Finally, we group the rules by applying hierarchical clustering. To demonstrate the usability and efficiency of the concept of our technique, we applied it to three publicly available, multiclass cancer gene expression datasets and performed a biomedical literature search to support the effectiveness of our results.
Article Information
Identifiers and Pagination:
Year: 2010Volume: 4
First Page: 63
Last Page: 73
Publisher Id: TOMINFOJ-4-63
DOI: 10.2174/1874431101004010063
Article History:
Received Date: 10/10/2009Revision Received Date: 5/11/2009
Acceptance Date: 5/11/2009
Electronic publication date: 28/5/2010
Collection year: 2010
open-access license: This is an open access article licensed under the terms of the Creative Commons Attribution Non-Commercial License (http://creativecommons.org/licenses/by-nc/3.0/) which permits unrestricted, non-commercial use, distribution and reproduction in any medium, provided the work is properly cited.
* Address correspondence to this author at the Department of Health Informatics and Information Management and Biological Sciences, Louisiana Tech University, Ruston, LA 71272, USA; Tel: 318-257-2862; Fax: 318-257-4896; E-mail: prerna@latech.edu
| Open Peer Review Details | |||
|---|---|---|---|
| Manuscript submitted on 10-10-2009 |
Original Manuscript | Association Rule Based Similarity Measures for the Clustering of Gene Expression Data | |
1. INTRODUCTION
Cancer is the second leading cause of death in United States. According to a report by the American Cancer Society, 23.1% of the deaths in 2006 were caused by cancer. Early detection followed by planning and treatment can significantly reduce the suffering from this disease and lower the healthcare burden. Molecular diagnosis of cancer has the potential to provide personalized healthcare delivery through efficient and accurate computational means with high degrees of specificity and sensitivity. Analysis of microarray gene expression data for cancer classification can lead to information regarding the cellular mechanisms of genes, the regulatory functions of genes, the functions of genes and proteins, the structures of gene networks and pathways, and can yield information relating the risk of being affected by cancer to gene expression profiles [1Beer DG, Sharon LRK, Huang C-C, Giordano TJ, Levin AM, Misek DE. Gene-expression profiles predict survival of patients with lung adenocarcinoma Nat Med 2002; 8: 816-24., 2Cho R, Campbell M, Winzeler E, et al. A genome-wide transcriptional analysis of the mitotic cell cycle Mol cell 1998; 2(1): 65-73.].
Microarray technology has made it possible to monitor the expressions of thousands of genes simultaneously under different tissue types, treatments, or changes in the expression profile over a certain period of time. Consequently, this technology has allowed researchers to obtain the “global” view of the cell for the first time [3Piatetsky-Shapiro G, Tamayo P. Microarray Data Mining: Facing the Challenges ACM SIGKDD Explorations Newsletter 5 2003; 2]. However, the exponentially growing microarray data sets present an overarching challenge for computational scientists to contribute to an understanding of biologically significant cellular mechanisms. With its thousands of uncharacterized variables, microarray data analysis presents one of the most daunting challenges facing bioinformatics. The computational complexity of analyzing microarray data is further enhanced because a large number of genes can correspond to different time sequences or tissue types, having dimensionality that is several orders of magnitude more than the evaluated samples. Further, genes function in a complex, interactive manner, and, hence, the challenge is to narrow down the selection of gene markers by discriminating them from the “house-keeping” genes. The challenge posed in this area is to identify the biologically significant sets of correlated, co-regulated genes that share similar patterns and functions. The ultimate goal is to rely on the derived knowledge and utilize it for the drug discovery process, including biomarker identification and tracking. Data mining offers the promise of precise, accurate learning and discovery mechanisms in such complex data. An approach to narrow the search for a gene marker is to select a set of features (discriminatory genes) based on a statistical or machine learning measure, which can distinguish between types of samples according to their gene expression values. Among the data mining methodologies, unsupervised classification (clustering) has emerged as one of the major methods in understanding the biological process which provide insight into the activity of genes that vary during these processes and their effect on the disease states and cellular environments [4Ben-Dor A, Yakhini Z. Clustering Gene Expression Patterns J Comput Biol 1999; 6: 281-97., 5Shamir R, Sharan R. Algorithmic approaches to clustering gene expression data Curr Top Comput Biol 2002; 269-300.]. Clustering is performed on the genes or samples to identify clusters of genes that have similar expression patterns or clusters of samples that have similar expression profiles which can assist in providing insight into therapeutic and pathogenic studies [2Cho R, Campbell M, Winzeler E, et al. A genome-wide transcriptional analysis of the mitotic cell cycle Mol cell 1998; 2(1): 65-73., 5Shamir R, Sharan R. Algorithmic approaches to clustering gene expression data Curr Top Comput Biol 2002; 269-300.].
1.1. Related Research
Clustering algorithms such as k-means [6Tavazoie S, Hughes JD, Campbell MJ, Cho RJ, Church GM. Systematic determination of genetic network architecture Nat Genet 1999; 22: 281-5.] and hierarchical clustering [7Eisen MB, Spellman PT, Brown PO, Botstein D. Cluster analysis and display of genome-wide expression patterns Proc Natl Acad Sci USA 1998; 95: 14863-8.] group genes or conditions in clusters that exhibit “functionally similar” behavior. Tamayo et al. developed GENECLUSTER [8Tamayo P, Slonim D, Mesirov J, et al. Interpreting patterns of gene expression with self-organizing maps: methods and application to hematopoetic differentiation Proc Natl Acad Sci USA 1999; 96: 2907-12.], which uses self-organizing maps to organize genes biologically. For a review of cluster algorithms for gene expression, we refer to [9Jiang D, Tang C, Zhang A. Cluster analysis for gene expression data: A survey IEEE Tran Knowl Data Eng 2004; 16(11): 1370-86.]. The class of clustering algorithms establishes clusters of correlated genes under certain conditions, limiting their ability by not providing information about embodied associative isomorphic relationships between genes and gene products. The previous results published in [10Becquet C, Blachon S, Jeudy B, Boulicaut JF, Gandrillon O. Strong- association-rule mining for large-scale gene-expression data analysis: a case study on human SAGE data Genome Biol 2002; 3: 1-16.-16Ali K, Manganaris S, Srikant R. Partial classification using association rules. In: Proceedings of the 3rd International Conference on Discovery and Data Mining (KDD); New York USA. 2007; p. 115.] have shown the association rule discovery (ARD) based approach can overcome this limitation by extracting associations among the subsets of genes and providing insight into how genes collectively react under certain conditions. However, the number of associations generated can be large for a gene expression dataset that contains thousands of genes. Further, applying an ARD algorithm also yields redundant rules, only a few of which actually represent important biological relationships. Hence, the challenge is to explore and sift through the thousands of rules to find those that are “meaningful”. The pruning and grouping of the rules can eliminate the redundancy, while providing insight into some important biological associations between the genes. The pruning and grouping of association rules have been studied in the past. Numerous and irrelevant rules have been generated by traditional approaches of association rule mining, many of which are redundant, which further complicates their interpretation [17Liu B, Hsu W, Ma Y. Pruning and summarizing the discovered associations. In: Proceedings of the 5th International Conference on Knowledge Discovery and Data Mining; 1999; pp. 125-34., 18Mannila H, Toivonen H, Verkamo I. Efficient algorithms for discovering association rules In: AAAI Wkshp Knowledge Discovery in Databases. Menlo Park, CA: AAAI Press 1997; pp. 181-92.]. Han et al. [19Han J, Kamber M. Data mining: Concepts and Techniques. 2nd ed. Morgan Kaufmann 2001.] stated that the challenge of mining association rules is not based on the rules discovered under certain constraints but on the discovery of a compact and high quality set of rules. Toivonen et al. [20Toivonen H, Klemettinen M, Ronkainen P, Hatonen K, Mannila H. Pruning and grouping discovered association rules. In: ECML-95 Workshop on Statistics, Machine Learning and Knowledge Discovery in Databases; 1995; pp. 47-52.] introduced the concept of association rule cover for the pruning of association rules. A cover is defined as a “subset of the discovered associations that can cover the database”. The number of rules in a cover can be small and hence a greedy algorithmic approach is proposed to find a good cover, for the pruning of remaining rules. The standard χ2 test employed by Liu et al. [21Liu B, Hsu W, Ma Y. Integrating classification and association rule mining. Proceedings of the Fourth International Conference on Knowledge Discovery and Data Mining (KDD); 1998; p. 27.] prunes irrelevant rules, and the concept of direction setting rules is used to summarize the patterns. Srikant et al. [22Srikant R, Vu Q, Agrawal R. Mining association rules with item constraints. In:Proceedings of the 3rd International Conference on Knowledge Discovery and Data Mining; 1997; pp. 67-73.] and Ng et al. [23Ng R, Lakshmanan L, Han J, Pang A. Exploratory mining and pruning optimizations of constrained association rules In: In:Proceedings of 1998 ACM-SIGMOD International Conference on Management of Data; 1998; pp. 13-24.] used the constraints provided by the user to limit the number of rules that were generated. In other literature, different measures have been proposed to discover the interestingness of a rule. The rule template method from [22Srikant R, Vu Q, Agrawal R. Mining association rules with item constraints. In:Proceedings of the 3rd International Conference on Knowledge Discovery and Data Mining; 1997; pp. 67-73., 23Ng R, Lakshmanan L, Han J, Pang A. Exploratory mining and pruning optimizations of constrained association rules In: In:Proceedings of 1998 ACM-SIGMOD International Conference on Management of Data; 1998; pp. 13-24.] separates only those rules that match the template. Finally, Liu et al. [24Liu L, Chen Y, Shan S, Yin L. Mining Condensed and Lossless Association Rules by Pruning Redundancy. 2 Fifth International Conference on Fuzzy Systems and Knowledge Discovery; 2008; pp. : 591-.] proposed a method, which was based on statistics and probability to get a condensed set of rules by removing redundant rules.
Lent et al. [25Lent B, Swami A, Widom J. Clustering Association Rules. In: Proceedings of the 13th International Conference on Data Engineering; 1997; pp. 220-31.] first proposed the clustering of association rules by developing a geometric-based algorithm that clusters association rules in two-dimensional space. However, this approach restricts to have two fixed attributes in their antecedents. Berrado et al. [26Berrado A, Runger G. Clustering massive categorical data with class association rules. International Conference on Innovations in Information Technology; 2008; pp. 223-7.] introduced SCAR (Supervised Clustering with Association Rules) an algorithm for clustering high dimensional categorical data. SCAR uses association rules to identify the similarity between objects and then groups them into clusters. Zaki et al. [27Zaki MJ, Parthasarathy S, Ogihara M, Li W. New Algorithms for Fast Discovery of Association Rules. In: International Conference on Knowledge Discovery and Data Mining; 1997; pp. 283-6.] proposed an itemset clustering technique that clusters frequent itemsets to approximate maximal frequent itemsets. Quan et al. [28Quan TT, Ngo LN, Hui SC. An Effective Clustering-based Approach for Conceptual Association Rules Mining. In:International Conference on Computing and Communication Technologies; 2009; pp. 1-7.] proposed a technique for mining conceptual association rules which are mined using Formal Concept Analysis (FCA). Since, FCA suffers computationally when used with huge datasets, a distance based similarity metric is used, and data clustering is performed.
In this paper, we propose a formal approach for feature extraction by first applying feature selection heuristics based on the statistical impurity measures, the Gini Index, Max Minority [29Breiman L. Classification and Regression Trees. CRC Press 1984.], and the Twoing Rule [30Murthy SK, Kasif S, Salzberg S. A system for induction of oblique decision trees J Artif Intell Res 1994; 2: 1-33.] to obtain the top 100-400 genes. We then analyze associative dependencies between the genes and assign weights to the genes based on their degree of participation in the rules. Consequently, we present a weighted similarity measure based on the Jaccard [31Tan PN, Steinbach M, Kumar V. Introduction to data mining. Addison-Wesley 2005.] and vector cosine [32Fowlkes EB, Mallows CJ. A method for comparing two hierarchical clusterings J Am Stat Assoc 1983; 78(383): 553-84.] measures to compute the similarity between the association rules. Finally, we group the rules by applying hierarchical clustering. To demonstrate the usability and efficiency of the concept of our technique, we apply it to three publicly available, cancer gene expression datasets and perform a biomedical literature search to support the efficiency of our method.
The rest of the paper is organized as follows. In Section II, we describe the methodology to find frequent patterns, assign weights, and cluster them by using two similarity measures. In Section III, we present the results of our experiments by weighted Jaccard and Cosine similarity measures and outline the featured genes by performing an online biomedical literature search. In Section IV, we present the conclusions of our work.
2. METHODS
Here, we present a novel computational framework for feature extraction and rule grouping based on weighted similarity measures. The overall methodology is illustrated in Fig. (1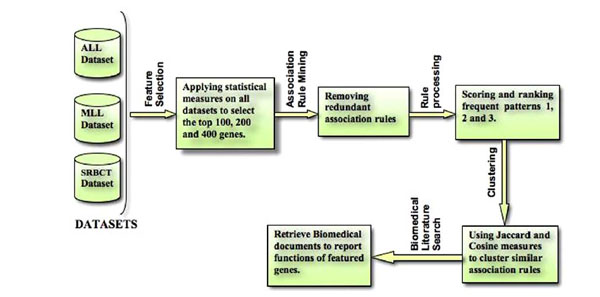 ). The framework consists of the following major computational steps: (1) data preprocessing (standardization and normalization), (2) feature selection (three statistical measures for gene ranking and selection), (3) association rule mining on the selective features to obtain weights for the frequently occurring genes, (4) redundant association rule pruning, (5) association rule clustering based on the manipulation of the Jaccard and cosine similarity measures, and (6) an online biomedical literature search to report the functions/mechanisms of the featured genes.
 |
Fig. (1) Overall framework for feature extraction and clustering of rules on weighted similarity measures. |
2.1. Datasets
The experiments are carried out on three well-known gene expression datasets, and their characteristics are described in Table 1.

ALL:
The ALL dataset [33Yeoh E-J, Ross ME, Shurtleff SA, et al. Classification, subtype discovery, and prediction of outcome in pediatric lymphoblastic leukemia by gene expression profiling Cancer Cell 2002; 1(2): 133-43.] covers six sub types of acute lymphoblastic leukemia: BCR (15), E2A (27), Hyperdip (64), MLL (20), T (43), and TEL (79); the number of samples for each class are shown in parentheses. The dataset is available at http://www.stjuderesearch.org/data/ALL1/.
MLL:
The MLL-leukemia dataset consists of three classes: ALL(24), AML(28), MLL(20) and can be down-loaded at http://research.dfci.harvard.edu/korsmeyer/MLL. htm. The dataset was first studied in Armstrong et al. [34Armstrong SA, Staunton JE, Silverman LB, et al. MLL translocations specify a distinct gene expression profile that distinguishes a unique leukemia Nat Genet 2002; 30: 41-7.].
SRBCT:
The SRBCT dataset [35Khan J, Wei1 JS, Ringnér M, et al. Classification and diagnostic prediction of cancers using gene expression profiling and artificial neural networks Nat Med 2001; 7: 673-9.] is a dataset of small, round, blood cell tumors found in children and can be downloaded at http://chibi.ubc.ca/tmm/raw-data.html. The dataset consists of 83 samples, which are divided into four classes: EWS (29), BL (11), NB (18) and RMS (25).
The datasets are preprocessed using standardization and normalization. Normalization is performed using the z-score method, which transforms the features with mean 0 and standard deviation 1. This process also standardizes the data.
2.2. Feature Selection and Scoring using Associative Pattern Mining
The number of features is large compared to the small number of samples in the gene expression datasets. The program Rankgene [36Su Y, Murali TM, Pavlovic V, Kasif S. RankGene: identi?cation of diagnostic genes based on expression data Bioinformatics 2003; 1578-9.] ranks the features in the dataset. The measures included in Rankgene have been widely used in machine learning or statistical learning theory. We use statistical impurity-based measures, Gini Index (GI), Max Minority (MM), and the Twoing rule (TR) to extract the relevant features. These measures quantify the effectiveness of the feature by evaluating the predictability of a class by dividing the full range of the expression of a given gene into the two intervals of up-regulation and down-regulation. The prediction is based on the presence of all the samples belonging to a particular interval in the same class. We select the Top-100, Top-200, and Top-400 ranked genes from each of the three statistical measures, which formed our reduced feature datasets. In our approach, we apply the three statistical measures, and the variances for a single subset of genes are expected to reflect three statistical properties. If a particular gene is highly ranked, then the other genes, which are correlated with this gene, are also likely to have high ranks [37Hanczar B, Courtine M, Benis A, Hennegar C, Clement K, Zucker J-D. Improving classi?cation of microarray data using prototype-based feature selection SIGKDD Explor Newslett 2003; 5: 23-30.]. We utilize the advantage of this correlation among the highly ranked genes by performing ARD to find frequently occurring sets of genes. ARD was first introduced in [38Agrawal R, Imielinski T, Swami A. Mining association rules between sets of items in large databases. Proceedings of the 1993 International Conference on Management of Data SIGMOD Conference; 1993; pp. 207-16.] and has the following definition.
Let I be the set of items and D be the set of transactions. Each transaction T in D contains a set of items such as T ⊆ I. Association rules follow the form X ⇒ Y, where X ⊆ I , Y ⊆ I , and X ∩ Y = ø is called the antecedent (left hand side or LHS), and Y is called the consequent (right hand side or RHS) of the rule. The meaning of the rule X ⇒ Y is that data instances that contain X are likely to contain Y as well. To select the interestingness of the rules, various measures of significance and interest can be applied, including support and confidence. The support of the rule is the percentage of transactions that contain both X and Y. The confidence of the rule is the conditional probability of Y given X, P(Y / X). The purpose of association rule mining is to find all the rules, which exceed the user specified threshold of support and confidence.
ARD is performed on each of these reduced feature datasets separately to find frequently occurring sets of genes. The frequently occurring genes establish patterns between them of the form Genex ⇒ Geney, which implies that when Genex occurs; it is likely that Geney also occurs. The Frequent-1, Frequent-2, and Frequent-3 patterns are discovered for all the sub-datasets.
The scores for the frequently occurring genes are obtained in the following manner. Let Fk be the set that contains k items occurring together. In our case, k is [1Beer DG, Sharon LRK, Huang C-C, Giordano TJ, Levin AM, Misek DE. Gene-expression profiles predict survival of patients with lung adenocarcinoma Nat Med 2002; 8: 816-24., 3Piatetsky-Shapiro G, Tamayo P. Microarray Data Mining: Facing the Challenges ACM SIGKDD Explorations Newsletter 5 2003; 2]. Let G ⊆ F such that G = {G1, G2,....,Gp} such that be the featured genes that form the frequently occurring itemsets with a support score, si associated with them, and let sij be the number of times genes, GiGj occur together in all the samples. Hence, ∀Gi∃si such that,
The weight Wx for each gene, Gk , in F1, F2 and F3 is calculated using the following formula.
where, k is the number of itemset depending upon whether the gene belongs to F1F2F3, or itemset. A detailed description of this method is available in our previous work [39Sethi P, Alex AE, Alagiriswamy S. Feature Ranking and Scoring of Gene Expression Data Using Associative Pattern Mining. 4th IPAR Conference on Pattern Recognition in Bioinformatics; 2009; p. 10.]. Table 2 is a representative example that shows scores calculated for the set of nine genes forming the reduced feature set using the top 100 ranked genes selected based on Gini Index for the ALL dataset.

Although some of the rules discovered in this process represent important biological relationships between the genes, other rules often contain redundant information, which is difficult for the decision maker to manually analyze. In the pruning phase, we remove the redundant rules using the following concept. If Gene1 ⇒ Gene2, Gene3 is a frequently occurring rule, then the set of rules, Gene1 ⇒ Gene2 ; Gene1 ⇒ Gene3; Gene1,Gene2 ⇒ Gene3; Gene1,Gene3 ⇒ Gene2 will be frequently occurring, an observation which can be derived from the original rule, and hence it would be redundant to analyze them.
2.3. Weighted Similarity Measures
The pruning of the rules removes the redundant associations. However, we are still left with a number of rules, some of which have important biological relationships but are difficult to analyze because of their density. Since, genes exhibit complex relationships, it is important to identify the gene correlations, which contribute to an understanding of biologically significant cellular mechanisms. Thus, we propose two weighted similarity methods based on Jaccard and cosine measures to organize and summarize these gene correlations on the basis of “similarity” which will provide a consistent and precise view of the gene correlations. Previous studies have used the Jaccard coefficient (ratio of the set intersection to the set union) as a similarity metric that describes the degree of overlap (similarity) between the subsets of genes. However, in defining this metric, they do not capture the predictive power of the correlated genes to classify them into samples. Further, they fail to apply any heuristics between two subsets of gene correlations if they have the same cardinality-based similarity measure but entirely different sets of genes present in them. Our proposed method will overcome these limitations by i) using gene ranking measures when discovering gene correlations and ii) assigning weights to the gene subsets based on the cardinality of common genes between them. The cosine measure for the two rules can be arranged into binary valued vectors. It will yield a value of 0 or 1 depending upon whether the common gene(s) between the two rules is present on the RHS or LHS of the rule. This binary value poses a very stringent criterion for the similarity, especially in cases of association rules where the common gene between the rules can be on the either side and the rules will still be similar to some extent. Our proposed weighted cosine measure relaxes the constraint of the cosine similarity measure by computing the dot product with the weights obtained for the genes in Section 2.2.
Let
Let
and the cosine similarity between the two rules can be defined as,
where the rules Rx , Ry can be defined as a vector of genes.
Example 1: Elucidation of Jaccard similarity calculations for the two rules.
Consider the two rules Rx and Ry such that,
with corresponding weights derived in Section 2.2 that are given in Table 3.

Based on Jaccard similarity we have,
Hence,
Next, consider two more rules, which have entirely different sets of genes from (1) and (2)
with corresponding weights derived in Section 2.2 that are given in Table 4.

Based on Jaccard similarity, we have
and
Hence Simj (Rx, Ry) =0.2.
The above examples show that Jaccard similarity measure does not apply any heuristics between two sets of rules if they have the same cardinality-based on the genes present on the either side of the rules but entirely different sets of genes present in them.
Example 2: Elucidation of Cosine similarity calculations for the two rules.
Consider the two rules Rx(4) Ry(5) as in Example 1,
Based on cosine similarity we have,
Similarly, considering the two rules Rx(6) and Ry(7), as in Example 1, we have,
Simc (Rx, Ry) =1.
This equation shows that the cosine measure will yield a value of 0 or 1 based on the set of common genes present at different sides of the two rules or on the same side.
Let
Definition 1: Weighted Jaccard Similarity Measure.
The weighted Jaccard similarity between the two association rule profiles Px and Py is defined as,
where ci, cj is the number of common set of genes on the LHS or RHS of the rules.
Example 3: Elucidation of weighted Jaccard similarity calculations for the two rules.
Consider the two rule pairs Rx(4), Ry(5) with corresponding RLi and RRj in Table 3.
Therefore, Simwj(Rx, Ry) =1.58.
Now, consider Rx(6), Ry(7) as in Example 1, with corresponding
Therefore,
This example shows that unlike Jaccard similarity measure, our proposed weighted Jaccard similarity measure gives a different measure for rules which have entirely different sets of genes present in them. Thus, providing a more efficient way to cluster them.
Definition 2: Weighted Cosine Similarity Measure.
The weighted cosine similarity between the two association rule profiles Px and Py is defined as,
Example 4: Elucidation of Weighted Cosine Similarity Calculations for the Two Rules.
Consider the two rule pairs Rx(4), Ry(5) 3 with corresponding
Therefore,
Now consider, Rx(6) Ry(7) as in Example 1 with corresponding
Therefore,
This example shows that unlike the cosine measure which gives a binary value for the similarity, our proposed weighted cosine measure relaxes the criteria and produces a continuous measure which is then utilized for clustering similar rules.
3. RESULTS
We perform several experiments with the top 100-400 ranked genes to evaluate the efficacy of the selected features by using our novel association rule based weighting scheme along with the weighted Jaccard and cosine similarity measures to group the rules. The gene ranking algorithm is run using the Queen Bee LONI supercomputer, and all the other experiments are carried out on 3.2GHz Intel® Pentium® 4 processor with 1GB RAM.
3.1. Feature Selection and Weighted Scoring Using Association Rule Mining
In this experiment, three feature selection methods, TR, GI, and MM are used to rank the genes. The top 100, 200, and 400 ranked genes are selected for further analysis. ARD is performed on the 12 sub-datasets of top ranked genes for ALL, MLL, and SRBCT datasets separately to find frequently occurring sets of genes. The support and confidence measures are set to 60% and 90%, respectively, for all sub-datasets in order to generate rules. Our experiment shows that a number of rules have common LHS but different RHS. We limit our selection to those rules that have unique genes present on the LHS of the rule to identify a set of non-overlapping genes. Hence, a smaller number of genes qualify for the set support and confidence threshold in all sub-datasets. We further apply the concept of SAR to eliminate the redundant rules. The scoring method as described in Section 2.3 is used to obtain the weights for each gene in all sub-datasets. The weights are then normalized to the range [0, 1]. An example showing the weights obtained for the GI measure for the top 100 genes is shown in Table 2. Similarly, this scoring method is performed for the all sets of top ranked genes obtained using the feature selection methods.
3.2. Clustering Rules Based on the Weighted Jaccard and the Vector Cosine Measure
We computed the clusters of association rules by employing both the weighted Jaccard and weighted cosine measure. Hierarchical clustering (average-linkage) is used to cluster the rules. Therefore, the algorithm starts with the single rule as an individual group and, at each stage, it merges the most similar pair of rule groups. The process completes when only one group is left containing all of the association rules. Our algorithm can handle the single-, complete-, and average-linkage, i.e. taking the maximum, minimum, or average similarity of all pair-wise similarities between two groups of rules. Each cluster has a group of genes obtained by the weighted Jaccard and cosine similarity measures. Fig. (2 ) shows the two proposed measures in all the three datasets for the top 100-400 genes perform very similarly in obtaining gene clusters. In the clusters generated, a significant number of genes are common by both measures. In Fig. (2), the genes obtained from both the measures are plotted against their weights.
 |
Fig. (2) Clusters of genes obtained by the weighted Jaccard and Cosine coefficients. |
3.3. Performing Biomedical Literature Search to Validate the Results
After obtaining the relevant set of genes, the web based biomedical literature DAVID: Database for Annotation, Visualization, and Integrated Discovery [40Dennis G, Sherman B, Hosack D, et al. DAVID: Database for annotation, visualization, and integrated discovery Genome Biol 2003; 4(9) Available from: ttp://genomebiology.com/2003/4/9/R60 ] is utilized to study the functional annotation of the discovered genes. DAVID has “over 40 annotation categories, including GO terms, protein-protein interactions, protein functional domains, disease associations, bio-pathways, sequence general features, expressions, literatures, etc.” [41DAVID Bioinformatics Resources [homepage on the Internet]. http://david.abcc.ncifcrf.gov/ 2008.]. The advantage of web-based biomedical search is that it provides authentic information about the selected genes being studied without involving the human expertise for verification. Tables 5-7 list the unique genes obtained after feature selection and clustering. Table 8 shows the genes participating in the pathway. The clusters obtained for each of the top 100, 200, and 400 genes in a dataset had a number of overlapping genes. The column “Featured Genes” report the genes obtained by our approach that were also obtained from the top 96 ranked genes identified based on artificial neural networks by [35Khan J, Wei1 JS, Ringnér M, et al. Classification and diagnostic prediction of cancers using gene expression profiling and artificial neural networks Nat Med 2001; 7: 673-9.].


Three of these genes (FGFR4, IGF2, and MYL4) are reported to be highly expressed in rhabdomyosarcoma (RMS). In the SRBCT dataset, IGF2 has been reported to be indispensable for the formation of medulloblastoma and RMS [45Wang L, Chu F, Xie W. Accurate Cancer Classification Using Expressions of Very Few Genes IEEE/ACM Trans Comput Biol Bioinformatics 2007; 4(1): 40-53.]. PTPN13 was identified by [44Baer C, Nees M, Breit S, et al. Profiling and functional annotation of MRNA gene expression in pediatric rhabdomyosarcoma and Ewing's sarcoma Int J Cancer 2004; 110(5): 687-94.] as a natural target gene for the EWS-FLI1 fusion protein.
In [35Khan J, Wei1 JS, Ringnér M, et al. Classification and diagnostic prediction of cancers using gene expression profiling and artificial neural networks Nat Med 2001; 7: 673-9.], two-dimensional hierarchical clustering is performed using Pearson correlation coefficient and an unweighted pair group method using arithmetic averages. The genes reported in [35Khan J, Wei1 JS, Ringnér M, et al. Classification and diagnostic prediction of cancers using gene expression profiling and artificial neural networks Nat Med 2001; 7: 673-9.] and identified by our approach are shown in Table 5. A flow cytometry analysis is performed using monoclonal antibodies specific for a number of antigens including CD2 to determine lineage derivation [46Chiaretti S, Li X, Gentleman R, et al. Gene expression profiles of b-lineage adult acute lymphocytic leukemia reveal genetic patterns that identify lineage derivation and distinct mechanisms of transformation Clin Cancer Res 2005; 11(20): 7209-19.]. In the comparative expression of kinase, genes in pre–B-lineage acute lymphocytic leukemia, comparison of NEG, and E2A/PBX1 identify nine kinases; the tyrosine kinase gene (LCK) is more highly expressed in the E2A/PBX1 samples [46Chiaretti S, Li X, Gentleman R, et al. Gene expression profiles of b-lineage adult acute lymphocytic leukemia reveal genetic patterns that identify lineage derivation and distinct mechanisms of transformation Clin Cancer Res 2005; 11(20): 7209-19.].
Three of the genes (CCL2, CXCL2, and CFD) identified by our approach are reported by [47Bloushtain-Qimron N, Yao J, Snyder EL, et al. Cell type-specific DNA methylation patterns in the human breast Proc Natl Acad Sci USA 2008; 105(37): 14076-81.]. They are involved in the following GO processes: cell surface receptor linked signal transduction, response to wounding, chemotaxis, response to stress, inflammatory response, immune response, and extracellular region. A few genes reported by [9Jiang D, Tang C, Zhang A. Cluster analysis for gene expression data: A survey IEEE Tran Knowl Data Eng 2004; 16(11): 1370-86.] showed the highest differential expression within the first 24 hours of cocultivation, which included CXCL2, which acts like a cytokine. TNFAIP6 also identified by [11Creighton C, Hanash S. Mining gene expression databases for association rules Bioinformatics 2003; 19: 79-86.] was involved in intracellular signaling (integral to plasma membrane, receptor activity, signal transducer activity, cell surface receptor-linked signal transduction, cell motility, G-protein-coupled receptor protein signaling pathway, cell–cell signaling, development, and organogenesis, morphogenesis and extracellular region). TCFL5 is one of the nine selected genes reported by [48Gandemer V, Rio A-G, de Tayrac M, et al. Five distinct biological processes and 14 differentially expressed genes characterize TEL/AML1-positive leukemia BMC Genomics 2007; 8: 385.] as being the most biologically relevant and being able to independently differentiate between TEL/AML1 positive and TEL/AML1 negative patients. The lymphoid specific gene, MME that is highly expressed in ALL samples and under expressed in MLL samples has a function in early B-cell development [34Armstrong SA, Staunton JE, Silverman LB, et al. MLL translocations specify a distinct gene expression profile that distinguishes a unique leukemia Nat Genet 2002; 30: 41-7.].
Annotations from the GENECODIS [49Nogales-Cadenas R, Carmona-Saez P, Vazquez M, et al. GeneCodis: interpreting gene lists through enrichment analysis and integration of diverse biological information Nucleic Acids Res 2009; 37: 317-22., 50Carmona-Saez P, Chagoyen M, Tirado F, Carazo JM, Pascual-Montano A. GENECODIS: A web-based tool for finding significant concurrent annotations in gene lists Genome Biol 2007; 8: R3.] software are used to associate the genes with known the Kyoto Encyclopedia of Genes and Genomes (KEGG [51Kanehisa M, Goto S, Hattori M, et al. From genomics to chemical genomics: new developments in KEGG Nucleic Acids Res 2006; 34: 354-7.]) pathways. Table 7 shows the genes listed in the identified pathway for the ALL dataset and their description. Table 8 shows the three statistical measures and top 100-400 genes identified in the pathways.
4. CONCLUSIONS
This paper introduces a novel approach based on ARD for feature extraction and grouping of rules based on weighted similarity measures. The Jaccard and cosine similarity measures have limitations in clustering of similar rules and will not be effective if applied as is. Experiments conducted on the multiclass cancer datasets along with the biomedical literature datasets show the effectiveness of our technique. We expect that this method can be effectively extended to the large data sets produced in modern microarray experiments. Due to the efficiency and scalability of our proposed technique, it is well suited to the domains of medical image analysis for feature extraction and clustering of similar feature based rules.
ACKNOWLEDGEMENTS
This research project was made possible by National Institutes of Health Grant Number P20 RR16456 from the INBRE Program of the National Center for Research resources and the supercomputing resources provided by the Louisiana Optical Network Initiative. This results presented in this paper do not necessarily represent the official views of the National Institutes of Health or the Louisiana Optical Network Initiative.
REFERENCES
| [1] | Beer DG, Sharon LRK, Huang C-C, Giordano TJ, Levin AM, Misek DE. Gene-expression profiles predict survival of patients with lung adenocarcinoma Nat Med 2002; 8: 816-24. |
| [2] | Cho R, Campbell M, Winzeler E, et al. A genome-wide transcriptional analysis of the mitotic cell cycle Mol cell 1998; 2(1): 65-73. |
| [3] | Piatetsky-Shapiro G, Tamayo P. Microarray Data Mining: Facing the Challenges ACM SIGKDD Explorations Newsletter 5 2003; 2 |
| [4] | Ben-Dor A, Yakhini Z. Clustering Gene Expression Patterns J Comput Biol 1999; 6: 281-97. |
| [5] | Shamir R, Sharan R. Algorithmic approaches to clustering gene expression data Curr Top Comput Biol 2002; 269-300. |
| [6] | Tavazoie S, Hughes JD, Campbell MJ, Cho RJ, Church GM. Systematic determination of genetic network architecture Nat Genet 1999; 22: 281-5. |
| [7] | Eisen MB, Spellman PT, Brown PO, Botstein D. Cluster analysis and display of genome-wide expression patterns Proc Natl Acad Sci USA 1998; 95: 14863-8. |
| [8] | Tamayo P, Slonim D, Mesirov J, et al. Interpreting patterns of gene expression with self-organizing maps: methods and application to hematopoetic differentiation Proc Natl Acad Sci USA 1999; 96: 2907-12. |
| [9] | Jiang D, Tang C, Zhang A. Cluster analysis for gene expression data: A survey IEEE Tran Knowl Data Eng 2004; 16(11): 1370-86. |
| [10] | Becquet C, Blachon S, Jeudy B, Boulicaut JF, Gandrillon O. Strong- association-rule mining for large-scale gene-expression data analysis: a case study on human SAGE data Genome Biol 2002; 3: 1-16. |
| [11] | Creighton C, Hanash S. Mining gene expression databases for association rules Bioinformatics 2003; 19: 79-86. |
| [12] | Kotala P, Perera A, Zhou JK, Mudivarthy S, Perrizo W, Deckard E. Gene expression profiling of DNA microarray data using peano count tree (p-trees). In: Proceedings of the First Virtual Conference on Genomics and Bioinformatics; 2001 Oct 15; North Dakota State University, USA. 2001; pp. 15-6. |
| [13] | Tuzhilin A, Adomavicius G. Handling very large numbers of association rules in the analysis of microarray data. In: Proceedings of the Eighth ACM SIGKDD International Conference on Data Mining and Knowledge Discovery; Edmonton, Canada. 2002; pp. 396-404. |
| [14] | Georgii E, Richter L, Ruckert U, Kramer S. Analyzing microarray data using quantitative association rules Bioinformatics 2005; 21(Suppl 2): ii123-9. |
| [15] | Carmona-Saez P, Chagoyen M, Rodr´iguez A, Trelles O, Carazo J, Pascual- Montano A. Integrated analysis of gene expression by association rules discovery BMC Bioinformatics 2006; 7(1): 54-69. |
| [16] | Ali K, Manganaris S, Srikant R. Partial classification using association rules. In: Proceedings of the 3rd International Conference on Discovery and Data Mining (KDD); New York USA. 2007; p. 115. |
| [17] | Liu B, Hsu W, Ma Y. Pruning and summarizing the discovered associations. In: Proceedings of the 5th International Conference on Knowledge Discovery and Data Mining; 1999; pp. 125-34. |
| [18] | Mannila H, Toivonen H, Verkamo I. Efficient algorithms for discovering association rules In: AAAI Wkshp Knowledge Discovery in Databases. Menlo Park, CA: AAAI Press 1997; pp. 181-92. |
| [19] | Han J, Kamber M. Data mining: Concepts and Techniques. 2nd ed. Morgan Kaufmann 2001. |
| [20] | Toivonen H, Klemettinen M, Ronkainen P, Hatonen K, Mannila H. Pruning and grouping discovered association rules. In: ECML-95 Workshop on Statistics, Machine Learning and Knowledge Discovery in Databases; 1995; pp. 47-52. |
| [21] | Liu B, Hsu W, Ma Y. Integrating classification and association rule mining. Proceedings of the Fourth International Conference on Knowledge Discovery and Data Mining (KDD); 1998; p. 27. |
| [22] | Srikant R, Vu Q, Agrawal R. Mining association rules with item constraints. In:Proceedings of the 3rd International Conference on Knowledge Discovery and Data Mining; 1997; pp. 67-73. |
| [23] | Ng R, Lakshmanan L, Han J, Pang A. Exploratory mining and pruning optimizations of constrained association rules In: In:Proceedings of 1998 ACM-SIGMOD International Conference on Management of Data; 1998; pp. 13-24. |
| [24] | Liu L, Chen Y, Shan S, Yin L. Mining Condensed and Lossless Association Rules by Pruning Redundancy. 2 Fifth International Conference on Fuzzy Systems and Knowledge Discovery; 2008; pp. : 591-. |
| [25] | Lent B, Swami A, Widom J. Clustering Association Rules. In: Proceedings of the 13th International Conference on Data Engineering; 1997; pp. 220-31. |
| [26] | Berrado A, Runger G. Clustering massive categorical data with class association rules. International Conference on Innovations in Information Technology; 2008; pp. 223-7. |
| [27] | Zaki MJ, Parthasarathy S, Ogihara M, Li W. New Algorithms for Fast Discovery of Association Rules. In: International Conference on Knowledge Discovery and Data Mining; 1997; pp. 283-6. |
| [28] | Quan TT, Ngo LN, Hui SC. An Effective Clustering-based Approach for Conceptual Association Rules Mining. In:International Conference on Computing and Communication Technologies; 2009; pp. 1-7. |
| [29] | Breiman L. Classification and Regression Trees. CRC Press 1984. |
| [30] | Murthy SK, Kasif S, Salzberg S. A system for induction of oblique decision trees J Artif Intell Res 1994; 2: 1-33. |
| [31] | Tan PN, Steinbach M, Kumar V. Introduction to data mining. Addison-Wesley 2005. |
| [32] | Fowlkes EB, Mallows CJ. A method for comparing two hierarchical clusterings J Am Stat Assoc 1983; 78(383): 553-84. |
| [33] | Yeoh E-J, Ross ME, Shurtleff SA, et al. Classification, subtype discovery, and prediction of outcome in pediatric lymphoblastic leukemia by gene expression profiling Cancer Cell 2002; 1(2): 133-43. |
| [34] | Armstrong SA, Staunton JE, Silverman LB, et al. MLL translocations specify a distinct gene expression profile that distinguishes a unique leukemia Nat Genet 2002; 30: 41-7. |
| [35] | Khan J, Wei1 JS, Ringnér M, et al. Classification and diagnostic prediction of cancers using gene expression profiling and artificial neural networks Nat Med 2001; 7: 673-9. |
| [36] | Su Y, Murali TM, Pavlovic V, Kasif S. RankGene: identi?cation of diagnostic genes based on expression data Bioinformatics 2003; 1578-9. |
| [37] | Hanczar B, Courtine M, Benis A, Hennegar C, Clement K, Zucker J-D. Improving classi?cation of microarray data using prototype-based feature selection SIGKDD Explor Newslett 2003; 5: 23-30. |
| [38] | Agrawal R, Imielinski T, Swami A. Mining association rules between sets of items in large databases. Proceedings of the 1993 International Conference on Management of Data SIGMOD Conference; 1993; pp. 207-16. |
| [39] | Sethi P, Alex AE, Alagiriswamy S. Feature Ranking and Scoring of Gene Expression Data Using Associative Pattern Mining. 4th IPAR Conference on Pattern Recognition in Bioinformatics; 2009; p. 10. |
| [40] | Dennis G, Sherman B, Hosack D, et al. DAVID: Database for annotation, visualization, and integrated discovery Genome Biol 2003; 4(9) Available from: ttp://genomebiology.com/2003/4/9/R60 |
| [41] | DAVID Bioinformatics Resources [homepage on the Internet]. http://david.abcc.ncifcrf.gov/ 2008. |
| [42] | Xuan J, Wang Y, Dong Y, et al. Gene Selection for Multiclass Prediction by Weighted Fisher Criterion EURASIP J Bioinformatics Syst Biol 2007; 64628. |
| [43] | El-Badry OM, Minniti C, Kohn EC, Houghton PJ, Daughaday WH, Helman LJ. Insulin-like growth factor II acts as an autocrine growth and motility factor in human rhabdomyosarcoma tumors Cell Growth Differ 1990; 1(7): 325-1. |
| [44] | Baer C, Nees M, Breit S, et al. Profiling and functional annotation of MRNA gene expression in pediatric rhabdomyosarcoma and Ewing's sarcoma Int J Cancer 2004; 110(5): 687-94. |
| [45] | Wang L, Chu F, Xie W. Accurate Cancer Classification Using Expressions of Very Few Genes IEEE/ACM Trans Comput Biol Bioinformatics 2007; 4(1): 40-53. |
| [46] | Chiaretti S, Li X, Gentleman R, et al. Gene expression profiles of b-lineage adult acute lymphocytic leukemia reveal genetic patterns that identify lineage derivation and distinct mechanisms of transformation Clin Cancer Res 2005; 11(20): 7209-19. |
| [47] | Bloushtain-Qimron N, Yao J, Snyder EL, et al. Cell type-specific DNA methylation patterns in the human breast Proc Natl Acad Sci USA 2008; 105(37): 14076-81. |
| [48] | Gandemer V, Rio A-G, de Tayrac M, et al. Five distinct biological processes and 14 differentially expressed genes characterize TEL/AML1-positive leukemia BMC Genomics 2007; 8: 385. |
| [49] | Nogales-Cadenas R, Carmona-Saez P, Vazquez M, et al. GeneCodis: interpreting gene lists through enrichment analysis and integration of diverse biological information Nucleic Acids Res 2009; 37: 317-22. |
| [50] | Carmona-Saez P, Chagoyen M, Tirado F, Carazo JM, Pascual-Montano A. GENECODIS: A web-based tool for finding significant concurrent annotations in gene lists Genome Biol 2007; 8: R3. |
| [51] | Kanehisa M, Goto S, Hattori M, et al. From genomics to chemical genomics: new developments in KEGG Nucleic Acids Res 2006; 34: 354-7. |
| [52] | Yeoh EJ, Ross ME, Shurtleff SA, et al. Classification, subtype discovery, and prediction of outcome in pediatric lymphoblastic leukemia by gene expression profiling Cancer Cell [Suppl Data] 2002; 1(2): 133-43. |
| [53] | Wagner W, Saffrich R, Wirkner U, et al. Hematopoietic progenitor cells and cellular microenvironment: behavioral and molecular changes upon interaction Stem Cell 2005; 23(8): 1180-91. |
| [54] | Severin J, Waterhouse AM, Kawaji H, et al. FANTOM4 EdgeExpressDB: an integrated database of promoters, genes, microRNAs, expression dynamics and regulatory interactions Genome Biol 2009; 10(4): R39. |