- Home
- About Journals
-
Information for Authors/ReviewersEditorial Policies
Publication Fee
Publication Cycle - Process Flowchart
Online Manuscript Submission and Tracking System
Publishing Ethics and Rectitude
Authorship
Author Benefits
Reviewer Guidelines
Guest Editor Guidelines
Peer Review Workflow
Quick Track Option
Copyediting Services
Bentham Open Membership
Bentham Open Advisory Board
Archiving Policies
Fabricating and Stating False Information
Post Publication Discussions and Corrections
Editorial Management
Advertise With Us
Funding Agencies
Rate List
Kudos
General FAQs
Special Fee Waivers and Discounts
- Contact
- Help
- About Us
- Search


The Open Medical Informatics Journal
(Discontinued)
ISSN: 1874-4311 ― Volume 13, 2019
Automatic Detection and Classification of Breast Tumors in Ultrasonic Images Using Texture and Morphological Features
Yanni Su, Yuanyuan Wang*, Jing Jiao, Yi Guo
Abstract
Due to severe presence of speckle noise, poor image contrast and irregular lesion shape, it is challenging to build a fully automatic detection and classification system for breast ultrasonic images. In this paper, a novel and effective computer-aided method including generation of a region of interest (ROI), segmentation and classification of breast tumor is proposed without any manual intervention. By incorporating local features of texture and position, a ROI is firstly detected using a self-organizing map neural network. Then a modified Normalized Cut approach considering the weighted neighborhood gray values is proposed to partition the ROI into clusters and get the initial boundary. In addition, a regional-fitting active contour model is used to adjust the few inaccurate initial boundaries for the final segmentation. Finally, three textures and five morphologic features are extracted from each breast tumor; whereby a highly efficient Affinity Propagation clustering is used to fulfill the malignancy and benign classification for an existing database without any training process. The proposed system is validated by 132 cases (67 benignancies and 65 malignancies) with its performance compared to traditional methods such as level set segmentation, artificial neural network classifiers, and so forth. Experiment results show that the proposed system, which needs no training procedure or manual interference, performs best in detection and classification of ultrasonic breast tumors, while having the lowest computation complexity.
Article Information
Identifiers and Pagination:
Year: 2011Volume: 5
Issue: Suppl 1
First Page: 26
Last Page: 37
Publisher Id: TOMINFOJ-5-26
DOI: 10.2174/1874431101105010026
Article History:
Received Date: 21/4/2011Revision Received Date: 15/5/2011
Acceptance Date: 15/5/2011
Electronic publication date: 27/7/2011
Collection year: 2011
open-access license: This is an open access article licensed under the terms of the Creative Commons Attribution Non-Commercial License (http://creativecommons.org/licenses/by-nc/3.0/) which permits unrestricted, non-commercial use, distribution and reproduction in any medium, provided the work is properly cited.
* Address correspondence to this author at the Department of Electronic Engineering, Fudan University, Shanghai 200433, China; Tel/Fax: +86 21 65642756; E-mail: yywang@fudan.edu.cn
| Open Peer Review Details | |||
|---|---|---|---|
| Manuscript submitted on 21-4-2011 |
Original Manuscript | Automatic Detection and Classification of Breast Tumors in Ultrasonic Images Using Texture and Morphological Features | |
1. INTRODUCTION
Breast cancer is one of the most common forms of cancer that affects women health, and the second leading cause of cancer deaths in women today [1Imaginis. Breast Cancer: Statistics on Incidence, Survival, and Screening Available from: http://Imaginis.com/breasthealth/statistics.asp 2008.]. Early diagnosis can increase ten-year survival rate by up to 90%. So far, due to the fact of being noninvasive, portable, real-time and cost effective, ultrasonography has been recommended as the preferred imaging screening method for early detection, instead of other approaches [2Cheng HD, Shan J, Ju W, Guo YH, Zhang L. Automated breast cancer detection and classification using ultrasound images: A survey Pattern Recog 2010; 43(1): 299-317.].
A computer-aided diagnosis (CAD) system, which can process images automatically, is proved to be helpful for physicians in terms of ultrasonic images understanding and decision making. Traditionally, a CAD system contains three steps: tumor segmentation, feature extraction and tumor classification. However, it is difficult to implement any of these three parts in ultrasonography, due to its low gray level contrast, severe speckle noises in ultrasound images and the irregular shapes of breast tumors [2Cheng HD, Shan J, Ju W, Guo YH, Zhang L. Automated breast cancer detection and classification using ultrasound images: A survey Pattern Recog 2010; 43(1): 299-317.].
The segmentation stage of a breast tumor is crucial in a CAD system. Many significant features are defined on the basis of tumor shape, and gray level or texture in a lesion area. Thus, the more accurate tumor boundary will result in more precise features. So far, lots of methods for boundary extraction have been published, such as: histogram thresholding [3Horsch K, Giger ML, Venta LA, Vyborny CJ. Computerized diagnosis of breast lesions on ultrasound Med Phys 2002; 29(2 ): 157-64.], active contour model (ACM) [4Madabhushi A, Metaxas DN. Combining low-, high-level and empirical domain knowledge for automated segmentation of ultrasonic breast lesions IEEE T Med Imag 2003; 22(2 ): 155-69.-7Ning JF, Wu CK, Liu SG, Yang SQ. An improved external force field for active contour model Pattern Recogn Lett 2007; 28(1 ): 58-63.], Markov random field (MRF) [8Noble JA, Boukerroui D. Ultrasound image segmentation: a survey IEEE T Med Imaging 2006; 25(8 ): 987-1010.], neural network [9Huang YL. Computer-aided diagnosis using neural networks and support vector machines for breast ultrasonography J Med Ultrasound 2009; 17(1 ): 17-24.], watershed [10Huang YL, Chen DR. Watershed segmentation for breast tumor in 2-d sonography Ultrasound Med Bio 2004; 30(5 ): 625-32.], and a hybrid algorithm gained by machine learning using the above principle [11Tsantis S, Dimitropous N, Cavouras D, Nikiforidis G. A hybrid multi-scale model for thyroid nodule boundary detection on ultrasound images Comput Meth Prog Bio 2006; 84(2-3 ): 86-98.]. However, not all of them can be used to solve the problem related to breast tumor effectively. The reasons are:
- Most of the publicized computer-aided diagnosis (CAD) systems or methods implement the tumor segmentation on the region of interest (ROI) or an initial contour, which was marked out manually by physicians from the raw image. Thus the segmentation is only of semi-automation.
- Due to the abovementioned characteristics of ultrasonography, the segmentation accuracy is challenged. Being sensitive to noises, histogram thresholding may fail to give a precise result. Model based algorithms works well in ultrasonography demarcation, with a strong noise-resistant ability. But for most of the model-based methods, including ACM, MRF, level set, manually initialized contours are required, and the curve evolution process may fail to reach the real target with an inappropriate initialization [7Ning JF, Wu CK, Liu SG, Yang SQ. An improved external force field for active contour model Pattern Recogn Lett 2007; 28(1 ): 58-63.].
- The existing segmentation methods usually perform poorly in their algorithmic efficiency. The model-based methods take longer time to calculate the energy functions and reformulate the models. As addressed in [6Liu B, Cheng HD, Huang JH, Tian JW, Liu JF, Tang XL. Automated segmentation of ultrasonic breast lesions using statistical texture classification and active contour based on probability distance Ultrasound Med Bio 2009; 35(8 ): 1309-24.], a modified deformable model avoids the shortcoming of initial human intervention, but its evolution process is time-consuming. The existing automatic segmentation in [10Huang YL, Chen DR. Watershed segmentation for breast tumor in 2-d sonography Ultrasound Med Bio 2004; 30(5 ): 625-32.] reaches an initial over-segmentation by watershed algorithm, and then uses the active contour model (ACM) to refine it. Since it takes the whole ultrasound image as an input in one go, this procedure suffers a setback of being high computation cost. Moreover, it will not perform very well when shadowing artifacts exists.
To classify ultrasonic breast tumors, numbers of morphologic and texture characteristics have been recognized as the accredited criteria [12Stavros AT, Thickman D, Rapp CL, Dennis MA, Parker SH, Sisney GA. Solid breast nodules: use of sonography to distinguish between benign and malignant lesions Radiology 1995; 196(1 ): 123-34.-14Chen DR, Chang RF, Chen CJ, et al. Classification of breast ultrasound images using fractal feature J Clin Imag 2005; 29(4 ): 235-45.]. These features describe the differences among gray level values, grayscale distribution properties [12Stavros AT, Thickman D, Rapp CL, Dennis MA, Parker SH, Sisney GA. Solid breast nodules: use of sonography to distinguish between benign and malignant lesions Radiology 1995; 196(1 ): 123-34.], fractal dimensions [14Chen DR, Chang RF, Chen CJ, et al. Classification of breast ultrasound images using fractal feature J Clin Imag 2005; 29(4 ): 235-45.], as well as the edge-sharpness [13Garra BS, Krasner BH, Horii SC, Ascher S, Mun SK, Zeman RK. Improving the distinction between benign and malignant breast-lesions—the value of sonographic texture analysis Ultrasonic Imag 1993; 15(4 ): 267-85.], which can be comprehensively considered to make the differentiation.
Due to the considerable overlap in ultrasonic features between benign and malignant tumors, computer-based classification methods are developed to increase the classification accuracy and stability [15Mu TT, Nandi AK, Rangayyan RM. Classification of breast masses using selected shape, edge-sharpness, and texture features with linear and kernel-based classifiers J Digit Imag 2008; 21(2 ): 153-69.-17Langley P, Sage S. Induction of selective Bayesian classifiers In: Proceedings of the 10th Conference on Uncertainty in Artificial Intelligence, Seattle; Aug 15, 1994; WA, USA. 1994.]. Up to present, popular approaches mainly include: back propagation artificial neural network (BPANN), Fisher linear discriminant (FLD), support vector machine (SVM) [15Mu TT, Nandi AK, Rangayyan RM. Classification of breast masses using selected shape, edge-sharpness, and texture features with linear and kernel-based classifiers J Digit Imag 2008; 21(2 ): 153-69.], self-organizing map (SOM) [16Chen DR, Chang RF, Huang YL. Breast cancer diagnosis using self-organizing map for sonography Ultrasound Med Bio 2000; 26(3 ): 405-11.], Bayes classification [17Langley P, Sage S. Induction of selective Bayesian classifiers In: Proceedings of the 10th Conference on Uncertainty in Artificial Intelligence, Seattle; Aug 15, 1994; WA, USA. 1994.], etc. However, most of them require training processing that is time-consuming and needs supervision from experienced physicians. Thus, developing an unsupervised classifier may surmount these obstacles, by dealing with an existing database without any training. In addition, for supervised methods, since individual classifiers sometimes fail to provide a stable high accuracy, ensemble classifiers are introduced to overcome this difficulty [18Dietterich T. Machine learning research: four current directions AI Mag 1997; 18(4 ): 97-136.]. Nevertheless, the classification accuracy and efficiency of some ensemble classifiers remain not quite desirable, due to the limitations of individual classifiers and the selective ensemble learning algorithms themselves [19Zhou Z, Wu J, Tang W. Ensembling neural networks: many could be better than all Artif Intel 2002; 137(1-2 ): 239-63.]. Therefore, it is meaningful to find a stable classifier with a great capacity of generalization.
In this paper, we develop a fully automatic, effective and time-saving system for breast tumor detection, segmentation and classification. With the ROI generated by classifying image pixels based on texture and location characteristics, a modified Normalized Cut (Ncut) algorithm is used to segment tumors with higher system automation. By employing morphological and texture features, an unsupervised clustering [20Brendan JF, Delbert D. Clustering by passing messanges between data points Science 2007; 315(5814 ): 972-7.] is used to differentiate the malignant tumors from the benign ones with the higher system accuracy and efficiency.
2. METHODS
The proposed method is composed of three steps which are all executed automatically: (1) ROI generation carried out by the texture classification of pixels; (2) breast tumor segmentation using a modified Normalized Cut algorithm; (3) benign and malignant classification using an Affinity Propagation clustering, based on the texture and morphological features of tumors. The flowchart is shown in Fig. (1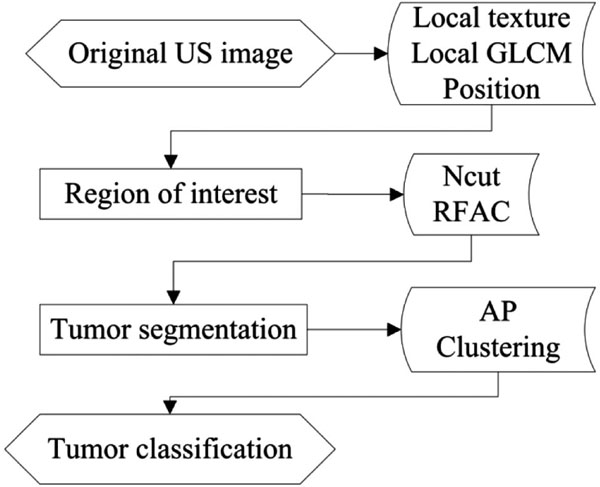 ).
).
 |
Fig. (1) The Flowchart of the proposed method. |
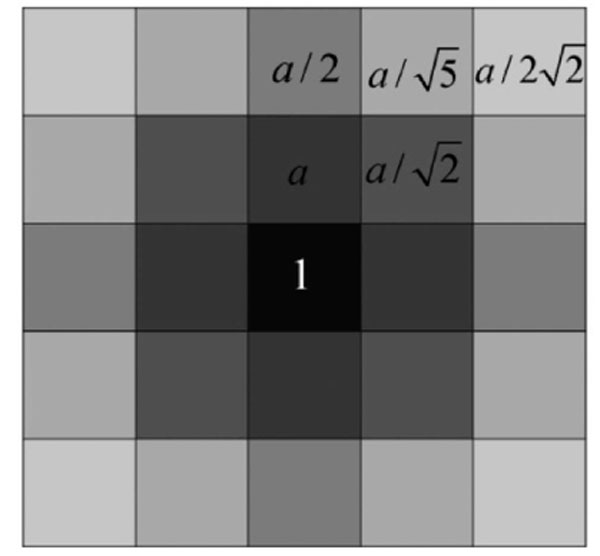 |
Fig. (3) The mask considering the weighted neighborhood gray values. |
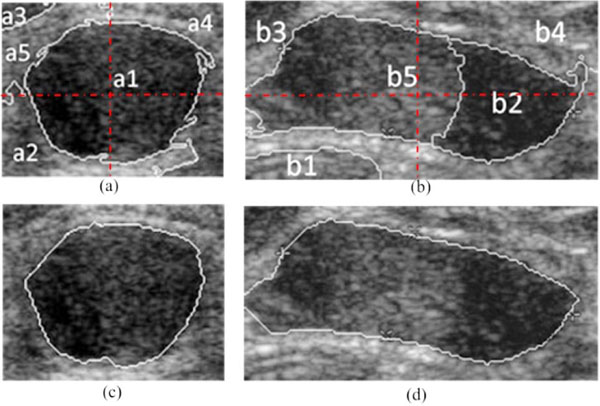 |
Fig. (4) Automatic boundary extraction using Ncut, (a), (b) the NC = 5 clusters; (c), (d) the boundary of tumor extracted by the modified Ncut. |
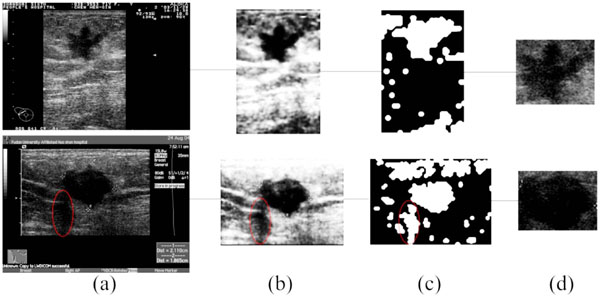 |
Fig. (5) The result of ROI generation, (a) the original images; (b) the preprocessing of (a); (c) the result of SOM classification; (d) the detected ROI. |
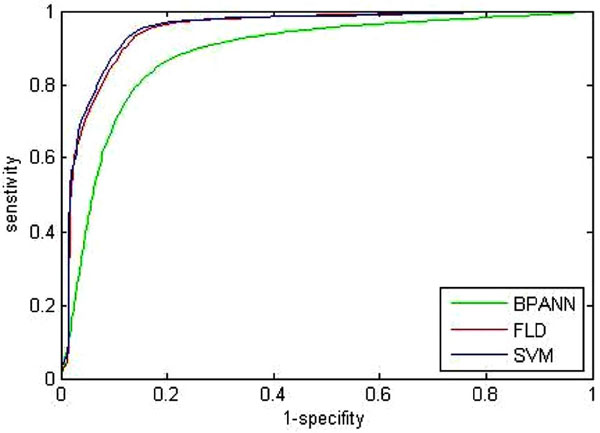 |
Fig. (7) ROC curve of three traditional classification methods. |
2.1. ROI Generation
In this section, a novel and fast method of ROI generation is proposed [21Su YN, Wang YY. Automatic detection of the region of interest from brest tumor ultrasound imgaes Chinese J Biomed Eng 2010; 29(2 ): 178-84.]. The detailed image preprocessing, feature extraction, pixel classification and ROI selection are described as follows.
2.1.1. Pre-Processing
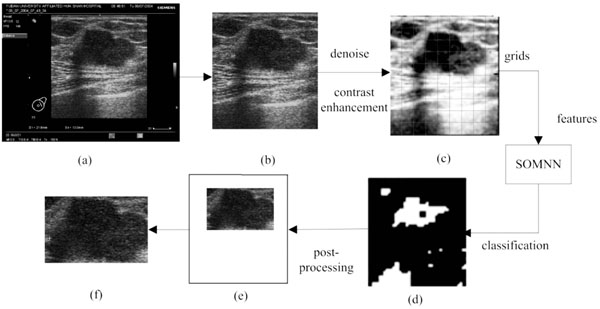
The raw images, as the output of ultrasonic instruments, always hold characters and irons in a black background around their inside borders. Since these are useless for the image processing here, a morphological mask is designed to acquire the real ultrasonic images of breast tissues, as shown in Fig. (2a , b). The stepped gray variation of the customized mask makes it possible to detect the real margins, and this pre-processing is helpful for the complete automation. Subsequently, given the condition of speckle noises and weak edges, the real ultrasonic images need to be denoised. It has been proven that the traditional denoising algorithms (such as: Gaussian low-pass filtering, Wiener filtering and so forth) may blur the boundaries at the same time in implementing noise reduction. While, the anisotropic diffusion algorithm overcomes this weakness by introducing an edge detection operator to achieve different blur effects in areas nearby and far away from the edge area respectively. Furthermore, according to the characteristics of ultrasonic images, the speckling reducing anisotropic diffusion (SRAD) algorithm [22Yu YJ, Acton ST. Speckle reducing anisotropic diffusion IEEE T Image Process 2002; 11(11
): 1260-70.] meliorates the edge detection by integrating the performance of gradient operator and Laplace operator, in which way the grey variation caused by the speckle noise could be exclude from the detected edges. Thus, the real ultrasonic images are treated by the SRAD, to reduce speckle noises, meanwhile to preserve and even enhance the edge of tumors, as shown in Fig. (2c).
, b). The stepped gray variation of the customized mask makes it possible to detect the real margins, and this pre-processing is helpful for the complete automation. Subsequently, given the condition of speckle noises and weak edges, the real ultrasonic images need to be denoised. It has been proven that the traditional denoising algorithms (such as: Gaussian low-pass filtering, Wiener filtering and so forth) may blur the boundaries at the same time in implementing noise reduction. While, the anisotropic diffusion algorithm overcomes this weakness by introducing an edge detection operator to achieve different blur effects in areas nearby and far away from the edge area respectively. Furthermore, according to the characteristics of ultrasonic images, the speckling reducing anisotropic diffusion (SRAD) algorithm [22Yu YJ, Acton ST. Speckle reducing anisotropic diffusion IEEE T Image Process 2002; 11(11
): 1260-70.] meliorates the edge detection by integrating the performance of gradient operator and Laplace operator, in which way the grey variation caused by the speckle noise could be exclude from the detected edges. Thus, the real ultrasonic images are treated by the SRAD, to reduce speckle noises, meanwhile to preserve and even enhance the edge of tumors, as shown in Fig. (2c).
2.1.2. Feature Detection
In this section, the image obtained by the above pre-processing is divided into non-overlapping grids, as shown in Fig. (2c). Here the size of each grid is lgrid×lgrid, and the selection of grid size lgrid will be discussed in the following experiments in detail. Then the local texture, local gray level co-occurrence matrix and position features are extracted to describe each grid.
Local texture features [23Gonzalez RC, Woods RE, Eddins SL. Digital Image Processing Using MATLAB, Pearson Prentice Hall, Upper Saddle River, NJ 2004.] include six measures, which have been formulated as quantitative shape descriptions of the first-order histogram of each grid.
- Average gray level m, which describes the difference in gray between the ROI and non-ROI, is defined by:
where z, with a range of {z0, z1, …, zL-1}, is the gray level variable of the L-grayscale image, and {p(zi), i=0,1,∙∙∙,L-1} is the corresponding proportion. - Standard deviation σ, which characterizes the texture roughness, is expressed as:
- Normalized smoothness R, which characterizes the texture smoothness, can be calculated by:
- Third moment μ3, which describes the histogram skewness, is defined as:
- Uniformity U, which reflects the uniformity degree of the gray distribution, can be written as:
The quantity U depends on the local distribution of the image intensities. Its value reaches the maximum when the local image intensity distribution is uniform. - Entropy Eg, a randomness metric which can measure the image’s information content, is defined by:
When the image gray distribution has the biggest randomness, Eg reaches its maximum.
The Gray Level Co-occurrence Matrix (GLCM) features reflect the comprehensive information of image gray on different directions, adjacent intervals and variations. Thus these can be used to analyze the image primitive and its structure. To measure the local GLCM features, the image after the pre-processing is written as f(x, y), with a size of M×N and a grayscale of Ng. The local GLCM of each sub-block is indicated by P, which is an Ng×Ng matrix. Then P(g1, g1 ), the element at row g1 and column g2 of P, which meets a certain space relation, can be expressed by:
where g1, g2 are the gray level values of the current pixel pair, #{∙} is the number of elements in this set. The normalized local GLCM elements
- Contrast Cn, which presents to be higher when there are more pixel pairs with high gray level difference, is defined as:
- Correlation Cr, a measure of the similarity degree of GLCM elements along the vertical or horizontal direction, is written as:
where
- Energy Et, namely the quadratic sum of the GLCM elements, which reflects the uniformity of the image’s gray and texture distribution, is expressed as:
The image with coarser texture holds a higher Et.
By dividing the ultrasonic image into grids, each sub-block corresponds to a coordinate value (xb, yb). In human’s visual system, the neighborhood property may influence the judgment, which comes from the similarity measured by other features. In this way, two sub-blocks, which are far away from each other, still hold a low possibility belonging to the same class, even if their other characteristics are quite similar. Meanwhile, it is indicated that sub-blocks locating in the center of the image is more likely to be part of the ROI. Here, the introduced position features (xb, yb) are multiplied by the weight wpos to limit its impact. Considering that the position information is only used to support the distinction of objects with a large distance between them, the value of wpos generally ranges between 0.01 and 0.1. Here it is empirically selected as 0.05.
Due to the correlation between the above 11 features, an effective feature subset needs to be selected to avoid dimension disasters. In this study, the breast tumor ROI and non-ROI background marked by the physician are taken as the training set. The feature selection tools such as the classic Principle Component Analysis (PCA) and the Sequential Floating Forward Selection (SFFS) are used to obtain the optimal feature vector and minimize the system time. Finally the achieved optimal features are: five basic local texture features (average gray, standard deviation, smoothness, third moment and uniformity), two local GLCM features (contrast and energy), and two position characteristics.
2.1.3. Pixel Classification
The feature vector of a grid, which consists of nine features, is normalized to [0, 1], and the position features are scaled by the weighting coefficient wpos. Then, taking the nine dimensional vector of each grid as the input of the classifier, the ROI and non-ROI background in ultrasonic breast tumor images can be distinguished.
In this section, the self-organizing feature map neural network (SOMNN) [25Kohonen T. Self-organizing maps. New York, NY: Springer-Verlag 1997.], proposed by Kohonen according to characteristics of the nervous system, is used for the classification of these grids to detect the ROI automatically. The SOM is trained by the unsupervised learning to produce a low-dimensional discretized representation of the input space of the training samples, and it uses a neighborhood function to preserve the topological properties of the input space, which makes it different from other artificial neural networks.
In this way, the SOM is able to classify the sub-blocks into n clusters only by the unsupervised learning. In our study, the output layer number n is set to 2 (ROI and non-ROI output) and the feature vector extracted from each grid is taken as the input. To map the sorted sub-blocks back to the size of the original ultrasonic images, the initial result of ROI detection can be represented by a binary image as shown in Fig. (2d), where white areas indicate the ROI candidates while black areas the non-ROIs.
2.1.4. ROI Selection
Due the influence of the speckle noise, there will exist some isolated points in the binary image after pixel classification. Here, a morphological opening is used to remove isolated dots, burrs and tiny bridges, and a morphological closing is used to fill holes and small cracks, while keeping the general position and shape unchanged.
Since the hypoechoic areas also comprise the subcutaneous fat and muscle region, which scatter around the upper and lower bound of the image, the following rules are designed to remove their undesirable impact and detect the real ROI, according to the general size and position of a real ROI in an ultrasonic image. Firstly, the largest connected region is found out as B1 and the second largest connected region B2. Then,
- if B1 does not reach the image bound, take B1 as ROI, else continue;
- if B2 reaches the image bound, take B1 as ROI, else continue;
- if the area of B2<1/25 of the original image, take B1 as ROI, else take B2.
Furthermore, the pre-processing using the SRAD and the adjustable sub-block size lgrid instead of a constant value in [6Liu B, Cheng HD, Huang JH, Tian JW, Liu JF, Tang XL. Automated segmentation of ultrasonic breast lesions using statistical texture classification and active contour based on probability distance Ultrasound Med Bio 2009; 35(8 ): 1309-24.], are proven to be beneficial to remove the adjacent shadowing artifacts which share similar features as the real ROI does to some extent.
After the grids selection, an irregularly shaped white area Rcand is identified as the candidate ROI. The enclosing rectangle of Rcand is found, and its border is then expanded outwards by lgrid×4 pixels (if it exceeds the bound of the original image, take the bound of image as the final result) to gain the final rectangular ROI used for the subsequent segmentation. The magnification coefficient 4 is obtained by the experiments as described later.
As mentioned above, the implementation flow of the automatic ROI generation is shown in Fig. (2), and Fig. (2e, f) is the final detected ROI.
2.2. Segmentation of Breast Tumors
In this section, a modified Normalized Cut (Ncut) method is proposed with the weighted gray values of neighborhood pixels, which succeeds in the automatic segment of the breast tumor in ultrasonic images. The proposed method partitions the original ultrasound image into clusters with Ncut, and further receives the initial contour of the tumor by employing the different gray values and spatial distributions of each cluster. For a small proportion of inaccurate segmentation (e.g. grayscale leakage), a modified active contour model is used to adjust the initial boundary to obtain the final result. Compared with the traditional edge detection methods, it can realize boundary extraction of tumors efficiently and automatically.
2.2.1. Automatic Segmentation Using the Modified Ncut
The basic principle of clustering is to minimize the similarity among different clusters whereas to maximize the similarity inside each cluster itself. In this study, the graph theory-based clustering algorithm is applied for image segmentation. Firstly, the ROI generated above is processed by the SRAD [22Yu YJ, Acton ST. Speckle reducing anisotropic diffusion IEEE T Image Process 2002; 11(11 ): 1260-70.], whilst the resultant IS is taken as the object image to be segmented. Then a weighted undigraph G = (V, E) is obtained, where V is the node set (composed of all pixels in IS) and E is the similarity between different pixels.
Given an image with a size of N × N, its adjacency matrix can be noted as W ∈ N2 × N2, which is regarded as the similarity matrix as well. By dividing the image into two disjoint parts A and B (A ∪ B = V ), we can define the sum of weight between A and B as
where
The optimum solution is to minimize the value of WNcut between A and B, which is a complex NP-complete. In [27Shi JB, Malik J. Normalized cuts and image segmentation IEEE T Pattern Anal 2000; 22(8
): 888-905.], Shi and Malik defined X as a matrix of N2×NC, where NC is the number of clusters. Xl is the lth column vector of X. If a node i belongs to Cl , xi ,l which is the ith row and lth column element of X is set to 1, otherwise xi.l = 0. They also defined the connectivity of the ith node as
The constraint condition is:
Here, the constraint condition can be rewritten as
In this paper, by taking pixels in ultrasound images as nodes in the graph theory, the similarity matrix W can be calculated based on the different position and gray level of each pixel.
where LC (i) represents the position of node i, or equivalently its coordinate inside IS. F(i) describes the gray level information of node i. r is the set effective range,
In [28Qiu PH. Image processing and jump regression analysis. Hoboken NJ: John Wiley & Sons 2005.], Qiu PH demonstrates that a proper local smoothing of the observed image intensities would benefit edge detection, because neighboring image intensities often carry helpful information about the edge structure at a given pixel. Thus, a mask of 5×5 is designed here as shown in Fig. (3 ). The gray level of the image center is g (i,i), with its weight set to 1. The weights of its neighborhood pixels are also marked. The further away a node is to the image center, the smaller its weight will be, and the darker its brightness is equivalently. Then in the center of an image, F (i) can be expressed by
(15)
where a should satisfy the condition
that is a = 0.0724. By substituting the value of a into the definition of F (i), the pixel i’s gray level information considering weighted neighborhood gray level is obtained. Then by substituting the value of F (i) into Equation (14), the similarity matrix W used in NCut fully automatic segmentation can be calculated.
In ultrasonic images, due to the severe presence of speckle noise, low contrast, as well as the irregular shape and area of objects, it is hard for 2-way Ncut to segment the tumor and the background directly. So we partition the ROI image into NC (NC≧2) clusters. According to the gray information and space distribution of each cluster, the ones belong to the tumor area can be easily screen out from the background tissue. For instance, the clustering result of the modified Ncut with NC set to 5 is shown in Fig. (4a , b). Firstly, by sorting the average gray of each cluster in ascending or descending order, the kink of the gray distribution curve can be found. Then, the clusters with a higher average gray than that of the kink point (e.g. Cluster a2, a4, a5 and b1, b3, b4 in Fig. (4a, b)) are removed. Subsequently, due to the fact that tumors always locate centrally, an elongated mask across the center of the ROI image is taken to eliminate clusters which have no intersects with this mask ((e.g. Cluster a3 in Fig. (4c))). Lastly, a morphological post-processing is used to eliminate the minute crevices. In this way, the boundary CI of the checked regions IC is the result of NC-way Ncut automatic segmentation, just as shown in Fig. (4c, d).
It is proven that a quite different result of partition is obtained with a different NC parameter. So it is of great significance to choose an appropriate NC. Traditionally the Ncut algorithm is invoked recursively to over-segment the image, and then the region merging is used to get the lesions area [29Liu X, Huo ZM, Zhang JW. Automated segmentaion of breat lesions in ultraound images In: Proceddings of the 27 th Annual Conference of IEEE Engineering in Medicine and Biology Society; 2006 Jan 17-18; Shanghai, China. 2005.]. However, our study proves that the over-segmentation is unnecessary with an automatic searching algorithm of NC. Here, by setting NC to different values ranges from 2 to 10, it is found that the modified Ncut results in an ideal segmentation with NC belongs to {5, 6, 7}. So the optimal NC value is searched from 5 to 7, with the stopping criterion of area(IC(t))-area(IC(t+1))< (1/16)×area(IC(t)) (t is the trial times). Then IC(t) could be found as the final checked regions IC.
2.2.2. Boundary Adjustment
For natural images, the Ncut can result in an ideal segmentation. However, for some poor quality and edge-missing ultrasonic breast tumor images, the boundary CI gained by the method in section 2.2.1, may have a certain Hausdorff distance and mean distance error (MDE) from the real contour (i.e. gold standard, the boundary marked by physicians). To overcome this problem, we employ the active contour model containing a local gray level item in the energy function. So this model may refine the imprecise cases to much more accurate breast tumor segmentation.
The concept of Region-scalable Fitting Active Contours (RFAC) is proposed in [30Li CM, Kao CY, Gore JC, Zhao HD. Minimization of region-scalable fitting energy for image segmentation IEEE T Image Process 2008; 17(10
): 1940-9.]. For each node
where k=1 or 2 denotes the node i outside or inside the closed curve respectively, f1, f2 represent the regional gray energy of the node outside and inside the close curve,
where H is the Heaviside Function, and
2.3. Benign and Malignant Classification
In the analysis of benign and malignant status of ultrasonic breast tumors, many system-independent, robust and effective texture and morphologic features have been defined based on physician’s experience. In this study, three texture features and five morphologic features are selected out from the feature set for the subsequent classification, to avoid the complexity of dimensionality and save processing time of the system.
2.3.1. Texture and Morphological Features
Pixels of an ultrasound image hold different gray level intensities. Different lesions always have different textures. In this study, Tσtumor the standard deviation of the gray level intensity in tumors, Tσedge the standard deviation of the gray level intensity in the annular boundary area, and TRltRrt the ratio of the gray level intensity in tumors to the value in the annular boundary area are exploited as texture characteristics. Their definitions are given in Table 1.


In a morphological way, a physician clinically differentiate between benign and malignant breast tumors based on the principle that benign ones usually hold smooth shapes whilst malignant ones tend to have irregular borders. To describe this hypothesis using the mathematical expression, five morphologic characteristics including Mcompt, Mspicu, Mlobus, Mrectlike and Meccent can be selected to describe the pathological region [31Joo SY, Yang YS, Moon WK, Kim HC. Computer-Aaided Diagnosis of Solid Brest Nodules: Use of n Aartificil Neural Network Based on Multiple Sonographic Feature IEEE T Med Imag 2004; 23(10 ): 1292-300.-32Chang RF, Wu WJ, Moon WK, Chen DR. Automatic ultrasound segmentation and morphology based diagnosis of solid breast tumors Breast Cancer Res Treatment 2005; 89(2 ): 179-85.]. They are also defined in Table 1.
In Table 1, Area and Perimeter are the area and perimeter of the tumor respectively. The polar coordinates (r, θ) of boundary pixels are calculated with the origin at their center of mass. R, (ω)) is the Fourier transform of the curve-fitted radial distance (r, θ), and the #{·}means the element number of this set. Mlobus is defined as the number of local extrema in the curve-fitted (r, θ). Stavros AT, et al. proved that the spiculation shows higher odds ratio for malignant ultrasonographic features versus benign findings in [33Stavros AT, Thickman D, Rapp CL, Dennis MA, Parker SH, Sisney GA. Solid breast nodules: use of sonography to distinguishbetween benign and malignant lesions Radiology 1995; 196: 123-34.], and this could be reflected by Mlobus. The area of the tumor versus the area of its minimum enclosing rectangle is represented as Mrectlike. Llong means the length of the longest chord connected by a pair of boundary points, and Lshort the maximum of a chord set perpendicular to the longest chord.
In this way, three texture features and five morphologic features form a 1×8 vector to figure a single tumor. Lastly, it is necessary to normalize each element in the feature matrix of our ultrasonic breast tumor database into [0,1].
2.3.2. Affinity Propagation Clustering
The Affinity Propagation (AP) clustering [20Brendan JF, Delbert D. Clustering by passing messanges between data points Science 2007; 315(5814 ): 972-7.] is a novel clustering algorithm with good performance and high speed. This algorithm avoids the influence of initialization by treating all data points as potential exemplars at its initial stage. Here, instead of traditional methods, the AP clustering is presented as an effective classifier to differentiate benignancies from malignancies in an existing database.
The main iteration procedure of the AP clustering is the updating and transmission of two kinds of message: “responsibility” r(i, k) and “availability” a(i, k). Here, r(i, k) denotes the accumulated evidence for how well-suited the point k is to be the exemplar for the point i, while a(i, k) denotes the accumulated evidence of the appropriateness if the point i selects the point k as its exemplar. In order to calculate these two kinds of message, the matrix denotes similarity between each data point is introduced. The “similarity” s(i, k) shows how well the data point k is suited to be the exemplar for the data point i. The “preference” values s(k, k) all k data points are set to a same negative real number. Consequently, the input of AP clustering is a collection of real-valued similarities between each pair of data points. Taking the whole dataset as a network of data points, these two kinds of message are exchanged along edges of this network. For a point i, if the value of k maximizes a(i, k)+ r(i, k), k is an exemplar for the point i. The values of responsibilities and availabilities are combined to monitor the exemplar decisions, and thus the iteration procedure will be stopped when any termination condition is satisfied.
In this section, the AP clustering is used to classify the ultrasonic breast tumor database without any training process. Here each tumor’s feature vector is taken as a node in the network. Due to the fact that different initialized value of “preference” results in different number of identified exemplars, an empirical “preference” is chosen to access the most rational result. With the “preference” set to the minimum of input similarities, the AP classifies the breast tumor database into five clusters firstly. Each cluster has specific and similar features and tends to hold a certain malignant probability. Then, referring to the feature distribution of breast tumors, a further identification is implemented on these five clusters to differentiate benign tumors from malignant ones.
Actually, the AP clustering can be modified by introducing a constraint in the process of message passing, so as to realize an effective and specified K-cluster AP, which can directly generate K clusters as user defined just as Zhang XL, et al. introduced in [34Zhang XL, Wang W, Nørvag K, Sebag M. K-AP: Generating specified K clusters by effvient affinity propagation: In: Proceedings of the 10th IEEE International Conference on Data Mining; 2010 Dec 14-17; Sydney, Australia. 2010.]. However, K-cluster (K=2) AP fails to reach an ideal result, because of the complex clustering structure in our database. On the contrary, the original AP clustering with the empirical “preference” can finish the superior assortment based on the similarity between each tumor case.
3. EXPERIMENTAL RESULTS AND DISCUSSIONS
3.1. Materials
In this paper, the database we used includes 132 breast ultrasound images with pathologically confirmed tumors, including 67 benign tumors and 65 carcinomas. All digital images were real-time captured from a HDI-3000 ultrasound machine (ATL, USA), with a transducer whose frequency ranged from 5 to 14 MHz in clinical practices. This database was supplied by the workstation of Ultrasound Department, Huashan Hospital of Shanghai. An experienced physician marked the location of each breast tumor in its original image in advance and gave the advice whether the tumor is malignant or not. Then they were transferred to a personal computer for the following automatic ROI detection, breast tumor segmentation and classification by programming with Matlab R2008a on a PC with E8400 3GHz CPU and 3GB RAM.
3.2. ROI Generation
For each case (e.g. Fig. 5a ) in the database, after the pre-processing (e.g. Fig. 5b) and partitioning, a nine-dimensional feature vector can be extracted from each grid. Taking this feature vector as the input of the SOM, the sub-blocks will be classified into two parts.
In our research, the original image is tentatively divided into grids with a size of 32×32, 16×16, 8×8 and 4×4 respectively. The results show that a large lgrid will cause an under-segmented result and fail to distinguish the ROI and non-ROI. On the other hand, a relatively smaller lgrid means that each block only contains limited information, thus it will cause over-segmentation while incurring large cost of computation. Experimental results also show that the classification result reaches its best with lgrid =8.
The proposed method is implemented on 132 cases in the database with a sub-block size of 8×8. The ROI both extracted automatically and manually by physicians are compared in Table 2. There are 109 (88+21) successfully detected ROIs in total, taking up 82.58% of all cases. The rest 23 images failed, which means the detected ROIs do not contain the areas marked by physicians. Among those successfully detected ROIs, 80.73% are with a moderate size, which suggests that the results are almost consistent with physicians’ views. The remaining 19.27% are those which contain the ROIs marked by physicians but are generally larger in size. Among 23 failed cases using the 8×8 sub-block, eight cases will succeed by extend lgrid to 16×16. Thus the total rate of success can be promoted to 88.64%.
According to our experiments, in order to realize the adaptive selection of the grid size, the initial lgrid can be set to 1/80 of the original image width at the beginning. For those failed cases, lgrid can be successively resized to 1/40, 1/20 of the image width, etc., meanwhile further analyses are made until the accuracy rate does not improve. Since each tumor takes up different areas of an image, it is hard to predict the accurate size of the tumor area. Therefore it is difficult to directly obtain the optimal grid size. In order to avoid the under-segmentation by a large lgrid and the over-segmentation by a small lgrid, the above processes are needed.
Due to defects like speckle noise, artifacts, edge loss and uneven brightness of breast tumors, traditional ROI generation methods have some difficulties when applied in this area. The algorithm brought out in this paper will solve this problem to some extent. Fig. (5) shows two examples of the ROI generation, in which (c) are the binary output of the SOM. After the morphological filtering and the ROI selection step, the final ROIs are correctly detected (as shown in Fig. 5d), even if the shadowing artifacts (marked by the red ellipses in Fig. (5)) or the subcutaneous fat, muscle region exists.
3.3. Tumor Segmentation
The performance of tumor segmentation can be evaluated in two ways: accuracy and efficiency.
For example, Fig. (6 ) shows the result of each segmentation step based on the detected ROI, and the comparison with two leading methods, the LFAC (i.e. Local-Fitting Active Contour) [35Yang XS, Wang YY. Extracting breast tumor boundaries from ultrasonic images based on local-fitting active contour model Shanghai J Biomed Eng 2008; 29(2
): 63-.] and the RFAC model only [30Li CM, Kao CY, Gore JC, Zhao HD. Minimization of region-scalable fitting energy for image segmentation IEEE T Image Process 2008; 17(10
): 1940-9.].
) shows the result of each segmentation step based on the detected ROI, and the comparison with two leading methods, the LFAC (i.e. Local-Fitting Active Contour) [35Yang XS, Wang YY. Extracting breast tumor boundaries from ultrasonic images based on local-fitting active contour model Shanghai J Biomed Eng 2008; 29(2
): 63-.] and the RFAC model only [30Li CM, Kao CY, Gore JC, Zhao HD. Minimization of region-scalable fitting energy for image segmentation IEEE T Image Process 2008; 17(10
): 1940-9.].
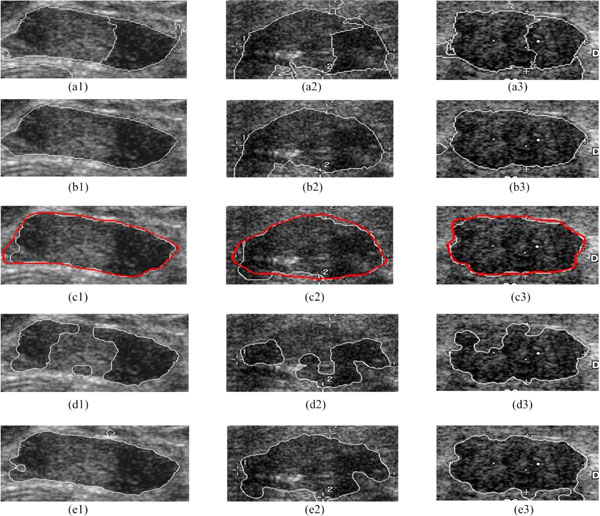
The proposed Ncut partitions the ROI into an auto-searching NC clusters (e.g. Fig. 6a1-a3), and the clusters belonging to the breast tumor are selected out as shown in Fig. (6b1-b3). Thus, 120 cases out of 132 breast tumor database can be segmented correctly, and all others can result in an ideal boundary with a further adjustment using the RFAC. The white contours in Fig. (6c1-c3) represent the final automatically detected boundaries, while the red ones are the contours outlined by physicians (the gold standard). According to the segmentation results of physicians, if the automatically detected boundaries are close to the gold standard, it is considered to be a success. Thus, without any manual intervention or initial contour delineation, the proposed method receives a high segmentation accuracy of 100%, overcoming the obstacle of inhomogeneity of gray level intensities and grayscale leak. Meanwhile, compared to the tumor areas in the gold standard, these three segmentation results have a high mean True-Positive ratio of 95.08%, a low mean False-Positive ratio of 3.38%, and a low mean False-Negative ratio of 4.92%.
Fig. (6d1-d3, e1-e3) show the segmentation results of the LFAC and the RFAC only respectively. Here, the initial contour needs to be provided in both the LFAC and the RFAC only. The LFAC [35Yang XS, Wang YY. Extracting breast tumor boundaries from ultrasonic images based on local-fitting active contour model Shanghai J Biomed Eng 2008; 29(2
): 63-.] reaches a rough contour by the traditional global optimal level set algorithm, and refines it by adding the regional energy. Since the LFAC is sensitive to the initial contour, it fails in all these three cases. The RFAC only [30Li CM, Kao CY, Gore JC, Zhao HD. Minimization of region-scalable fitting energy for image segmentation IEEE T Image Process 2008; 17(10
): 1940-9.] employs the RFAC directly on the initial contour provided. Due to its time-consuming nature, it is also necessary to set an appropriate initialization. Besides, Fig. (6e3) shows that the RFAC only may fail to detect the grayscale leak, and result in a coarse contour in the end. Being implemented on the whole databases, the LFAC fails on 27 cases, while the RFAC on 16 cases.
Meanwhile, Table 3 records the mean time cost and its standard deviation by each segmentation method to validate the efficiency.
Since the proposed method readily admits combinations of different clues such as the brightness, location and windowed histograms, it outweighs the other two methods mentioned above both in segmentation performance and operation efficiency (1.35s per case).
3.4. Benign and Malignant Classification
In the section, the extracted three texture and five morphologic features are firstly normalized, and then used to figure a single breast tumor. Table 4 shows the different performances of different classifiers including the BPANN, the FLD, the SVM, and the proposed method respectively. Whereby, the measures of true positive (TP), true negative (TN), false positive (FP), and false negative (FN) cases are calculated. Then five measures can be obtained: which are Accuracy=(TP+TN)/(TP+TN+FP+FN), Sensitivity=TP/(TP+ FN), Specificity=TN/(TN+FP), PPV=TP/(TP+FP), NPV= TN/(TN+FN).
Here, with the initial value of “preference” set to the minimum of input similarities empirically, the proposed method using the AP clustering is implemented directly on the dataset including 67 benignancies and 65 malignancies. The BPANN is exploited with one of 10 nodes hidden layer. Thirty-three benign tumors and thirty-two carcinomas are chosen at random to serve as the training samples of the BPANN, the FLD and the SVM [15Mu TT, Nandi AK, Rangayyan RM. Classification of breast masses using selected shape, edge-sharpness, and texture features with linear and kernel-based classifiers J Digit Imag 2008; 21(2 ): 153-69.]. Meanwhile, all the cases in the database are taken as their testing dataset. Experiments using each method are conducted for 100 times respectively. The proposed system receives a high accuracy of 93.18%, which is unique because of the outstanding stability of the AP clustering. Given the condition of the instability, for the BPANN, the FLD and the SVM, the mean performance of their 100 time trials is recorded. Since the AP clustering is non-supervised unlike others such as the BPANN, the FLD, the SVM, it avoids being influenced by the subjective errors of physicians. Therefore, the unsupervised AP clustering results in a better performance of classification by employing the similarity between each case, without any training procedure. Meanwhile, it outweighs other clustering methods (e.g. k-means) in a high accuracy and extremely low computation (only 6ms per case).
Since the complete receiver operating characteristics (ROC) can give a better overall view of the classification performance of methods, which holds a specific threshold to determine whether the tumor is benign or not. Thus the ROC curves of the BPANN, the FLD, and the SVM are shown in Fig. (7 ). Where, each curve is also the mean of 100 times trials. From Fig. (7), it is proven that the classification performance of the SVM is superior to the others. However, since the proposed AP clustering is based on the principle of clustering, the method itself does not require any threshold to make decisions. Therefore, no ROC is given for the proposed AP.
3.5. Selection of Classification Methods
Two kinds of unsupervised clustering algorithms are used in the CAD methods for breast tumors in ultrasonic images. Each of them has its specific application here, because of its intrinsic feature. In Section 2.1.3, the SOM is used for the pixel classification to identify the ROI, since we can appoint the cluster number to two directly and train a certain network in advance. (One cluster denotes the initial selected ROI, and the other the initial selected background.) The AP clustering is unsuitable for the ROI detection, because it is hard to find an appropriate “preference” to determine the cluster number. While in Section 2.3.2, the AP clustering is used for the classification of benign and malignant tumors, by clustering them based on the similarity between each other. Therefore, the proposed AP also wins in its great stability and training-free property.
4. CONCLUSIONS
A fully automatic system for breast tumor detection and classification in ultrasonic images is proposed in our study. The better accuracy and time-saving features make it beneficial to help the physicians in clinical practice.
Future work will focus on the follows. (1) Further post-processing needs to be added, to reduce the influence of severe shadowing artifacts in ROI detection and tumor segmentation. (2) Data smoothing may be added in the image preprocessing after the automatic ROI generation for a more precise boundary extraction, to avoid the limitations of the traditional histogram thresholding methods. Thus it might be helpful for the further development of our research to draw lessons from smoothing image segmentation methods [36Qiu P, Sun J. Local smoothing image segmentation for spotted microarray images J Am Stat Assoc 2007; 102(480 ): 1129-44., 37Qiu P, Sun J. Using conventional edge detectors and post-smoothing for segmentation of spotted microarray images J Comput Graphical Stat 2009; 18(1 ): 147-64.]. (3) More effective features are needed to be exploited to differentiate benign tumors from malignant ones, since the existing feature vectors often suffer characteristic conflict in ultrasound images.
ACKNOWLEDGEMENTS
This work was supported by the Natural Science Foundation of China (No.10974035), the Program of Shanghai Subject Chief Scientist (No. 10XD1400600) and European Seventh Framework Programme for Marie Curie Actions of International Research Staff Exchange Scheme (No. PIRSES-GA-2010-269124).
CONFLICT OF INTEREST
None declared.
REFERENCE
| [1] | Imaginis. Breast Cancer: Statistics on Incidence, Survival, and Screening Available from: http://Imaginis.com/breasthealth/statistics.asp 2008. |
| [2] | Cheng HD, Shan J, Ju W, Guo YH, Zhang L. Automated breast cancer detection and classification using ultrasound images: A survey Pattern Recog 2010; 43(1): 299-317. |
| [3] | Horsch K, Giger ML, Venta LA, Vyborny CJ. Computerized diagnosis of breast lesions on ultrasound Med Phys 2002; 29(2 ): 157-64. |
| [4] | Madabhushi A, Metaxas DN. Combining low-, high-level and empirical domain knowledge for automated segmentation of ultrasonic breast lesions IEEE T Med Imag 2003; 22(2 ): 155-69. |
| [5] | Chen DR, Hsiao YH. Computer-aided diagnosis in breast ultrasound J Ultrasound Med 2008; 16(1 ): 46-56. |
| [6] | Liu B, Cheng HD, Huang JH, Tian JW, Liu JF, Tang XL. Automated segmentation of ultrasonic breast lesions using statistical texture classification and active contour based on probability distance Ultrasound Med Bio 2009; 35(8 ): 1309-24. |
| [7] | Ning JF, Wu CK, Liu SG, Yang SQ. An improved external force field for active contour model Pattern Recogn Lett 2007; 28(1 ): 58-63. |
| [8] | Noble JA, Boukerroui D. Ultrasound image segmentation: a survey IEEE T Med Imaging 2006; 25(8 ): 987-1010. |
| [9] | Huang YL. Computer-aided diagnosis using neural networks and support vector machines for breast ultrasonography J Med Ultrasound 2009; 17(1 ): 17-24. |
| [10] | Huang YL, Chen DR. Watershed segmentation for breast tumor in 2-d sonography Ultrasound Med Bio 2004; 30(5 ): 625-32. |
| [11] | Tsantis S, Dimitropous N, Cavouras D, Nikiforidis G. A hybrid multi-scale model for thyroid nodule boundary detection on ultrasound images Comput Meth Prog Bio 2006; 84(2-3 ): 86-98. |
| [12] | Stavros AT, Thickman D, Rapp CL, Dennis MA, Parker SH, Sisney GA. Solid breast nodules: use of sonography to distinguish between benign and malignant lesions Radiology 1995; 196(1 ): 123-34. |
| [13] | Garra BS, Krasner BH, Horii SC, Ascher S, Mun SK, Zeman RK. Improving the distinction between benign and malignant breast-lesions—the value of sonographic texture analysis Ultrasonic Imag 1993; 15(4 ): 267-85. |
| [14] | Chen DR, Chang RF, Chen CJ, et al. Classification of breast ultrasound images using fractal feature J Clin Imag 2005; 29(4 ): 235-45. |
| [15] | Mu TT, Nandi AK, Rangayyan RM. Classification of breast masses using selected shape, edge-sharpness, and texture features with linear and kernel-based classifiers J Digit Imag 2008; 21(2 ): 153-69. |
| [16] | Chen DR, Chang RF, Huang YL. Breast cancer diagnosis using self-organizing map for sonography Ultrasound Med Bio 2000; 26(3 ): 405-11. |
| [17] | Langley P, Sage S. Induction of selective Bayesian classifiers In: Proceedings of the 10th Conference on Uncertainty in Artificial Intelligence, Seattle; Aug 15, 1994; WA, USA. 1994. |
| [18] | Dietterich T. Machine learning research: four current directions AI Mag 1997; 18(4 ): 97-136. |
| [19] | Zhou Z, Wu J, Tang W. Ensembling neural networks: many could be better than all Artif Intel 2002; 137(1-2 ): 239-63. |
| [20] | Brendan JF, Delbert D. Clustering by passing messanges between data points Science 2007; 315(5814 ): 972-7. |
| [21] | Su YN, Wang YY. Automatic detection of the region of interest from brest tumor ultrasound imgaes Chinese J Biomed Eng 2010; 29(2 ): 178-84. |
| [22] | Yu YJ, Acton ST. Speckle reducing anisotropic diffusion IEEE T Image Process 2002; 11(11 ): 1260-70. |
| [23] | Gonzalez RC, Woods RE, Eddins SL. Digital Image Processing Using MATLAB, Pearson Prentice Hall, Upper Saddle River, NJ 2004. |
| [24] | Baraldi A, Parmiggiani F. An investigation of the textural characteristic associated with gray level cooccurrence matrix statistical parameters IEEE T Geosci Remote 1995; 33(2 ): 293-304. |
| [25] | Kohonen T. Self-organizing maps. New York, NY: Springer-Verlag 1997. |
| [26] | Wu Z, Leahy R. An optimal graph theoretic approach to data clustering: Theory and its application to image segmentation IEEE T Pattern Anal 1993; 15(11 ): 101-3. |
| [27] | Shi JB, Malik J. Normalized cuts and image segmentation IEEE T Pattern Anal 2000; 22(8 ): 888-905. |
| [28] | Qiu PH. Image processing and jump regression analysis. Hoboken NJ: John Wiley & Sons 2005. |
| [29] | Liu X, Huo ZM, Zhang JW. Automated segmentaion of breat lesions in ultraound images In: Proceddings of the 27 th Annual Conference of IEEE Engineering in Medicine and Biology Society; 2006 Jan 17-18; Shanghai, China. 2005. |
| [30] | Li CM, Kao CY, Gore JC, Zhao HD. Minimization of region-scalable fitting energy for image segmentation IEEE T Image Process 2008; 17(10 ): 1940-9. |
| [31] | Joo SY, Yang YS, Moon WK, Kim HC. Computer-Aaided Diagnosis of Solid Brest Nodules: Use of n Aartificil Neural Network Based on Multiple Sonographic Feature IEEE T Med Imag 2004; 23(10 ): 1292-300. |
| [32] | Chang RF, Wu WJ, Moon WK, Chen DR. Automatic ultrasound segmentation and morphology based diagnosis of solid breast tumors Breast Cancer Res Treatment 2005; 89(2 ): 179-85. |
| [33] | Stavros AT, Thickman D, Rapp CL, Dennis MA, Parker SH, Sisney GA. Solid breast nodules: use of sonography to distinguishbetween benign and malignant lesions Radiology 1995; 196: 123-34. |
| [34] | Zhang XL, Wang W, Nørvag K, Sebag M. K-AP: Generating specified K clusters by effvient affinity propagation: In: Proceedings of the 10th IEEE International Conference on Data Mining; 2010 Dec 14-17; Sydney, Australia. 2010. |
| [35] | Yang XS, Wang YY. Extracting breast tumor boundaries from ultrasonic images based on local-fitting active contour model Shanghai J Biomed Eng 2008; 29(2 ): 63-. |
| [36] | Qiu P, Sun J. Local smoothing image segmentation for spotted microarray images J Am Stat Assoc 2007; 102(480 ): 1129-44. |
| [37] | Qiu P, Sun J. Using conventional edge detectors and post-smoothing for segmentation of spotted microarray images J Comput Graphical Stat 2009; 18(1 ): 147-64. |