- Home
- About Journals
-
Information for Authors/ReviewersEditorial Policies
Publication Fee
Publication Cycle - Process Flowchart
Online Manuscript Submission and Tracking System
Publishing Ethics and Rectitude
Authorship
Author Benefits
Reviewer Guidelines
Guest Editor Guidelines
Peer Review Workflow
Quick Track Option
Copyediting Services
Bentham Open Membership
Bentham Open Advisory Board
Archiving Policies
Fabricating and Stating False Information
Post Publication Discussions and Corrections
Editorial Management
Advertise With Us
Funding Agencies
Rate List
Kudos
General FAQs
Special Fee Waivers and Discounts
- Contact
- Help
- About Us
- Search


The Open Medical Informatics Journal
(Discontinued)
ISSN: 1874-4311 ― Volume 13, 2019
Interactive Software “Isotonic Design using Normalized Equivalent Toxicity Score (ID-NETS©TM)” for Cancer Phase I Clinical Trials
Zhengjia Chen1, 2, *, Zhibo Wang 2, Haibin Wang 3, Taofeek K Owonikoko 4, Jeanne Kowalski 1, 2, Fadlo R Khuri 4
Abstract
Isotonic Design using Normalized Equivalent Toxicity Score (ID-NETS) is a novel Phase I design that integrates the novel toxicity scoring system originally proposed by Chen et al. [1] and the original Isotonic Design proposed by Leung et al. [2]. ID-NETS has substantially improved the accuracy of maximum tolerated dose (MTD) estimation and trial efficiency in the Phase I clinical trial setting by fully utilizing all toxicities experienced by each patient and treating toxicity response as a quasi-continuous variable instead of a binary indicator of dose limiting toxicity (DLT). To facilitate the incorporation of the ID-NETS method into the design and conduct of Phase I clinical trials, we have designed and developed a user-friendly software, ID-NETS©TM, which has two functions: 1) Calculating the recommended dose for the subsequent patient cohort using available completed data; and 2) Performing simulations to obtain the operating characteristics of a trial designed with ID-NETS. Currently, ID-NETS©TMv1.0 is available for free download at (http://winshipbbisr.emory.edu/IDNETS.html).
Article Information
Identifiers and Pagination:
Year: 2013Volume: 7
First Page: 8
Last Page: 17
Publisher Id: TOMINFOJ-7-8
DOI: 10.2174/1874431101307010008
Article History:
Received Date: 12/10/2012Revision Received Date: 17/1/2013
Acceptance Date: 17/1/2013
Electronic publication date: 5/4/2013
Collection year: 2013
open-access license: This is an open access article licensed under the terms of the Creative Commons Attribution Non-Commercial License (http://creativecommons.org/licenses/by-nc/3.0/) which permits unrestricted, non-commercial use, distribution and reproduction in any medium, provided the work is properly cited.
* Address correspondence to this author at the 1365-B Clifton Rd, Room B4109, Winship Cancer Institute, Emory University, Atlanta, GA 30322, USA; Tel: (404) 778-2017; Fax: (404) 778-5016; E-mail: zchen38@emory.edu
| Open Peer Review Details | |||
|---|---|---|---|
| Manuscript submitted on 12-10-2012 |
Original Manuscript | Interactive Software “Isotonic Design using Normalized Equivalent Toxicity Score (ID-NETS©TM)” for Cancer Phase I Clinical Trials | |
1. INTRODUCTION
A Phase I clinical trial is the initial stage of human testing in the systematic evaluation of a new compound or combination of compounds. The main purpose of a Phase I trial is to estimate the optimal dosage of the investigational compound(s) in order to ensure patient safety while maximizing the potential for therapeutic efficacy. It is generally assumed that a higher dose of a cytotoxic agent will translate into a higher likelihood of therapeutic effect. However, increased dose also carries an increased rate and severity of unwanted adverse effects. Therefore, Phase I trial evaluation allows for a stepwise dose-escalation in order to determine the maximum tolerable dose (MTD) of the investigational agent(s) using toxicity information from a small number of patients treated at predefined dose ranges under the ceiling of the highest acceptable toxicity level [3Rosenberger WF, Haines LM. Competing designs for phase I clinical trials a review Stat Med 2002; 21(18 ): 2757-70., 4Potter DM. Phase I studies of chemotherapeutic agents in cancer patients: a review of the designs J Biopharm Stat 2006; 16(5 ): 579-604.].
Most of the currently accepted Phase I trial designs dichotomize the toxicity experience of treated patients into two main groups i.e. dose limiting toxicity (DLT) vs no DLT [1Chen Z, Krailo MD, Azen SP, Tighiouart M. A novel toxicity scoring system treating toxicity response as a quasi-continuous variable in Phase I clinical trials Contemp Clin Trials 2010; 31(5 ): 473-82., 5Yuan Z, Chappell R, Bailey H. The continual reassessment method for multiple toxicity grades: a Bayesian quasi-likelihood approach Biometrics journal 2007; 63(1 ): 173-9., 6Chen Z, Krailo MD, Sun J, Azen SP. Range and trend of expected toxicity level (ETL) in standard A + B designs a report from the Children's Oncology Group Contemp Clin Trials 2009; 30(2 ): 123-8.]. While DLTs are usually study specific, they generally fall into a group of grade 3 or 4 non-hematologicand grade 4 hematologic toxicities as well as death (grade 5) based on the National Cancer Institute (NCI) Common Terminology Criteria for Adverse Events (CTCAE) common toxicity criteria [7National Cancer Institute Common Toxicity Criteria for Adverse Events v3.0 (CTCAE) 2003. Available at http://ctep.cancer.gov/ reporting/ctc.html ]. It is very common for patients in a Phase I trial to have multiple toxicities and even multiple DLTs [1Chen Z, Krailo MD, Azen SP, Tighiouart M. A novel toxicity scoring system treating toxicity response as a quasi-continuous variable in Phase I clinical trials Contemp Clin Trials 2010; 31(5 ): 473-82., 5Yuan Z, Chappell R, Bailey H. The continual reassessment method for multiple toxicity grades: a Bayesian quasi-likelihood approach Biometrics journal 2007; 63(1 ): 173-9., 8Chen Z, Tighiouart M, Kowalski J. Dose escalation with overdose control using a quasi-continuous toxicity score in cancer Phase I clinical trials Contemp Clin Trials 2012; 33(5 ): 949-58.-11Bekele BN, Li Y, Ji Y. Risk-group-specific dose finding based on an average toxicity score Biometrics journal 2010; 66(2 ): 541-8.]. The consequence of different DLTs can be significantly different [1Chen Z, Krailo MD, Azen SP, Tighiouart M. A novel toxicity scoring system treating toxicity response as a quasi-continuous variable in Phase I clinical trials Contemp Clin Trials 2010; 31(5 ): 473-82., 5Yuan Z, Chappell R, Bailey H. The continual reassessment method for multiple toxicity grades: a Bayesian quasi-likelihood approach Biometrics journal 2007; 63(1 ): 173-9., 12Gordon NH, Willson JK. Using toxicity grades in the design and analysis of cancer phase I clinical trials Stat Med 1992; 11(16 ): 2063-75.]. For example: a grade 3 renal toxicity from which the patient never recovers full kidney function is considered a substantially worse DLT than a grade 4 reversible neutropenia. In this way, when the toxicity experience is treated as a binary variable, only the “worst” toxicity among all toxicities from each patient is considered as a binary indicator of DLT, and consequently a substantial amount of useful toxicity information is ignored [1Chen Z, Krailo MD, Azen SP, Tighiouart M. A novel toxicity scoring system treating toxicity response as a quasi-continuous variable in Phase I clinical trials Contemp Clin Trials 2010; 31(5 ): 473-82., 5Yuan Z, Chappell R, Bailey H. The continual reassessment method for multiple toxicity grades: a Bayesian quasi-likelihood approach Biometrics journal 2007; 63(1 ): 173-9., 8Chen Z, Tighiouart M, Kowalski J. Dose escalation with overdose control using a quasi-continuous toxicity score in cancer Phase I clinical trials Contemp Clin Trials 2012; 33(5 ): 949-58.]. The ability to use toxicity information from non-DLT adverse events has the potential to provide a more reliable basis for dose escalation and consequently to accelerate MTD estimation, especially when a model-based Phase I design, such as continuous reassessment method (CRM)[13O'Quigley J, Pepe M, Fisher L. Continual reassessment method: a practical design for phase 1 clinical trials in cancer Biometrics journal 1990; 46(1 ): 33-48., 14Goodman SN, Zahurak ML, Piantadosi S. Some practical improvements in the continual reassessment method for phase I studies Stat Med 1995; 14(11 ): 1149-61.] or dose escalation with overdose control (EWOC)[15Babb J, Rogatko A, Zacks S. Cancer phase I clinical trials: efficient dose escalation with overdose control Stat Med 1998; 17(10 ): 1103-20.-19Tighiouart M, Rogatko A. Dose Finding with Escalation with Overdose Control (EWOC) in Cancer Clinical Trials Stat Sci 2010; 25(2 ): 217-6.], is used. Since Phase I clinical trials are usually small studies with limited toxicity information, using all toxicity information should improve the accuracy of MTD determination and the overall efficiency of this type of study [1Chen Z, Krailo MD, Azen SP, Tighiouart M. A novel toxicity scoring system treating toxicity response as a quasi-continuous variable in Phase I clinical trials Contemp Clin Trials 2010; 31(5 ): 473-82., 8Chen Z, Tighiouart M, Kowalski J. Dose escalation with overdose control using a quasi-continuous toxicity score in cancer Phase I clinical trials Contemp Clin Trials 2012; 33(5 ): 949-58.].
In order to overcome the above limitations of current Phase I designs, we previously proposed a novel Phase I design called Isotonic Design using Normalized Equivalent Toxicity Score (ID-NETS) [1Chen Z, Krailo MD, Azen SP, Tighiouart M. A novel toxicity scoring system treating toxicity response as a quasi-continuous variable in Phase I clinical trials Contemp Clin Trials 2010; 31(5 ): 473-82.], which incorporates a novel scoring system into the original Isotonic Design proposed by Leung et al. [2Leung DH, Wang Y. Isotonic designs for phase I trials Control Clin Trials 2001; 22(2 ): 126-38.]. ID-NETS has substantially improved the accuracy of MTD estimation and trial efficiency by fully utilizing all toxicities of each patient and treating toxicity response as a quasi-continuous variable instead of a binary indicator of DLT in a Phase I clinical trial [1Chen Z, Krailo MD, Azen SP, Tighiouart M. A novel toxicity scoring system treating toxicity response as a quasi-continuous variable in Phase I clinical trials Contemp Clin Trials 2010; 31(5 ): 473-82.]. The term “quasi-continuous variable” means a continuous variable with some discrete points because of a finite number of toxicities. The toxicity response is almost, but not exactly, continuous, so that we call it a quasi-continuous variable. In order to facilitate the design and conduct of Phase I clinical trials with ID-NETS, we have designed and developed a user-friendly software entitled ID-NETS©TM. The term “user-friendly” refers to software which provides readily interactive interface windows and menus to guide users through the operation. Users can easily use the software without advanced statistical knowledge or formal training. The software is implemented in Java programming language which can be executed on any operating system with Java Virtual Machine (JVM). The first version of ID-NETS©TM is available for download for free at the website http://winshipbbisr.emory.edu/IDNETS.html.
In this paper, the methodology of ID-NETS will be briefly summarized. Greater detail can be found in the original publication [1Chen Z, Krailo MD, Azen SP, Tighiouart M. A novel toxicity scoring system treating toxicity response as a quasi-continuous variable in Phase I clinical trials Contemp Clin Trials 2010; 31(5 ): 473-82.]. The development of ID-NETS©TM software is introduced and the illustration of its usage is fully described with some examples.
2. METHODOLOGY
There are 3 major methodological components to the development of ID-NETS: 1) calculation of normalized equivalent toxicity score (NETS), 2) redefinition of MTD, and 3) original isotonic design by Leung et al. [2Leung DH, Wang Y. Isotonic designs for phase I trials Control Clin Trials 2001; 22(2 ): 126-38.]. We would like to summarize briefly each of these components below.
2.1. Calculation of Normalized Equivalent Toxicity Score
The basic idea in the development of the NETS system is to use the existing and generally accepted criteria and function. First, the NCI toxicity grading system (grade 0 to 5) is used as a framework to rank the severity of toxicity response for each patient based on the worst toxicity of the patient. Second, a logistic function is used to calculate the contributing score of all additional toxicities besides the worst toxicity of the patient in the range of 0 to1 so that this number can fit into the gap between two consecutive grades of the worst toxicity. In this way, all toxicities experienced by the patient are taken into account in the severity measurement of toxicity response in terms of the equivalent toxicity score (ETS), while the rank of toxicity response is determined primarily by the grade of the worst toxicity of the patient. In order to allow flexibility for various scenarios with different possible worst toxicities, to mimic the probability of DLT, and to make the measurement of toxicity response severity more universal, the ETS is further standardized or normalized to be a continuous variable, NETS, in the range of 0 to 1. NETS can be viewed as a fractional event and can be used to replace the binary indicator of DLT (0 or 1) in many equations, such as: dose toxicity relationship model, likelihood function, etc. For a detailed description of the normalized equivalent toxicity score (NETS) system, please refer to Section 2 of Chen’s previous publication [1Chen Z, Krailo MD, Azen SP, Tighiouart M. A novel toxicity scoring system treating toxicity response as a quasi-continuous variable in Phase I clinical trials Contemp Clin Trials 2010; 31(5 ): 473-82.].
2.2. Redefinition of Maximum Tolerated Dose
MTD is defined as the dose for which the NETS, S, is equal to a specified value, θ, called the target normalized equivalent toxicity score (TNETS) by the equation below:
S{NETS | Dose = MTD} = θ
TNETS is an analog to target toxicity level (TTL) when using a binary DLT and is determined based on the Target Toxicity Profile (TTP) at MTD [1Chen Z, Krailo MD, Azen SP, Tighiouart M. A novel toxicity scoring system treating toxicity response as a quasi-continuous variable in Phase I clinical trials Contemp Clin Trials 2010; 31(5 ): 473-82.]. In a design using binary DLT, we typically target a certain probability, p, for DLT and the remaining probability (1-p) for non-DLT toxicities. Then we further define the exact toxicity profile among the DLT probability, p, by assuming a certain ratio for the probability of Grade 3 DLT and Grade 4 DLT, respectively. Similarly, we also define the exact toxicity profile among non-DLT toxicities by assuming certain ratios for the probability of each category of non-DLT toxicity as well as the probability of no toxicity at all [1Chen Z, Krailo MD, Azen SP, Tighiouart M. A novel toxicity scoring system treating toxicity response as a quasi-continuous variable in Phase I clinical trials Contemp Clin Trials 2010; 31(5 ): 473-82.]. Then, the TNETS is the sum of all the products of mid-range NETS and the probability of each category of toxicity. For more detail on the redefinition of the MTD and calculation of TNETS, please refer to Section 3 of Chen’s previous publication [1Chen Z, Krailo MD, Azen SP, Tighiouart M. A novel toxicity scoring system treating toxicity response as a quasi-continuous variable in Phase I clinical trials Contemp Clin Trials 2010; 31(5 ): 473-82.] and Section 2.2 of Chen’s another publication [8Chen Z, Tighiouart M, Kowalski J. Dose escalation with overdose control using a quasi-continuous toxicity score in cancer Phase I clinical trials Contemp Clin Trials 2012; 33(5 ): 949-58.].
2.3. Original Isotonic Design and Development of ID-NETS
Isotonic design is a semi-parametric Phase I clinical trial design which only assumes a monotonically non-decreasing dose toxicity relationship [2Leung DH, Wang Y. Isotonic designs for phase I trials Control Clin Trials 2001; 22(2 ): 126-38.]. An isotonic regression (IR) is used to fit the accumulated data and the pooled adjacent violator algorithm (PAVA) [1Chen Z, Krailo MD, Azen SP, Tighiouart M. A novel toxicity scoring system treating toxicity response as a quasi-continuous variable in Phase I clinical trials Contemp Clin Trials 2010; 31(5 ): 473-82., 2Leung DH, Wang Y. Isotonic designs for phase I trials Control Clin Trials 2001; 22(2 ): 126-38., 20Bartholomew D, Ed. Isotonic inference In Encyclopedia of Statistical Science . New York.: Wiley 1983; vol. 4: pp. 260-5.] is employed to estimate pooled non-decreasing toxicity risks for increasing dose levels [20Bartholomew D, Ed. Isotonic inference In Encyclopedia of Statistical Science . New York.: Wiley 1983; vol. 4: pp. 260-5.]. The recommended dose level for the incoming cohort is the dose level with pooled toxicity risk closest to the target toxicity level. Therefore, an MTD with flexible target toxicity level can be estimated by the isotonic design. Isotonic design is also robust as no parametric dose toxicity relationship model is adopted. ID-NETS was developed by using the original isotonic design as a framework and replacing the binary indicator of DLT and target toxicity level in terms of probability of DLT with the NETS score and TNETS, respectively. Therefore, ID-NETS not only retains the simplicity, flexibility, and robustness of the original isotonic design, but also obtains improved trial efficiency and MTD accuracy by fully utilizing all toxicities of patients.
3. RESULTS
The current standard approach of treating toxicity response as a binary indicator of DLT can only use the most severe toxicity of each patient and dichotomize it into a binary variable. Consequently, a substantial amount of useful toxicity information is discarded, resulting in low trial efficiency. The novel scoring system used in ID-NETS offers a superior approach because it can fully utilize all toxicity events of all patients in the Phase I clinical trial, thereby increasing study power. In order to facilitate the application of ID-NETS design to the field of Phase I clinical trial, the development of corresponding statistical software is indispensable. The ID-NETS©TM software is designed and developed based on the algorithm described in Section 2 of this paper and in more detail in Section 2 of our previous publication [1Chen Z, Krailo MD, Azen SP, Tighiouart M. A novel toxicity scoring system treating toxicity response as a quasi-continuous variable in Phase I clinical trials Contemp Clin Trials 2010; 31(5 ): 473-82.]. ID-NETS©TM provides two functions: (1) Calculating the recommended next dose level from completed data; and (2) Performing simulations to obtain the operating characteristics of a trial designed with ID-NETS. After downloading the software from the link http://winshipbbisr.emory.edu/IDNETS.html, the user is able to extract the downloaded zip file by default Windows unzip software.
This software can be executed by double clicking the ID-NETS 1.0.exe fileon any operating system with the support of JVM. When the program starts, a pop-up window will require users to select one of two functions as shown in Fig. (1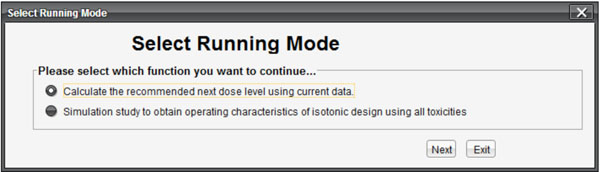 ). The first choice is for users who already have existing data and want to calculate the next recommended dose level for the subsequent patient cohort. The second choice is for users to obtain the operating characteristics of a Phase I clinical trial designed with ID-NETS method during the study planning stage.
 |
Fig. (1) Interface for selecting function. |
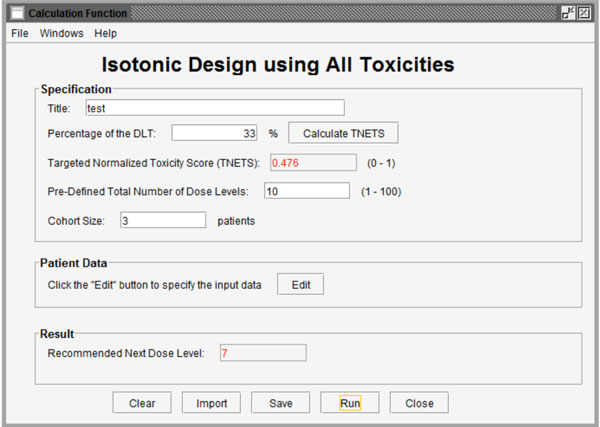 |
Fig. (2) Interface for calculation of the recommended next dose level based on existing data. |
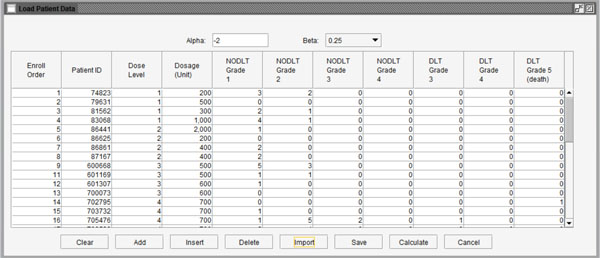 |
Fig. (3) Interface for importing data into the program. |
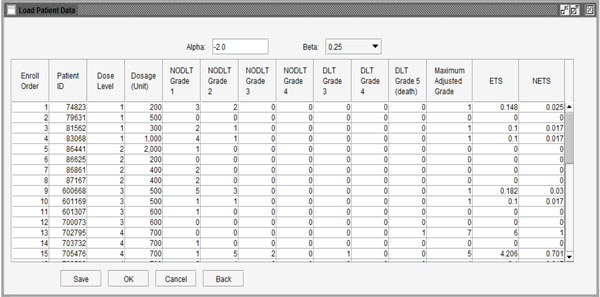 |
Fig. (4) Data showing ETS and NETS for each patient. |
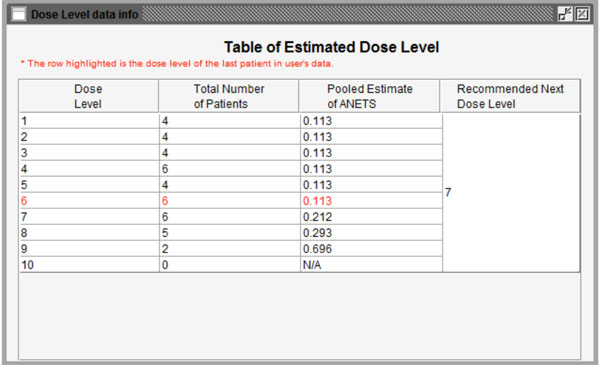 |
Fig. (5) Summary of the calculation results based on completed data. |
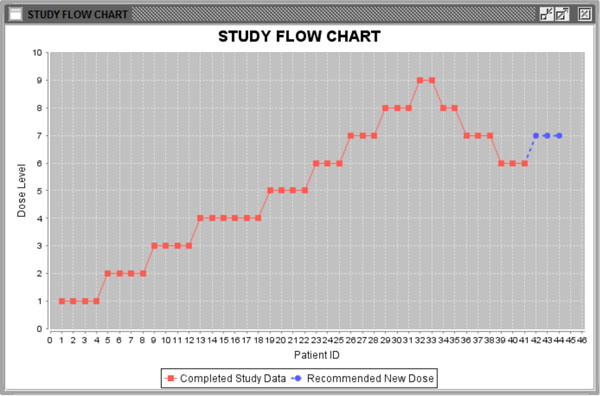 |
Fig. (6) Study flow chart. |
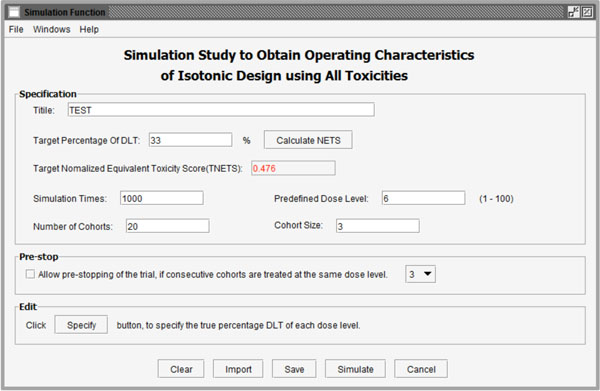 |
Fig. (7) User interface of simulation functions to obtain operating characteristics of a trial designed with ID-NETS. |
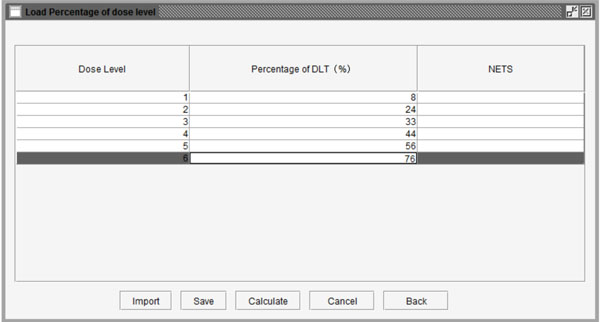 |
Fig. (8) Table to set the probability of DLT for each dose level. |
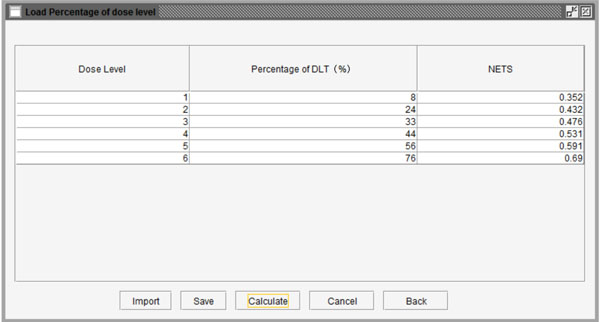 |
Fig. (9) Probability of DLT and corresponding NETS at each dose level. |
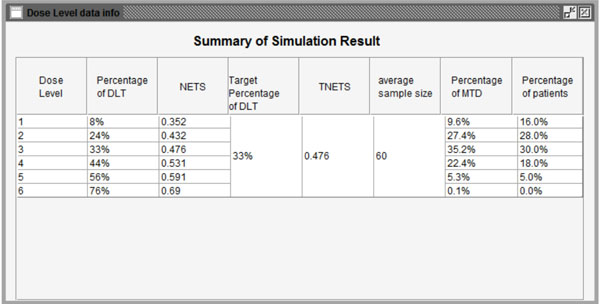 |
Fig. (10) Summary of the simulation results. |
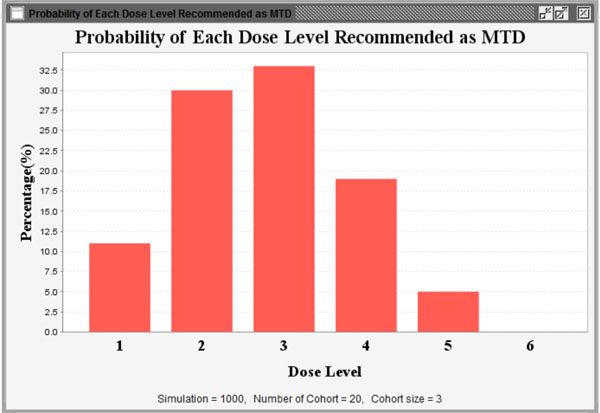 |
Fig. (11) Probability of each dose level recommended as MTD. |
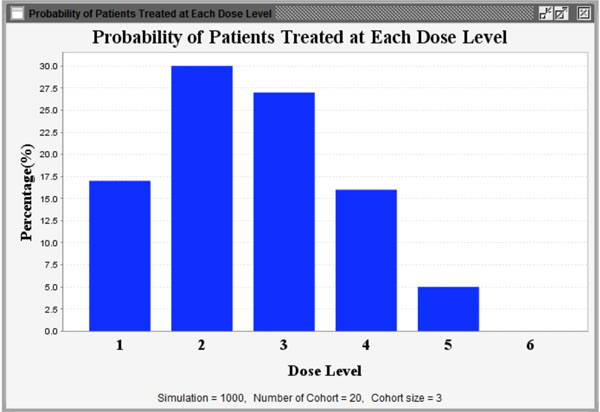 |
Fig. (12) Proportion of patients treated at each dose level. |
3.1. Calculation of the Recommended Next Dose Level from Existing Data
Fig. (2 ) shows the interface after selecting the first function to calculate the recommended next dose level from existing data. The first function called “Specification” has 4 parameters (Title, Percentage of DLT, Pre-defined total number of dose levels and Cohort size) to be set. Users can import a previously saved parameter file by clicking the “Import” button and importing the existing profile from the pop-up standard file upload window. Users can also save their entered parameters by clicking the “Save” button at the bottom of the screen.
Title: Users can name the title themselves or use the default name.
Percentage of DLT: As we introduced in section 2, users need to define a target toxicity level in terms of the possibility of DLT (for example 33%). This can be converted to a TNETS by clicking the “Calculate TNETS” button. Then the “Targeted Normalized Equivalent Toxicity Score” field will be filled with a calculated value in the range between 0 and 1.
Pre-defined total number of dose levels: Users need to define the total number of dose levels to be tested in the trial. The total number must be an integer that is greater than or equal to the number of dose levels in the completed data and in the range between 1 and 100.
Cohort size: Users candefine the number of patients in the subsequent patient cohort.
The completed patient data stored in Microsoft Excel format can be imported by clicking the “Edit” button in the middle of the interface. A sample window of imported data is shown in Fig. (3 ). At the top of the window, there are two variables. The α value reflects the differences in the impact on ETS of the “worst” toxicity and other toxicities of the same patient. It is suggested as a fixed value (-2) for all tests. The value of parameter β represents the increasing “speed” of ETS through additional toxicity. The values 0.5, 0.25 and 0.1, which are appropriate values of β according to real clinical trial data, can be chosen from the menu.
This stage provides two methods to import the user’s data: use data saved in Excel files by clicking the “Import” button at the bottom of the window or input data by observation using the buttons (“Add”, “Insert” and “Delete”). When the data are ready to use, the user can click the “Calculate” button to calculate the NETS for each patient. Fig. (4 ) shows the NETS for each observation. If users want to modify the data, they can click the “Back” button to go back to the last step. Clicking the “Ok” button will finish editing data and move to the next step of calculating the next dose level for the subsequent patient cohort.
The program will start running after clicking the “Run” button. Figs. (5 , 6
, 6 ) show the results of the calculation. In Fig. (5), the information from the last patient has been highlighted in red. The second column is the total number of patients for each dose level. The third column is the pooled estimated of ANETS of each dose level. Fig. (6) is a study flow chart showing all patient cohorts with their treated dose levels and orders. Red points represent patients treated with specific dose levels in the existing data. Blue points show the next patient cohort which will be treated at the recommended dose level.
3.2. Conducting a Simulation Study to Obtain Operating Characteristics of a Trial Designed with ID-NETS
By checking the second option in Fig. (1), the software will conduct a simulation study to obtain the operating characteristics of a trial designed with ID-NETS which fully utilizes all toxicity formation as shown in Fig. (7 ). Besides the parameters introduced in the calculation function, users also need to set the replicate number of simulations and number of cohorts in each simulated trial.
Simulation times: This parameter is the total number of simulation replicates.
Number of cohorts:This parameter is the maximum number of patient cohorts enrolled in the simulation study before it stops.
Additionally, to reduce the number of patient cohorts and shorten study length, users may pre-stop the simulation study if consecutive patient cohorts have been treated at the same dose level for a specified number of times, such as 3 or 4 etc. After clicking the “Specify” button, users can define the percentage of DLT in the pop-up window as shown in Fig. (8 ). As an example, we assume that the probabilities of DLT are 8%, 24%, 33%, 44%, 56%, and 76% for the 6 predefined dose levels from dose level 1 to 6 in a trial, respectively. The corresponding NETS can be calculated by clicking the “Calculate” button at the bottom of the window as shown in Fig. (9
 ). Next, users can start the simulation by pressing the “Simulate” button. Figs. (10
 -12
-12 ) show the simulation results using the parameters above. Fig. (10) summarizes all simulation results including dose levels, the probability of DLT and corresponding NETS of each dose level, target probability of DLT and corresponding TNETS, average sample size, the probability of each dose level recommended as the MTD, and the patient distribution over all dose levels. Fig. (11
 ) shows graphically the probability of each dose level recommended as the MTD and Fig. (12) shows graphically the patient distribution over all dose levels in the entire simulation study.
3.3. Evaluation and Validation of the Software
The system features of our software have been tested by many users who have no advanced statistical knowledge or formal statistical training, such as surgeons, clinicians, researchers, etc. Users can download the ID-NETS©TM software from the website, install it on their local computer, run the software and obtain their desired results within 30 minutes without any help. After 30 days of trial, we asked the users to complete a survey to provide feedback regarding the software and we further improved the usability of the software based on their comments. The survey results show that most users are satisfied with the performance and usability of software.
To validate the system, results from the ID-NETS©TM software under various scenarios and conditions have been compared with parallel results under the same scenarios and conditions from the standard and generally accepted advanced software, SAS. The comparisons demonstrate that the results from ID-NETS©TM software are valid. The desirable functions and features of the software are to provide user friendly interface windows and menus to guide users through and obtain results within one minute. So far, many clinicians who have used our software are satisfied with the efficiency and usability of the software.
4. DISCUSSION
A user friendly interactive interface is very important for the wide utilization of advanced methods among general scientists and physicians who have noprofessional statistical background. For example, some software, such as EWOC v2.0 [21Xu Z, Tighiouart M, Rogatko A. EWOC 2 Interactive Software for Dose Escalation in Cancer. Phase I Clinical Trials Drug Inf J 2007; 41: 221-8.], which was developed with Fortran or other computer languages, such as C++, etc., have no or poor interfaces to guide users so that their utilization has been substantially limited. To overcome these barriers, our ID-NETS©TM software is developed with Java which is very powerful and flexible in developing user friendly interactive interfaces. In particular, applications developed in Java can run on any operating system with JVM. Consequently, our ID-NETS©TM software provides many easy selection menus and better multiple interactive interface windows which guide general users without advanced statistics knowledge step by step through the whole procedure. There are also some other advantages of our ID-NETS©TM software. The software is very fast in computation and it generates readily interpretable outputs including concise summary tables and clear graphs, which can be easily saved. In order to expose more potential users around the world to ID-NETS design and to facilitate its application in their cancer Phase I clinical trials, we are planning to design and implement a web-based version of ID-NETS software to support online usage and concurrent computing.
5. CONCLUSION
In this paper, we first review the importance of Phase I clinical trials and the common cancer Phase I clinical trial designs, especially ID-NETS. Then the major methodologies of ID-NETS are briefly summarized. The development of the statistical software ID-NETS©TM and the procedures involved in using the software are described in detail. The pros and cons of the ID-NETS©TM software are further fully discussed.
In summary, ID-NETS is a leading cancer Phase I clinical trial design which was developed by integration of the NETS system and Isotonic Design. ID-NETS design uses isotonic regression and a novel toxicity scoring system to design dose escalation schemes for cancer Phase I clinical trials. Therefore, ID-NETS design not only retains the simplicity and robustness of the original Isotonic Design, but also achieves improved MTD accuracy and enhanced trial efficiency in term of study sample size, cost, and length of trial by treating toxicity response as a quasi-continuous variable and fully utilizing all toxicity information from all patients. Our ID-NETS©TM is a user friendly software with adequate performance and utility for application of ID-NETS design. The user-friendly ID-NETS©TM V1.0 Help Menu can also guide users through the download, installation, operation, and interpretation of output data so that the ID-NETS©TM software can be easily operated by clinicians without advanced statistical knowledge or formal training. At present, the ID-NETS©TMV1.0 software is available for free download from our website and can greatly facilitate the application of ID-NETS design to the practice of Phase I clinical trials.
We will continue to improve our software to provide greater functionality and better services, and accordingly, any feedback regarding the use of ID-NETS©TM V1.0 will be greatly welcomed, evaluated, and implemented in the next version of ID-NETS©TM.
CONFLICT OF INTEREST
The authors confirm that this article content has no conflict of interest.
ACKNOWLEDGEMENTS
Supported in part by NIH/NCI Grants No. 1 P01 CA116676 (Z.C. and F.K.), 5 P50 CA128613 (Z.C., F.K. and J.K.).The authors thank Dr. Anthea Hammond for her critical reading and editing of the manuscript.
REFERENCES
| [1] | Chen Z, Krailo MD, Azen SP, Tighiouart M. A novel toxicity scoring system treating toxicity response as a quasi-continuous variable in Phase I clinical trials Contemp Clin Trials 2010; 31(5 ): 473-82. |
| [2] | Leung DH, Wang Y. Isotonic designs for phase I trials Control Clin Trials 2001; 22(2 ): 126-38. |
| [3] | Rosenberger WF, Haines LM. Competing designs for phase I clinical trials a review Stat Med 2002; 21(18 ): 2757-70. |
| [4] | Potter DM. Phase I studies of chemotherapeutic agents in cancer patients: a review of the designs J Biopharm Stat 2006; 16(5 ): 579-604. |
| [5] | Yuan Z, Chappell R, Bailey H. The continual reassessment method for multiple toxicity grades: a Bayesian quasi-likelihood approach Biometrics journal 2007; 63(1 ): 173-9. |
| [6] | Chen Z, Krailo MD, Sun J, Azen SP. Range and trend of expected toxicity level (ETL) in standard A + B designs a report from the Children's Oncology Group Contemp Clin Trials 2009; 30(2 ): 123-8. |
| [7] | National Cancer Institute Common Toxicity Criteria for Adverse Events v3.0 (CTCAE) 2003. Available at http://ctep.cancer.gov/ reporting/ctc.html |
| [8] | Chen Z, Tighiouart M, Kowalski J. Dose escalation with overdose control using a quasi-continuous toxicity score in cancer Phase I clinical trials Contemp Clin Trials 2012; 33(5 ): 949-58. |
| [9] | Bekele B, Thall P, Chevret S, Sussex W, Eds. Dose-finding based on multiple ordinal toxicities in Phase I oncology Trials In Statistical Methods for Dose-Finding Experiments . Chichester UK.: Wiley 2006; pp. 243-58. |
| [10] | Bekele BN, Thall P. Dose-finding based on multiple toxicities in a soft tissue sarcoma trial J Am Stat Assoc 2004; 99: 26-35. |
| [11] | Bekele BN, Li Y, Ji Y. Risk-group-specific dose finding based on an average toxicity score Biometrics journal 2010; 66(2 ): 541-8. |
| [12] | Gordon NH, Willson JK. Using toxicity grades in the design and analysis of cancer phase I clinical trials Stat Med 1992; 11(16 ): 2063-75. |
| [13] | O'Quigley J, Pepe M, Fisher L. Continual reassessment method: a practical design for phase 1 clinical trials in cancer Biometrics journal 1990; 46(1 ): 33-48. |
| [14] | Goodman SN, Zahurak ML, Piantadosi S. Some practical improvements in the continual reassessment method for phase I studies Stat Med 1995; 14(11 ): 1149-61. |
| [15] | Babb J, Rogatko A, Zacks S. Cancer phase I clinical trials: efficient dose escalation with overdose control Stat Med 1998; 17(10 ): 1103-20. |
| [16] | Tighiouart M, Rogatko A, Babb JS. Flexible Bayesian methods for cancer phase I clinical trials.Dose escalation with overdose control Stat Med 2005; 24(14 ): 2183-96. |
| [17] | Zacks S, Rogatko A, Babb J. Optimal Bayesian-feasibile dose escalation for cancer phase I trials Stat Probab Lett 1998; 38: 215-0. |
| [18] | Cheng JD, Babb JS, Langer C, et al. Individualized patient dosing in phase I clinical trials: the role of escalation with overdose control in PNU-214936 J Clin Oncol 2004; 22(4 ): 602-9. |
| [19] | Tighiouart M, Rogatko A. Dose Finding with Escalation with Overdose Control (EWOC) in Cancer Clinical Trials Stat Sci 2010; 25(2 ): 217-6. |
| [20] | Bartholomew D, Ed. Isotonic inference In Encyclopedia of Statistical Science . New York.: Wiley 1983; vol. 4: pp. 260-5. |
| [21] | Xu Z, Tighiouart M, Rogatko A. EWOC 2 Interactive Software for Dose Escalation in Cancer. Phase I Clinical Trials Drug Inf J 2007; 41: 221-8. |