- Home
- About Journals
-
Information for Authors/ReviewersEditorial Policies
Publication Fee
Publication Cycle - Process Flowchart
Online Manuscript Submission and Tracking System
Publishing Ethics and Rectitude
Authorship
Author Benefits
Reviewer Guidelines
Guest Editor Guidelines
Peer Review Workflow
Quick Track Option
Copyediting Services
Bentham Open Membership
Bentham Open Advisory Board
Archiving Policies
Fabricating and Stating False Information
Post Publication Discussions and Corrections
Editorial Management
Advertise With Us
Funding Agencies
Rate List
Kudos
General FAQs
Special Fee Waivers and Discounts
- Contact
- Help
- About Us
- Search


The Open Materials Science Journal
(Discontinued)
ISSN: 1874-088X ― Volume 13, 2019
The Taste Sensors with Conductivity Measurement
Hung-Wei Chen*, Yi-Mu Lee, Shen-Li Chen
Abstract
There are many types of electrical signal that can be sensed from liquid solution. Among them conductivity signal is more suitable than voltage signal for the study of liquid. Thus, we choose conductivity as the target sense signal for the study of taste sensors. We developed a chemical sensors array with seven chemical sensors. There are two groups in the designed sensors. The first group is mainly made by the material of conductive polymer, the second group is made by the material of bio-mimic. A statistical method call “Principal Component Analysis” (PCA) is used to process the job of classified the tastes. The PCA results show the taste sensors array can distinguish four basic tastes in liquid. The experiment results show that four basic tastes are successful classified by principal component analysis. Six sport drinks are identified and classified in salt area. The results also show that quantities of salt sample can be analyzed by PCA method.
Article Information

Identifiers and Pagination:
Year: 2016Volume: 10
Issue: Suppl-1, M4
First Page: 37
Last Page: 43
Publisher Id: TOMSJ-10-37
DOI: 10.2174/1874088X01610010037
Article History:
Received Date: 9/4/2015Revision Received Date: 15/5/2015
Acceptance Date: 8/7/2015
Electronic publication date: 15/07/2016
Collection year: 2016
open-access license: This is an open access article licensed under the terms of the Creative Commons Attribution-Non-Commercial 4.0 International Public License (CC BY-NC 4.0) (https://creativecommons.org/licenses/by-nc/4.0/legalcode), which permits unrestricted, non-commercial use, distribution and reproduction in any medium, provided the work is properly cited.
* Address correspondence to this author at the Department of Electronic Engineering, National United University, MiaoLi City 36003, Taiwan; Tel: +886-37-382528; Fax: +886-37-382498; E-mail: hwchen@nuu.edu.tw
| Open Peer Review Details | |||
|---|---|---|---|
| Manuscript submitted on 9-4-2015 |
Original Manuscript | The Taste Sensors with Conductivity Measurement | |
INTRODUCTION
The researchers find human beings can distinguish five kinds of basic tastes, i.e., sweet, salt, acid, umami, and bitter tastes. The taste is the specific nerve signal generated by the different receptors on the taste bud after a certain molecular stimulation. And, the combined sense of each receptor is a certain taste. That is, taste is the sensation that results when taste buds in the tongue deliver information about the chemical composition of a soluble stimulus. A taste sensor is designed based on this principle to mimic the human taste sense system.
At present, many researchers have published their research results about “taste sensors” [1Toko K. Taste sensor with global selectivity. Mater Sci Eng 1996; C4: 69-82.
[http://dx.doi.org/10.1016/0928-4931(96)00134-8] -7Winquist F, Bjorklund R, Krantz RC, Lundstr I, Ostergren K, Skoglund T. An electronic tongue in the dairy industry. Sens Actuators B Chem 2005; 111-112: 299-304.
[http://dx.doi.org/10.1016/j.snb.2005.05.003] ]. For example, in 1998, the research group of professor Toko in Japan Kyushu University published a series of sensing technology including design of taste sensor and analysis of potential measuring [1Toko K. Taste sensor with global selectivity. Mater Sci Eng 1996; C4: 69-82.
[http://dx.doi.org/10.1016/0928-4931(96)00134-8] -4Toko K. Taste sensor. In: Biomimetic Sensor Technology. Cambridge: Cambridge University Press 2000; pp. 113-80.
[http://dx.doi.org/10.1017/CBO9780511541179.007] ], which can be used in the analysis of beers and foods produced from various factories. In 2002, the research group of professors A. Legin and A. Rudnitskaya in St. Petersburg University, Russia published their research results on electronic tongue used in water quality, food, environment and clinical examination analysis [8Vlasov Y, Legin A, Rudnitskaya A. Electronic tongues and their analytical application. Anal Bioanal Chem 2002; 373(3): 136-46.
[http://dx.doi.org/10.1007/s00216-002-1310-2] [PMID: 12043015] ].
In 2002, professor D. Barrow from British University of Cardiff published his research results on optical electronic tongue used in measuring the water quality in the river; and in 2001, the research group under professor John T. McDevitt [9Curey TE, Goodey A, Tsao A, et al. Characterization of multicomponent monosaccharide solutions using an enzyme-based sensor array. Anal Biochem 2001; 293(2): 178-84.
[http://dx.doi.org/10.1006/abio.2001.5114] [PMID: 11399030] ] from University of Texas at Austin in the United States published their research result on optical electronic tongue used in detecting and analysis of water quality, poison, biochemistry, bacteria, food environment, clinical examination analysis and HPLC detector analysis.
The taste sensor system as shown in Fig. (1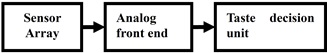 ) has three subsystems. There are: sensor array, analog front end, and taste decision unit. The sensor array is used to sense the electrically signals from solution. It is equipped with several chemical sensors; maybe 3 to 12 or more sensors. Every sensor could compose polymer thin film that deposited on a metal electrode. When the chemical sensor contacts a solution-under-test, the thin film of the sensor can absorb substances dissolved in the solution, and the electrical character of the electrode is therefore changed. By analyzing the combination of electrical character of each sensor, a specific point may be identified on a diagram for measurement of
sweet, salt, acid, bitter, and umami tastes. The second subsystem of the proposed taste sensors is the analog front end. It is an analog signals readout circuit and converts the analog signals to the digital signals for data analysis. The taste decision unit is the third subsystem which is a totally digital system for data treatment and taste classification.
) has three subsystems. There are: sensor array, analog front end, and taste decision unit. The sensor array is used to sense the electrically signals from solution. It is equipped with several chemical sensors; maybe 3 to 12 or more sensors. Every sensor could compose polymer thin film that deposited on a metal electrode. When the chemical sensor contacts a solution-under-test, the thin film of the sensor can absorb substances dissolved in the solution, and the electrical character of the electrode is therefore changed. By analyzing the combination of electrical character of each sensor, a specific point may be identified on a diagram for measurement of
sweet, salt, acid, bitter, and umami tastes. The second subsystem of the proposed taste sensors is the analog front end. It is an analog signals readout circuit and converts the analog signals to the digital signals for data analysis. The taste decision unit is the third subsystem which is a totally digital system for data treatment and taste classification.
 |
Fig. (1) The block diagram of electronic tongue system. |
Up to now, the development of new taste sensor is still a big challenge. Different material and architecture can form different sensors with different characteristics. For this paper, we develop a sensor array to sense the conductivity signal from solution. The designed sensor array has six new chemical sensors and a silver-to-silver sensor for reference. The sensor architecture we used is different to “the polymer thin film deposited on a metal electrode electrically” which mentioned above. A plastic tube contains agar-like sensing material is used to build-up the sensors. Inside the plastic tube a silver electrode is dipped into the solution-under-test to sense and output signal. This architecture, however, is simpler than others. The sensed signals then are measured by a LCZ meter and output to a computer for the taste classification. The taste classification technology has many different methods, such as, some researchers find neural network shows good performance to classify the basic tastes in liquid. Other researchers find a statistic technique called principal component analysis (PCA) [10Wu RJ, Huang CY, Cha VM, Lin TH, Hung SL, Luk HN. Photoreduction measurement of ozone using Pt/TiO2-SnO2 material at room temperature. Sens Actuators 2007; 123(2): 1077.
[http://dx.doi.org/10.1016/j.snb.2006.11.013] , 11Beullens K, Meszaros P, Ermeir SV, et al. Analysis of tomato taste using two types of electronic tongues. Sens Actuators B Chem 2008; 131(1): 10-7.
[http://dx.doi.org/10.1016/j.snb.2007.12.024] ], one of the multivariate data analysis, also shows good performance. In our paper we use PCA to do the taste classification.
In this paper, we use conductivity signal as the output of the analog front end. The conductivity measurement is a cheap, fast, and reliable method. With the conductivity measurement, we can distinguish taste in the liquid by a simple method.
EXPERIMENT DETAILS
The Taste Sensor
The architecture of the designed taste sensor is shown in Fig. (2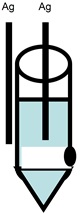 ). Two metal electrodes and a plastic tube that filled with the agar-like taste-sensing mixture form the chemical taste sensor. There are two groups in the designed sensors. The first group is mainly made by the material of conductive polymer, such as polyvinyl alcohol and polypyrrole. The reason of choosing them as filling material is based on the characteristic of easily prepared standard electrochemical techniques. The second group is focused on the material of bio-mimic, which is a new material for sensor.
 |
Fig. (2) The architecture of taste sensor. |
As describe above the taste sensor has two metal electrodes. Both of them are made of silver. One electrode is dipped into the taste-sensing mixture as the sensing electrode. The other electrode is outside the tube with a fixed distance away from the sensing electrode. This electrode is used as the reference electrode. Under the bottom of the tube a small hole is created, this hole is very small and the filling taste-sensing mixture is agar-like, the interaction between the solution and taste-sensing material will not change the character of the solution-under-test during the time of sensing. So, a stable environment for sense signal from the solution is guaranteed. Thus, the sensed signals are reliable.
The Sensor Array and the Experimental Arrangement
The experimental arrangement is shown in Fig. (3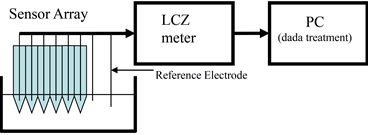 ). We use seven different taste sensors to compose of our sensor array. The sensor array is dipped into the sample-under-test to sense the conductivity signal from solution. A LCZ meter is used to receive the conductivity signal from the sensor array. We use a personal computer as the data treatment unit.
 |
Fig. (3) The sensor array and the experimental arrangement. |
THE CONDUCTIVITY MEASUREMENT RESULTS
Totally 25 different standard solutions are prepared. Each taste has five different concentrations. We measure the conductivity of these 25 solutions. They are for understand the relationship between the conductivity and the concentrat-ion of the standard solution. The results of the measured conductivity are shown in the Table 1. During measurement, the temperature is 22°C.
The concentration is proportional to the conductivity, i.e. the higher the concentration, the higher the conductivity. According to the Table 1, different categories and different tastes possess different conductivity distributions. Since the dissociation of salt is higher, the conductivity of salt under the same concentration is higher than other standard solutions. The bitter and sweet tastes possess smaller conductivity, umami taste possesses a similar conductivity as salt, and acid possesses a unique conductivity distribution. Since there is a certain difference between the conductivity distributions of different tastes, the conductivity distribution may be used as an index for the taste measurement.
THE APPLICATION OF PCA TO CONDUCTIVITY TYPE TASTE SENSORS
The Principal Component Analysis Method
The principal component analysis method is a statistical method originally brought up by Pearson in 1901, and developed by Hotelling in 1933. Particularly, the principal component analysis method is one of the multivariate analyses. The main objects of the multivariate analysis are: (1) simplification of the data, i.e., simplifying multivariate into a fewer variables; (2) exploratory data analysis, i.e., to explore causality; (3) grouping work of low space diagram such as a bi-space, i.e., to group the related (or similar) individual (or variable) into same group. The user can then explain the phenomenon according to these analysis results. The multivariate analysis is a strong tool to understand and explain the phenomenon. In recent years, the application of multivariate analysis is becoming easier due to the rapid development of personal computer.
The first principal component possess the most information. The purpose of the variable correlation matrix shows the cross relationship between each variables. For our project, the lowest value is 0.363 and the highest value is 0.913 (except 1). The results show a suitable cross relationship between these seven variables. That is, these seven sensors are suitable for treatment by PCA. The variance of the first principal component is about 60%. This value is much greater than the others. This again makes sure the use of PCA is suitable.
The results of PCA
Figs. (4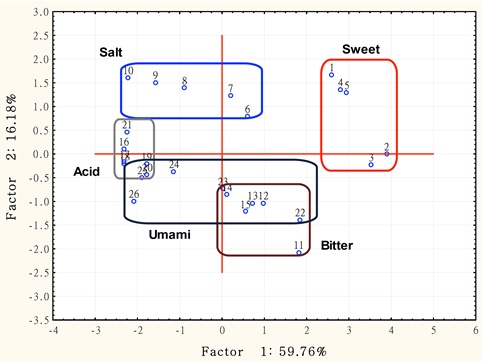 , 5
, 5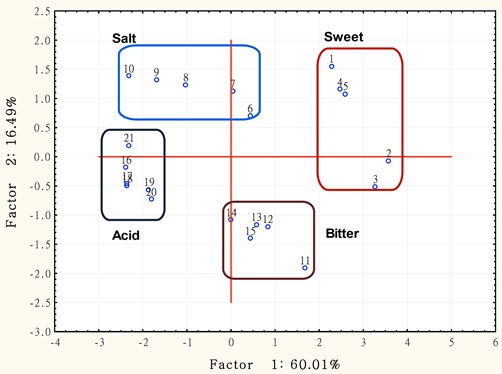 ) show the results of five or four standard taste solutions of principle component analysis. They are present by two dimensional diagrams. Fig. (4) is the PCA diagram of five standard taste solutions---PCA1 to PCA2. Fig. (5) is the PCA diagram of four standard taste solutions---PCA1 to PCA2. According to Fig. (4) except the salt and umami tastes cannot be effectively differentiated from each other, the other three tastes can be differentiated very clearly. Thus, we discard umami and reserve salt to do the principle component analysis. The result is shown in Figs (4, 5) have substantially the same differentiating capability except that four tastes occupied at different area at Fig. (5).
 |
Fig. (4) Standard five taste solutions---the PCA diagram of PCA1 to PCA2. |
 |
Fig. (5) Standard four taste solutions---PCA1 to PCA2. |
Based on the description above, the proposed electronic tongue can only classified four tastes (sweet, salt or umami, bitterness, acid) from the solution. The tastes of salt and umami mixed in the same area in the figure of PCA. However, in some solution salt and umami does not exist at the same time, such as sport drink. The sport drink may contain the tastes of sweet, acid, and salt. Below we will use the proposed electronic tongue to taste sport drink.
The Taste Classification of Sport Drink
Six different brands of sport drinks are randomly chosen from super market for test. We first measure the pH value. According to the pH value, all the six sport drinks are below 4. That is, they are acidity drink. Next, we measure the conductivity of this six sport drinks. Compare the measured conductivity value to the Table 1, we may make a decision that the taste of these sport drink are belong to sweet for the conductivity values of sport drinks are between the range of 1.423mS to 2.5mS that are at the same range of sweet. According to the composition table shown in the bottle of the selected sport drink, all the sport drinks include many ions such as Na+, K+, thus, the taste of the sport drink should be salty. These three tastes are important for the sport drink. We hope we can use our sensor array to classify the taste of the sport drink to one of the three tastes.
The collected data is processed by the PCA. The PCA result is shown in Fig. (6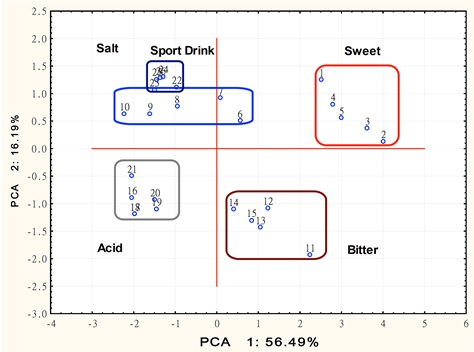 ), which is PCA1 vs PCA2. We found all the data of the six sport drinks are all on the salt area. From the PCA diagram we also found that the concentration is around 3mM to 30mM. This observation is agreed with the data shown in the composition table which is announced by the manufacturer. Thus, the concentration of salt can be quantified by our taste sensor array.
CONCLUSION
The proposed taste sensor system has a new sensor array with seven chemical sensors with the sensed signal is conductivity signal. The sensor array is designed to sense five standard basic tastes in liquid. A statistical method call principal component analysis is applied to classified tastes in liquid. However, the PCA measured results shows only four tastes can be successful distinguish. That is, except salt and umami, other three tastes have different patterns. The results of PCA show four basic tastes: salt, bitter, acid, and sweet, occupying four different areas. The PCA results also show the taste of salt can be quantified by our system. Six sport drinks are selected and processed by the sensor array. The results of PCA show its location is in the salt area and the concentration is 3mM to 30mM. The results agree with the data from the composition table which is announced by the manufacturer.
 |
Fig. (6) Sport drink---the PCA diagram of PCA1 to PCA2. |
CONFLICT OF INTEREST
The authors confirm that this article content has no conflict of interest.
ACKNOWLEDGEMENTS
Declared none.
REFERENCES
| [1] | Toko K. Taste sensor with global selectivity. Mater Sci Eng 1996; C4: 69-82. [http://dx.doi.org/10.1016/0928-4931(96)00134-8] |
| [2] | Toko K. Electronic tongue. Biosens Bioelectron 1998; 13(6): 701-9. [http://dx.doi.org/10.1016/S0956-5663(98)00025-6] [PMID: 9828364] |
| [3] | Habara M, IKezaki H, Toko K. Study of sweet taste evaluation using taste sensor with lipid. Biosens Bioelectron 1998; 19(12): 1559-63. [http://dx.doi.org/10.1016/j.bios.2003.06.002] [PMID: 15142588] |
| [4] | Toko K. Taste sensor. In: Biomimetic Sensor Technology. Cambridge: Cambridge University Press 2000; pp. 113-80. [http://dx.doi.org/10.1017/CBO9780511541179.007] |
| [5] | Winquist F, Wide P, Lundstr I. An electronic tongue based voltammetry. Anal Chim Acta 1997; 357: 21-31. [http://dx.doi.org/10.1016/S0003-2670(97)00498-4] |
| [6] | Cole M, Sehra G, Gardner JW, Varadan VK. Development of smart tongue devices for measurement of liquid properties. IEEE Sens J 2004; 4(5): 543-50. [http://dx.doi.org/10.1109/JSEN.2004.832855] |
| [7] | Winquist F, Bjorklund R, Krantz RC, Lundstr I, Ostergren K, Skoglund T. An electronic tongue in the dairy industry. Sens Actuators B Chem 2005; 111-112: 299-304. [http://dx.doi.org/10.1016/j.snb.2005.05.003] |
| [8] | Vlasov Y, Legin A, Rudnitskaya A. Electronic tongues and their analytical application. Anal Bioanal Chem 2002; 373(3): 136-46. [http://dx.doi.org/10.1007/s00216-002-1310-2] [PMID: 12043015] |
| [9] | Curey TE, Goodey A, Tsao A, et al. Characterization of multicomponent monosaccharide solutions using an enzyme-based sensor array. Anal Biochem 2001; 293(2): 178-84. [http://dx.doi.org/10.1006/abio.2001.5114] [PMID: 11399030] |
| [10] | Wu RJ, Huang CY, Cha VM, Lin TH, Hung SL, Luk HN. Photoreduction measurement of ozone using Pt/TiO2-SnO2 material at room temperature. Sens Actuators 2007; 123(2): 1077. [http://dx.doi.org/10.1016/j.snb.2006.11.013] |
| [11] | Beullens K, Meszaros P, Ermeir SV, et al. Analysis of tomato taste using two types of electronic tongues. Sens Actuators B Chem 2008; 131(1): 10-7. [http://dx.doi.org/10.1016/j.snb.2007.12.024] |