- Home
- About Journals
-
Information for Authors/ReviewersEditorial Policies
Publication Fee
Publication Cycle - Process Flowchart
Online Manuscript Submission and Tracking System
Publishing Ethics and Rectitude
Authorship
Author Benefits
Reviewer Guidelines
Guest Editor Guidelines
Peer Review Workflow
Quick Track Option
Copyediting Services
Bentham Open Membership
Bentham Open Advisory Board
Archiving Policies
Fabricating and Stating False Information
Post Publication Discussions and Corrections
Editorial Management
Advertise With Us
Funding Agencies
Rate List
Kudos
General FAQs
Special Fee Waivers and Discounts
- Contact
- Help
- About Us
- Search


The Open Petroleum Engineering Journal
(Discontinued)
ISSN: 1874-8341 ― Volume 12, 2019
Calcareous Interlayer Causes and Logging Identification for the Shawan Formation of the Chunfeng Oilfield
Qingjie Hou1, *, Qiang Jin1, Weizhong Li2, Lamei Lin1, Wenmin Jiang3, Wenjie Han2
Abstract
Background:
Many sets of calcareous interlayers are present in the Shawan Formation in the Chunfeng oilfield, which leads to scattered residual oil that is difficult to extract.
Objective:
Observations of core samples and thin sections, analyses of trace element compositions and interpretations of logging data were used to identify the calcareous interlayers and identify their possible origin.
Method:
First, the petrologic characteristics of the calcareous interlayers were identified; then, we developed a quantitative function for identifying the calcareous interlayers based on well log data. Finally, the possible origin of these calcareous interlayers was identified based on these findings.
Conclusion:
The results show that the quantitative function has a high accuracy of 91.8% and average uranium content of calcareous interlayers can reach as high as 27×10-6, indicating that the quantitative identification function provided accurate identification of the calcareous interlayers, and highly radioactive uranium is one explanation for the origin of the calcium cementation.
Article Information

Identifiers and Pagination:
Year: 2017Volume: 10
First Page: 134
Last Page: 142
Publisher Id: TOPEJ-10-134
DOI: 10.2174/1874834101710010134
Article History:
Received Date: 01/06/2016Revision Received Date: 06/12/2016
Acceptance Date: 16/01/2017
Electronic publication date: 26/05/2017
Collection year: 2017
open-access license: This is an open access article distributed under the terms of the Creative Commons Attribution 4.0 International Public License (CC-BY 4.0), a copy of which is available at: (https://creativecommons.org/licenses/by/4.0/legalcode). This license permits unrestricted use, distribution, and reproduction in any medium, provided the original author and source are credited.
* Address correspondence to this author at the School of Geosciences, China University of Petroleum, No.66 Changjiang West Road, Huangdao District, Qingdao, Shandong 266580, P.R. China, Tel: 8618678679199; E-mails: houqingjie87@163.com, b13010021@s.upc.edu.cn
| Open Peer Review Details | |||
|---|---|---|---|
| Manuscript submitted on 01-06-2016 |
Original Manuscript | Calcareous Interlayer Causes and Logging Identification for the Shawan Formation of the Chunfeng Oilfield | |
1. INTRODUCTION
Most of the oil fields in China have entered a middle-late development stage in which the moisture content of the reservoir is high and the production declines rapidly. Therefore, accurate predictions of the distribution of the remaining oil are key to stable oil field production [1R.B. Han, Q. Liu, T.W. Jiang, H.M. Xu, Z.H. Xu, L. Zhao, C. Lei, and P.C. Zhang, "Feature, origin and distribution of calcareous interlayers: A case of Carboniferous Donghe sandstone in Hade Oil Field, Tarim Basin, NW China", Petro. Explor. Develop., vol. 41, pp. 428-436, 2014.
[http://dx.doi.org/10.1016/S1876-3804(14)60054-9] -3Z.B. Liu, H.H. Liu, and X.F. Ding, "Theoretical study of water saturation with percolation mechanics method", Open Pet. Eng. J., vol. 5, pp. 21-24, 2012.
[http://dx.doi.org/10.2174/1874834101205010021] ]. Calcareous interlayers are a primary controlling factor that enhances the heterogeneity of reservoirs [4A. Munnecke, and H. Westphal, "Variations in primary aragonite, calcite, and clay in fine-grained calcareous rhythmites of Cambrian to Jurassic age—an environmental archive?", Facies, vol. 51, pp. 592-607, 2005.
[http://dx.doi.org/10.1007/s10347-005-0053-x] , 5D.R. Katti, S.R. Schmidt, P. Ghosh, and K.S. Katti, "Molecular modeling of the mechanical behavior and interactions in dry and slightly hydrated sodium montmorillonite interlayer", Can. Geotech. J., vol. 44, pp. 425-435, 2007.
[http://dx.doi.org/10.1139/t06-127] ], complicates the relationship between oil and water movement and leads to scattered residual oil that is difficult to extract [6L.D. Gan, X.F. Dai, X. Zhang, L.G. Li, W.H. Du, X.H. Liu, Y.B. Gao, M.H. Lu, S.F. Ma, and Z.Y. Huang, "Key technologies for the seismic reservoir characterization of high water-cut oilfields", Petro. Explor. Develop., vol. 39, pp. 365-377, 2012.
[http://dx.doi.org/10.1016/S1876-3804(12)60056-1] -9J.J. Zhang, X.L. Zheng, L. Chen, and Y.W. Sun, "Effect of residual oil saturation on hydrodynamic properties of porous media", J. Hydrol. (Amst.), vol. 515, pp. 281-289, 2014.
[http://dx.doi.org/10.1016/j.jhydrol.2014.04.067] ]. Therefore, the study of calcareous interlayers that cause strong reservoir heterogeneity has attracted the increasing attention of researchers interested in their identification and quantitative evaluation. This set of problems will provide a focus for international research. The Shawan Formation of the Neogene System in the Chunfeng oilfield is characterized by a shallow thin layer of heavy crude oil and currently produces continuously. This formation has good prospects for exploration and development [10X.Z. Wang, J.Z. Wang, and M.Q. Qiao, "Horizontal well, nitrogen and viscosity reducer assisted steam huff and puff technology: Taking super heavy oil in shallow and thin beds, Chunfeng Oilfield, Junggar Basin,NW China, as an example", Petro. Explor. Develop., vol. 44, pp. 97-102, 2013. [http://dx.doi.org/10.1016/S1876-3804(13)60010-5]., 11W.J. Xi, Z.H. Zhang, X.Y. Xu, and C.E. Shi, "Application of fluid inclusion techniques to the study of super-heavy oil accumulation in Chunfeng oilfield, Junggar Basin", Oil Gas Geol., vol. 35, pp. 350-358, 2014.]; during exploration, we identified several calcareous interlayers in this formation, and these interlayers have unique characteristics including coarse grain size, a considerable volcanic rock component and high radioactivity. However, a method of identifying the calcareous interlayers has not been developed, the reasons for their formation are not clear, and they have hindered further oil exploration. To predict the distribution of calcareous interlayers in the study area, it is necessary to develop a quantitative method for their identification and then to analyze their possible origins.
2. GEOLOGICAL BACKGROUND
The Chunfeng oilfield is located in the northeastern Chepaizi High in the western uplift of the Junggar Basin, a short distance northwest of Zaire Mountain, and is connected to the Changji Sag to the east [12K. Yang, C.Q. Dong, and G.S. Xu, "Analysis of provenance and sedimentary facies of Neogene Shawan formation in Chepaizi Area", J. Chin. Univ. Petrol., vol. 36, pp. 7-19, 2012., 13F. Song, S.C. Yang, N.N. Su, K. Xiang, and Y.F. Zhao, "New understanding of sedimentary facies of Shawan formation in Chunfeng Oilfield,Junggar Basin", Petrol. Geol. Exper., vol. 36, pp. 238-242, 2013.]. It was the second oilfield discovered since the Shengli oilfield began dominating the West New Area (Fig. 1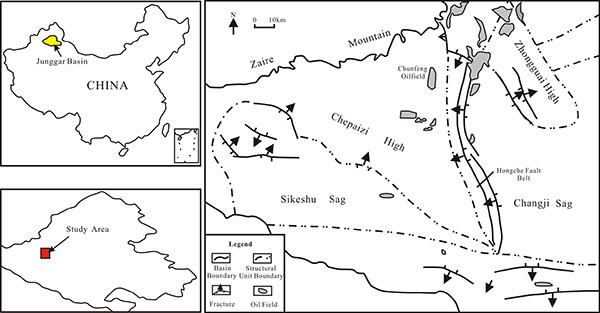 ). According to the drilling results (Fig. 2
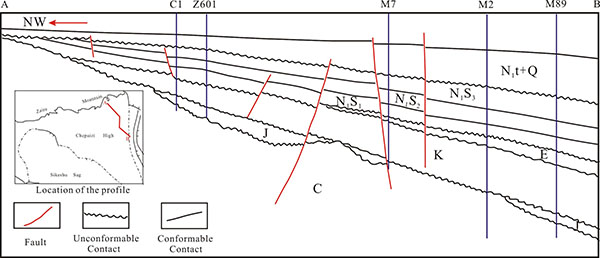 ), the rocks in the Chepaizi High, from their bottom to top, belong to the Carboniferous, Jurassic, Cretaceous, Paleogene, Neogene Systems and Quaternary systems [14K. Xiang, Y.F. Zhao, and J.F. Wang, "Stratigraphic division and correlation using various approaches-case of strati graphic correlation of heavy oil, Chunfeng oilfield,Junggar Basin", Petrol. Geol. Rec. Eff., vol. 18, pp. 1-5, 2011., 15L.Q. Zhang, X.R. Xiao, H. Xiao, Y.M. Gao, and B.R. Tian, "Types and distribution of diagenetic alterations in the nearshore subaqueous fan of the upper ES4 in Shengtuo area of Dongying depression", Nat. Gas Geosci., vol. 26, pp. 13-19, 2015.]. Carboniferous rocks constitute the entire basement of the Junggar basin. No wells have reached the bottom of the Carboniferous System. The Tugulu group of the Cretaceous and Neogene Systems is widely distributed [16D.F. He, X.F. Chen, J. Kuang, L. Zhao, Y. Tang, and D.G. Liu, "Development and genetic mechanism of Chepaizi-Mosuowan uplift in Junggar Basin", Earth Sci. Front, vol. 15, pp. 42-55, 2008.
[http://dx.doi.org/10.1016/S1872-5791(08)60038-X] , 17G.S. Qu, Z.J. Ma, N. Zhang, T. Li, and Y. Tian, "Fault structures in and around Junggar Basin", Xinjiang Petrol. Geol., vol. 29, pp. 290-295, 2008.]. The Jurassic System is distributed locally and constitutes eroded debris deposited in gullies incised in the Carboniferous System. The formations above the Cretaceous System overlap in upward-sloping steps in the northwest direction. The Neogene System contains Shawan, Taxihe and Du Shanzi Formations, and the lithology is an unequally proportioned between glutenite and mudstone. The Shawan Formation is widespread in the Chepaizi area and thins until it pinches out towards the northwest; however, the thickness in the southeast can exceed 400 m. The Shawan Formation presents a discordant on-lap contact with the Taxihe Formation and uncomfortably overlies the Paleogene System based on a seismic cross-section. The Shawan Formation can be divided into three sections based on its lithology: the Sha-1, Sha-2 and Sha-3 sections. The Sha-2 and Sha-3 sections are composed of thick mudstone and siltstone and lack calcareous interlayers. The Sha-1 section, which has been heavily studied, consists of thick light-gray pebbly sandstone, gray gravelly and pebbly sandstone, and thin mudstone, and calcium cementation phenomena are common [13F. Song, S.C. Yang, N.N. Su, K. Xiang, and Y.F. Zhao, "New understanding of sedimentary facies of Shawan formation in Chunfeng Oilfield,Junggar Basin", Petrol. Geol. Exper., vol. 36, pp. 238-242, 2013.].
 |
Fig. (1) Location of the Chunfeng oilfield (modified from Y.F. Chen, 2011). |

3. THE RESEARCH METHODS AND RESULTS
3.1. Petrology of Calcareous Interlayers
The calcareous interlayers of the Sha-1 section in the study area consist mainly of glutenite with carbonate cementation. We used core observations, common slices and thin section observations of typical wells to investigate the petrologic characteristics, including the lithology, thickness and microstructure, of the calcareous interlayers. These findings were based on samples from wells distributed throughout the study area.
3.1.1. Lithology
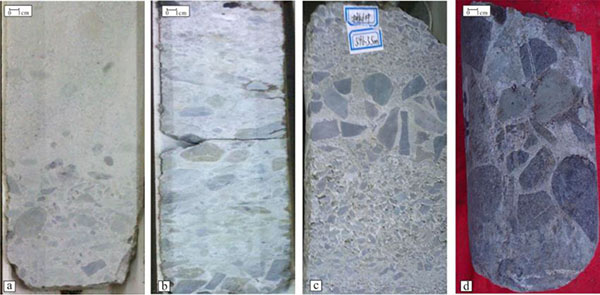
The cores Fig. (3 ) indicate that the calcium-cemented portions of the reservoir are pale, that the retrieval rates of the cores are high, and that the cores are relatively complete and are finer and tighter than the portions cemented by argillaceous minerals. The calcium cements are composed mainly of calcium carbonate, and these materials exhibit a clear blister phenomenon after the application of a drop of dilute hydrochloric acid. The calcium-cemented portion of the reservoir consists of conglomerates, gravelly sandstones and conglomeratic sandstones. The sediment grain size is generally coarse, can appear in any position in a rhythmic set of beds, and is easily recognized.
3.1.2. Thickness
We measured the thickness of the calcareous interlayers in typical wells and found that the number of calcareous interlayers generally ranges from 0 to 4. The cemented layers make up a greater total thickness than the noncemented layers and have an average thickness of 2.34 m. Many calcareous interlayers are thicker than 1 m, which can block oil and gas seepage, and accounted for 89% of the total. The thickest calcareous interlayers were approximately 5.9 m. The wells containing more calcareous interlayers are generally located in the northwest portion of the basin near the sediment source, and most of these wells contain more than two layers, whereas the wells in the southeast generally contain fewer than two layers. The calcareous interlayers distinctly thin to the southeast (Fig. 4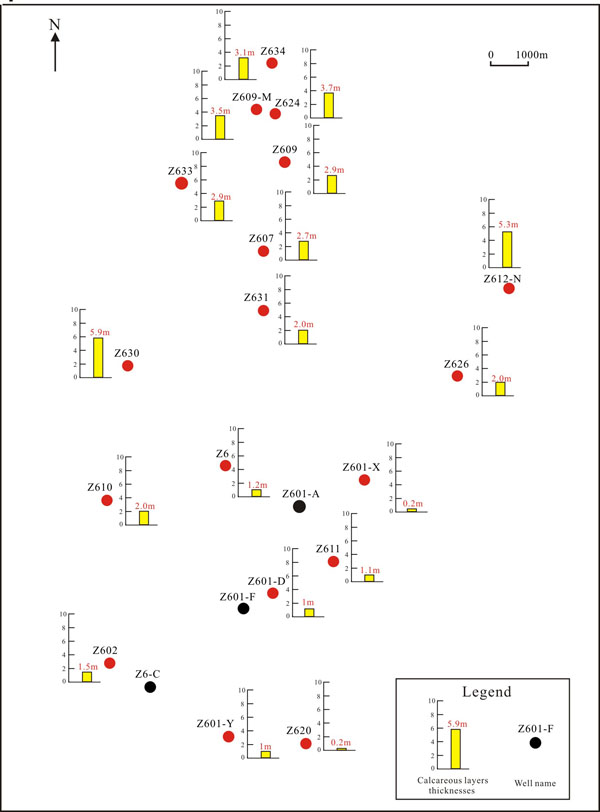 ). For example, the target layer in well Z601-X in the southeast contained no distinct calcite-cemented interval, whereas well Z624 layer, in the northwest, contained four layers: one approximately 1 m thick near the top, another approximately 1.5 m near the bottom, and 2 layers in the middle with thicknesses of 1 m and 0.2 m.
 |
Fig. (4) The calcareous interlayers cumulative thicknesses of typical Wells in Chunfeng Oilfield. |
3.1.3. Microstructure Characteristics
We selected 25 cored wells and 30 thin sections for observation and used alizarin red to dye the thin sections. The reservoir in the northwest is cemented primarily by calcium carbonate (calcite), and the sorting is generally poor. Point contacts or no contacts occur between the particles, which are cemented by calcite. The cementation types are primarily of the base type (calcareous cement >25%) and pore type (calcareous cement from 5% to 25%). Although the cementation is strong, other effects of diagenesis are weak, the compaction is weak, and quartz overgrowth phenomena are not distinct. Compared with the wells in the northwestern block, the quartz content in the southeastern well block is relatively high, the sorting is moderate, the particles are sub-rounded or rounded, and the cementation is relatively weak. Statistical results (Table 1) from rock structure analyses of the calcareous interlayers show that the cementation of the calcium cementation matrix (glutenite in the Sha-1 section) began before diagenetic consolidation, the consolidation period was early, and the degree of calcium cementation gradually decreases from northwest to southeast.

3.2. Quantitative Logging Method for Identification of Calcareous Interlayers
We used core data to calibrate the logging characteristics of the calcareous interlayers, and then used these logging characteristics to make predictions for other wells for which there are logging data but no core information. To identify the calcareous interlayers quantitatively, a more accurate identification method is needed, consisting of two main steps: performing a sensitivity analysis of the conventional well logging curves and developing identification criteria for calcareous interlayers.
 |
Fig. (5) Typical characteristic of the calcareous interlayers in well Z609-D. |
3.2.1. Sensitivity Analysis of Conventional Well Logging Curves in Calcareous Interlayers
The conventional well logging curves of the calcareous interlayers indicate that the spontaneous potential (SP) curve is near the shale line, the resistivity (RT) curve displays high values, the microelectrode logs (including the micronormal and microinverse logs, or MINO and MIN curves, respectively) display high values and no or little separation, the density (DEN) curve displays high values, and the acoustic (AC) curve clearly displays low values. In addition, the calcareous interlayers in the study area are characterized by high values on the gamma ray (GR) curve, and compared with other features, this log provides important clues for the analysis of calcium glutenite layers in the study area. For example, the shape of the electric log from well Z609-D shows typical identification marks (Fig. 5 ).
).
We selected 230 rock logging data points from 25 cored wells and generated response parameter cross-plots (Fig. 6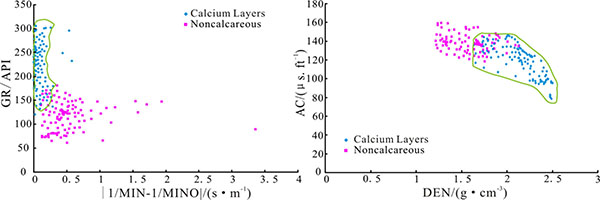 ). The five sensitive logging parameters for deriving the calcareous interlayer identification chart were ranked as follows from highest to lowest priority: GR, MIN, MINO, AC and DEN. The dividing line between the presence and absence of calcareous interlayers is clear; therefore, this chart can be used to identify calcareous interlayers. The characteristics for the identification logging parameters are listed below.
Green lines: rock point distribution range of calcareous interlayers
- GR The uranium content of the calcareous interlayers in the study area is clearly high and was likely caused by water movement from Zaire Mountain, which leads to a high GR curve (>140 API). In addition, this characteristic differs from the curve of the calcareous interlayers in other areas; therefore, it is a novel finding regarding the causes of calcareous interlayer barrier development.
- |1/MIN-1/MINO| Microelectrode curves mainly reflect the permeability of reservoirs [18R.H. Zinszer, "The use of electrode spacing in well logging", J. Pet. Technol., vol. 151, pp. 164-174, 2013.] because the permeability of the calcareous interlayer is poor, the micronormal and microinverse curves are high, and there is little to no separation; therefore, we can use the value of |1/MIN-1/MINO| to assess the permeability of the reservoir. The value of |1/MIN-1/MINO| for the calcareous interlayers is always less than 0.4.
- AC The acoustic time curve mainly reflects certain acoustic features such as speed, amplitude and frequency changes in various media. Calcium cementation phenomena are more serious because the lithology is pyknotic and hard, which causes sound waves to spread faster and reduces the acoustic travel time to less than 140 µs/ft.
- DEN The lithology density log reflects the rock volume density and is closely related to the lithologic composition. The calcareous interlayers contain primarily volcanic rock, and the texture of the rock is fine grained and typical of high-density rock, and the density generally exceeds 1.7 g/cm3.
 |
Fig. (6) Cross-plot identification chart of calcareous interlayers. |
3.2.2. Calcareous Interlayer Identification Function
To quantitatively identify calcareous interlayers and develop a calcareous interlayer identification index (CII), we selected the four parameters GR, |1/MIN-1/MINO|, AC and CNL to develop a normalized weighted calcareous interlayer identification function. First, we chose sensitive parameters for the min-max normalization to linearly convert the original data and ensure that the result was in the interval [0,1] to eliminate differences caused by the different numerical ranges. According to the sensitivity values of the parameters, we initialized all of the weights, calculated the value of the CII and automatic divided the calcareous interlayers. By repeatedly testing the weight assignment, we compared the dividing results and the core data to ultimately determine the best weights. Based on the calculation of CII values for different lithologies, when the CII value is greater than 0.46, the calcareous interlayer division effect is optimal, and the total accuracy can reach 82.7%. Thus, we set the CII value to >0.46 for the calcareous interlayer development section.
 |
(1) |
In Equation 1, X1 is the normalized value of DEN in g/cm3; X2 is the normalized value of GR in API; X3 is the normalized value of |1/MIN-1/MINO| in s/m; and X4 is the normalized acoustic wave velocity in ft/µs.
3.2.3. Applicability Analysis of Calcareous Interlayer Identification Function
A comparison of the cores indicated that using a multi-parameter normalized weighting method to identify calcareous interlayers yields a high identification rate. For example, in well Z624 (Fig. 7 ), 3.7 m calcareous interlayers are present in the Sha-1 section; therefore, we used the CII index method to correctly identify 3.3 m calcareous interlayers, and the accuracy rate reached 89.2%. We selected five inspection coring wells with a total calcareous interlayer thickness of 18.3 m, and our method was able to correctly identify a total interlayer thickness of 16.8 m; therefore, the accuracy was as high as 91.8% (Table 2), which meets the needs of typical research and production.

 |
Fig. (7) Identification parameters of the calcareous interlayers in well Z624. |
3.3. Trace-Element Analysis of Calcareous and Noncalcareous Layers
The calcareous interlayers in the study area yield high GR values that clearly differ from those in other areas, and these values are the most important clue for analyzing the calcareous interlayers in the study area. To explain this phenomenon, we analyzed for the trace elements in the calcareous interlayers and selectively analyzed the uranium content, which exerts a great influence on the GR curve.
Nine samples were selected to analyze for trace elements. This analysis was performed using an ELEMENT XR high-resolution inductively coupled plasma mass spectrometer housed at the Center of Forecasting and Analysis of the Beijing Research Institute of Uranium Geology. The working temperature was 20ºC, the working relative humidity was 30%, the instrument precision was better than 5%, and the relative errors between the sample measurements and recommended value were less than 10%. The trace-elements analyses included 44 elements, and 6 elements that are strongly associated with radioactivity and oxidation-reduction in the study area were selected for presentation in Table 3.

DISCUSSION
The 3 content ratios of Sr/Ba, Th/U and V/(V+Ni) can indicate the deposition environment (Table 2). According to the analyses, the Sr/Ba ratio exceeds 0.6, the Th/U ratio is between 0 and 2, and the V/(V+Ni) ratio exceeds 0.6, which all indicate that the deposition of the Shawan Formation occurred in a reducing environment. The radioactive elements include U and Th, and the uranium and thorium concentrations differ between the calcareous and noncalcareous interlayers. The thorium concentrations in the calcareous and noncalcareous interlayers are nearly the same: they are all 3.12-3.55×10⁻⁶. The uranium concentrations, however, are very different: more than 23.2×10⁻⁶ in the calcareous interlayers and less than 7.1×10⁻⁶ in the noncalcareous interlayers. Therefore, we can infer that the uranium content probably is due to the degree of calcareous cementation. According to the literature, uranium has unique geochemical characteristics, and under oxidizing conditions, uranium has a +6 valence charge that occurs in the form of UO2(CO3)3-4 and displays high solubility [19Q.Z. Gao, and Z.S. Li, "The analysis of the basic characteristics and genesis of sandstone type Uranium deposit in Xinjiang Shi Hongtan", Geol. Rev., vol. 48, pp. 430-435, 2002.]. The following uranium reduction reaction forms a solid oxide, produces many carbonate ions, and generates carbonization:
 |
According to hydrogeological data from the northwestern Junggar Basin [20S.R. Feng, "Hydro geological conditions of sandstone type uranium mineralization at the Northwestern Junggar basin", Xinjiang Geol., vol. 20, pp. 130-133, 2002.], the radioactive water chemistry was investigated at various times, and the results indicated that Zaire Mountain, which is near the northern part of the study area, has 5 uranium-anomaly areas (over 10×10-6) that present a large groundwater hydraulic gradient and strong runoff intensity. The rocks were strongly leached; therefore, Zaire Mountain is the most important infiltration area in the basin. A considerable amount of UO2(CO3)3-4 was transported by groundwater from various sources, and reduction reactions released a large amount of CO32- when the flow entered the target area, thereby providing favorable conditions for calcium cementation. From northwest to southeast, the degree of calcium cementation decreased with the decrease in uranium content.
Clearly, the high uranium content is an important cause of the presence of the calcareous interlayers. In a future step, we anticipate performing more detailed study of the calcareous interlayers, including the relative positions of the calcareous interlayers, sandstone and mudstone, to identify other possible origins of the calcareous interlayers. Nevertheless, the research on the relationship between uranium content and calcium cementation degree can provide guidance regarding the origin of the calcium cementation and provide a method for solving similar geological problems.
CONCLUSION
- Calcareous interlayers are widely distributed in the Sha-1 section, where the uranium content is 23.2-29×10-6 (average value of 27×10-6), which is clearly higher than the content in the noncalcareous interlayers. The uranium content increases along with the degree of calcium cementation, which indicates that uranium is beneficial to the development of the calcium cementation. Groundwater from Zaire Mountain transports a considerable amount of UO2(CO3)3-4, which causes a reduction reaction and produces great amounts of CO3-2 when the flow enters the study area and provides favorable conditions for calcium cementation.
- The GR, AC, DEN and microelectrode curves provide good indicators for identifying the calcareous interlayers. Using the logging identification chart and functions, we can rapidly and intuitively identify the calcareous interlayers in areas without cored wells and understand the distribution and evolution of the calcareous interlayers.
CONFLICT OF INTEREST
The authors confirm that this article content has no conflict of interest.
ACKNOWLEDGEMENTS
Declared none.
REFERENCES
| [1] | R.B. Han, Q. Liu, T.W. Jiang, H.M. Xu, Z.H. Xu, L. Zhao, C. Lei, and P.C. Zhang, "Feature, origin and distribution of calcareous interlayers: A case of Carboniferous Donghe sandstone in Hade Oil Field, Tarim Basin, NW China", Petro. Explor. Develop., vol. 41, pp. 428-436, 2014. [http://dx.doi.org/10.1016/S1876-3804(14)60054-9] |
| [2] | Y.F. Pi, X.S. Guo, Y.M. Pi, and P. Wu, "Experimental study of chemical flooding of Suizhong 36-1 Oilfield", Open Pet. Eng. J., vol. 8, pp. 392-397, 2015. [http://dx.doi.org/10.2174/1874834101508010392] |
| [3] | Z.B. Liu, H.H. Liu, and X.F. Ding, "Theoretical study of water saturation with percolation mechanics method", Open Pet. Eng. J., vol. 5, pp. 21-24, 2012. [http://dx.doi.org/10.2174/1874834101205010021] |
| [4] | A. Munnecke, and H. Westphal, "Variations in primary aragonite, calcite, and clay in fine-grained calcareous rhythmites of Cambrian to Jurassic age—an environmental archive?", Facies, vol. 51, pp. 592-607, 2005. [http://dx.doi.org/10.1007/s10347-005-0053-x] |
| [5] | D.R. Katti, S.R. Schmidt, P. Ghosh, and K.S. Katti, "Molecular modeling of the mechanical behavior and interactions in dry and slightly hydrated sodium montmorillonite interlayer", Can. Geotech. J., vol. 44, pp. 425-435, 2007. [http://dx.doi.org/10.1139/t06-127] |
| [6] | L.D. Gan, X.F. Dai, X. Zhang, L.G. Li, W.H. Du, X.H. Liu, Y.B. Gao, M.H. Lu, S.F. Ma, and Z.Y. Huang, "Key technologies for the seismic reservoir characterization of high water-cut oilfields", Petro. Explor. Develop., vol. 39, pp. 365-377, 2012. [http://dx.doi.org/10.1016/S1876-3804(12)60056-1] |
| [7] | Y. Wang, J. Liu, J.G. Wang, K.B. Shi, C. Wang, Y.J. Niu, G.Q. Shao, and B. Liu, "Major controlling factors for the formation of inter-layer of Donghe sandstone of Donghe1 reservoir in Tarim Basin and its fluid source", Acta Petrol. Sin., vol. 36, pp. 174-181, 2015. |
| [8] | X. Zheng, R. Liu, H. Duan, Y. Jiang, and W. Li, "Influence of reservoir interbed in Triassic lower oil group on residual oil distribution,Tahe Oil Field", Petrol. Geol. Exper., vol. 33, pp. 67-68, 2011. |
| [9] | J.J. Zhang, X.L. Zheng, L. Chen, and Y.W. Sun, "Effect of residual oil saturation on hydrodynamic properties of porous media", J. Hydrol. (Amst.), vol. 515, pp. 281-289, 2014. [http://dx.doi.org/10.1016/j.jhydrol.2014.04.067] |
| [10] | X.Z. Wang, J.Z. Wang, and M.Q. Qiao, "Horizontal well, nitrogen and viscosity reducer assisted steam huff and puff technology: Taking super heavy oil in shallow and thin beds, Chunfeng Oilfield, Junggar Basin,NW China, as an example", Petro. Explor. Develop., vol. 44, pp. 97-102, 2013. [http://dx.doi.org/10.1016/S1876-3804(13)60010-5]. |
| [11] | W.J. Xi, Z.H. Zhang, X.Y. Xu, and C.E. Shi, "Application of fluid inclusion techniques to the study of super-heavy oil accumulation in Chunfeng oilfield, Junggar Basin", Oil Gas Geol., vol. 35, pp. 350-358, 2014. |
| [12] | K. Yang, C.Q. Dong, and G.S. Xu, "Analysis of provenance and sedimentary facies of Neogene Shawan formation in Chepaizi Area", J. Chin. Univ. Petrol., vol. 36, pp. 7-19, 2012. |
| [13] | F. Song, S.C. Yang, N.N. Su, K. Xiang, and Y.F. Zhao, "New understanding of sedimentary facies of Shawan formation in Chunfeng Oilfield,Junggar Basin", Petrol. Geol. Exper., vol. 36, pp. 238-242, 2013. |
| [14] | K. Xiang, Y.F. Zhao, and J.F. Wang, "Stratigraphic division and correlation using various approaches-case of strati graphic correlation of heavy oil, Chunfeng oilfield,Junggar Basin", Petrol. Geol. Rec. Eff., vol. 18, pp. 1-5, 2011. |
| [15] | L.Q. Zhang, X.R. Xiao, H. Xiao, Y.M. Gao, and B.R. Tian, "Types and distribution of diagenetic alterations in the nearshore subaqueous fan of the upper ES4 in Shengtuo area of Dongying depression", Nat. Gas Geosci., vol. 26, pp. 13-19, 2015. |
| [16] | D.F. He, X.F. Chen, J. Kuang, L. Zhao, Y. Tang, and D.G. Liu, "Development and genetic mechanism of Chepaizi-Mosuowan uplift in Junggar Basin", Earth Sci. Front, vol. 15, pp. 42-55, 2008. [http://dx.doi.org/10.1016/S1872-5791(08)60038-X] |
| [17] | G.S. Qu, Z.J. Ma, N. Zhang, T. Li, and Y. Tian, "Fault structures in and around Junggar Basin", Xinjiang Petrol. Geol., vol. 29, pp. 290-295, 2008. |
| [18] | R.H. Zinszer, "The use of electrode spacing in well logging", J. Pet. Technol., vol. 151, pp. 164-174, 2013. |
| [19] | Q.Z. Gao, and Z.S. Li, "The analysis of the basic characteristics and genesis of sandstone type Uranium deposit in Xinjiang Shi Hongtan", Geol. Rev., vol. 48, pp. 430-435, 2002. |
| [20] | S.R. Feng, "Hydro geological conditions of sandstone type uranium mineralization at the Northwestern Junggar basin", Xinjiang Geol., vol. 20, pp. 130-133, 2002. |