- Home
- About Journals
-
Information for Authors/ReviewersEditorial Policies
Publication Fee
Publication Cycle - Process Flowchart
Online Manuscript Submission and Tracking System
Publishing Ethics and Rectitude
Authorship
Author Benefits
Reviewer Guidelines
Guest Editor Guidelines
Peer Review Workflow
Quick Track Option
Copyediting Services
Bentham Open Membership
Bentham Open Advisory Board
Archiving Policies
Fabricating and Stating False Information
Post Publication Discussions and Corrections
Editorial Management
Advertise With Us
Funding Agencies
Rate List
Kudos
General FAQs
Special Fee Waivers and Discounts
- Contact
- Help
- About Us
- Search


The Open Petroleum Engineering Journal
(Discontinued)
ISSN: 1874-8341 ― Volume 12, 2019
3D Reservoir Modeling of Triassic Yanchang Formation Chang 812 Layer in Honghe36 well area, Ordos Basin, China
Congjun Feng1, 2, 3, *, Mengsi Sun2, 3, Renhai Pu2, 3, Min Zhang2, 3, Daming Li2, 3
Abstract
Background:
Three-dimensional geological modeling of reservoirs is not only the key factor for reservoir description and prediction of oil reserves but also an important means of quantitative characterization of reservoir geometry and heterogeneity in three dimensional spaces. The aim of this paper is to establish prediction model for sandstone classification and reservoir petrophysical properties.
Methods:
Sand body prediction model was built by using stochastic simulation of discrete variables. Gauss model and sequential Gauss simulation method were selected to build porosity, permeability and oil saturation models.
Results:
The Chang 812 layer includes three sedimentary microfacies: distributary channel, inter-distributary bay and swamp. The dominant thickness of Chang 812 layer ranges from 15 to 20m. Three other classes of thickness (5-10 m, 10-15 m and 0-5 m) are subsequently less present. The major porosity of Chang 812 layer ranges from 5 to 15%, the major permeability ranges from 0.1 to 2×10⁻³μm2 and the major oil saturation ranges from 55 to 70%.
Conclusion:
The Chang 812 layer of Triassic Yanchang Formation mainly formed in braided delta plain depositional environment. The truncated Gauss simulation of sand body was applied in simulation. The thickness of the sand body is relatively greater than the porosity, permeability and oil saturation values.
Article Information

Identifiers and Pagination:
Year: 2017Volume: 10
First Page: 239
Last Page: 250
Publisher Id: TOPEJ-10-239
DOI: 10.2174/1874834101710010239
Article History:
Received Date: 13/03/2017Revision Received Date: 19/05/2017
Acceptance Date: 19/6/2017
Electronic publication date: 17/10/2017
Collection year: 2017
open-access license: This is an open access article distributed under the terms of the Creative Commons Attribution 4.0 International Public License (CC-BY 4.0), a copy of which is available at: https://creativecommons.org/licenses/by/4.0/legalcode. This license permits unrestricted use, distribution, and reproduction in any medium, provided the original author and source are credited.
* Address correspondence to this author at the Department of Geology, Northwest University, 229# Taibai Road, Department of Geology, Northwest University, Xi’an, Shaanxi, China, 710069, E-mails: fengcj@nwu.edu.cn; 119943028@qq.com
| Open Peer Review Details | |||
|---|---|---|---|
| Manuscript submitted on 13-03-2017 |
Original Manuscript | 3D Reservoir Modeling of Triassic Yanchang Formation Chang 812 Layer in Honghe36 well area, Ordos Basin, China | |
1. INTRODUCTION
Three-dimensional geological modeling of reservoirs is not only the key factor for reservoir description and prediction of oil reserves but also an important means of quantitative characterization of reservoir geometry and heterogeneity in three-dimensional space, its core is to predict volumetric distribution of reservoir parameters [1T. Wu, Y. Yang, and D.F. Wang, "Methods of Reservoir Modeling on Braided River Sandstones", Acta Sedimentologica Sinica, vol. 17, no. 2, pp. 258-262.-4L.B. Ouyang, "Assessing the needs to incorporate completion details in a petroleum reservoir simulation model", Open Petroleum Engineering Journal, vol. 8, pp. 16-28.
[http://dx.doi.org/10.2174/1874834101508010016] ]. Therefore, reservoir modeling represents the focus and hot issue in reservoir geology studies [5C.V. Deutsch, and T.T. Tran, "Fluvsim: A program for object-based stochastic modeling of fluvial depositional systems", Comput. Geosci., vol. 28, no. 4, pp. 525-535.
[http://dx.doi.org/10.1016/S0098-3004(01)00075-9] -8C.L. Zhang, D.Z. Liang, D.Y. Yin, and G.L. Song, "Productivity prediction model of vertical artificial fracture well and analysis of influence factor in low permeability reservoir", Open Petroleum Engineering Journal, vol. 8, pp. 420-426.
[http://dx.doi.org/10.2174/1874834101508010420] ]. Three-dimensional geological modeling of reservoir is a process of selecting the appropriate method to establish structure, sedimentary microfacies, sand body and reservoir parameters on the basis of core, well logging, seismic, and geological data. With the continuous development of geological modeling technology, the objective function [9X.H. Yu, J.Y. Chen, and Z.J. Zhang, "Stochastic modeling for characteristics of petroleum reservoir constrained by facies", Earth Sci. Front, vol. 12, no. 3, pp. 237-244.], variation function [10G.J. Wang, L.M. Zhao, W. Li, and G.L. Zhao, "Sensitivity of variogram in stoehastic modeling", Petroleum Exploration and Devlopment, vol. 32, no. 1, pp. 72-75., 11C.Y. Lin, S.Z. Chen, X.G. Zhang, W.J. Liu, and J.X. Shang, "Probability constraint method based on multiple trend integration and its application in reservoir modeling", Acta Petrol. Sin., vol. 36, no. 6, pp. 730-739.] and multi-point geological statistics [12W.J. Feng, S.H. Wu, S.L. Yin, S.Y. Shi, and J.L. Liu, "A vector information based multiple-point geostatistic method", J. Cent. South Univ., vol. 45, no. 4, pp. 1261-1268. [Science and Technology]., 13X.Y. Hu, X.C. Yuan, and J.G. Hou, "Modeling method of carbonate fracture-cavity reservoirs using multiscale karst facies-controlling", Acta Petrol. Sin., vol. 35, no. 2, pp. 340-346.] and other mathematical methods have been widely applied in reservoir modeling, which greatly promoted the development and technology of three-dimensional geological modeling. Reservoir modeling throughout the whole process of oil exploration and development helps developing geological understanding by applying a variety of modeling techniques and methods [14J.L. Liu, "Reservoir modeling of Che-2 well-block in the Junggar Basin", Oil & Gas Geology, vol. 29, no. 4, pp. 537-542., 15J.Y. Chen, C.B. Tian, X.M. Zhou, and H. Wang, "Sedimentary microfacies studies and reservoir modeling by integration of multiple seismic attributes", Oil Geophysical Prospecting, vol. 46, no. 1, pp. 98-102.].
The Chang 8 formation is one of the main oil-bearing reservoir formations, its deposition environment is braided delta sedimentary system in the study area. To analyze the distribution of sand body in current area, this study using core, log, and geologic data, established the sandstone classification prediction model, reservoir properties prediction model of porosity, permeability and oil saturation based on the analysis of sedimentary microfacies and the classification statistics method of development well sand body thickness of Yanchang Formation Chang 812 layer in Honghe 36 well area, Ordos Basin, China, in order to provide reference model for oil reserves prediction in the study area and development of reservoir parameter modeling on similar areas.
2. GEOLOGIC SETTING
Ordos Basin, a large petroliferous sedimentary basin, is located in the Midwest of China, an area of about 25×104 km2, which is a composite craton basin with multi-tectonic systems, multi-evolution stages, multi-sedimentary systems and multi-prototype basin Fig. (1a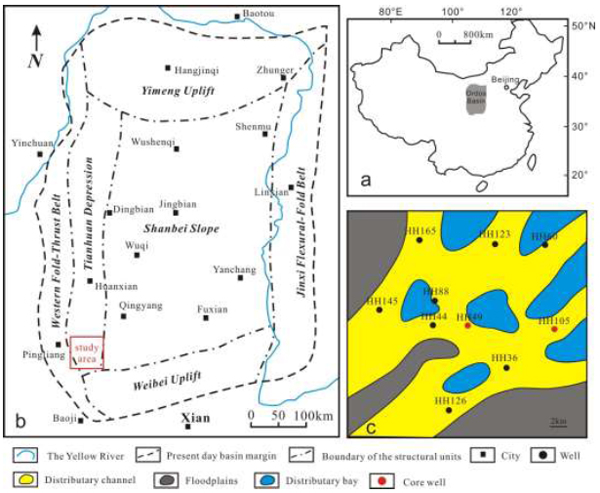 ) [16J.H. Fu, Z.Q. Guo, and X.Q. Deng, "Sedimentary facies of the Yanchang Formation of Upper Triassic and petroleum geological implication in southwestern Ordos Basin", Journal of Palaeogeography, vol. 7, no. 1, pp. 34-43.]. The basin consists of six tectonic units of Yimeng uplift, Jinxi flexural-fold belt, western fold-thrust belt, Shanbei Slope and Tianhuan depression and Weibei uplift Fig. (1b). The Triassic Yanchang formation is one of the most important oil and gas bearing series in the basin. The sedimentary environment for this formation includes braided river, meandering river, delta, semi deep lake - deep lake sedimentary strata that are named from the bottom to the top as Chang 10 to Chang 1, and bear in total 10 oil groups.
The Chang 7 formation is composed of oil shale, mudstone and fine sandstone (Fig. 2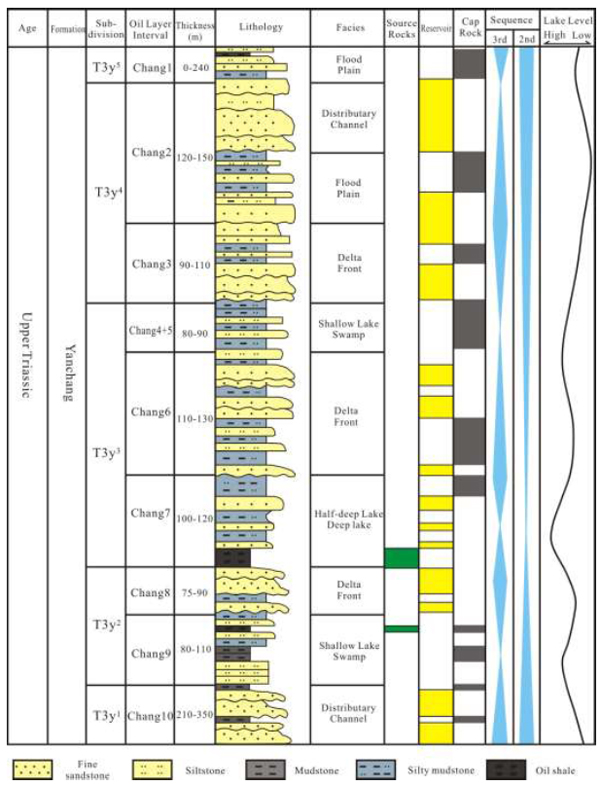 ) [17H. Yang, W.T. Dou, X.Y. Liu, and C.L. Zhang, "Analysis on sedimentary facies of member 7 in Yangchang Formation of Triassic in Ordos Basin", Acta Sedmentologica Sinica, vol. 28, no. 2, pp. 254-262.]. Formation thickness ranges from 100 to 120 meters, the thickness of oil shale ranges from 30 to 60 meters, and it is the main hydrocarbon source rocks in the Ordos Basin. Locally, turbidite sandstone and black mudstone are present. The deposition environment of Chang 7 formation is deep water settings.
 |
Fig. (1) Location of the study area. (a) Map of the China. (b) Map of the Ordos Basin. (c) Facies and well location used in the study area. |
The Chang 7 formation is composed of mainly grey fine sandstone, and grey silty mudstone (Fig. 2). Formation thickness ranges from 75 to 90 meters in the areas. Porosity of Chang 8 reservoir ranges from 1 to 15% and permeability ranges from 0.01 to 2×10⁻³μm2, which represent a typical low porosity and ultra low permeability sandstone reservoirs. Chang 8 reservoir group includes Chang 81 and 82 two sand groups. The Chang 81 sand group from bottom to top is subdivided into Chang 813, Chang812 and Chang 811 three thin layers. The deposition environment of Chang 8 formation is the main braided delta sedimentary system (Fig. 1c) in the study area.
The source rocks in the Yangchang Formation are present in the Chang 7 and Chang 9 members. The source rocks are represented by lacustrine shales (Fig. 2). The reservoir units in Yangchang Formation are distributed from Chang 10 to Chang 2, and composed of sandstone (Fig. 2). The cap rock is formed by mudstone. One oil and gas migration paths are formed by Chang 7 and Chang 9 up to Chang 2 and another is formed by Chang 7 and Chang 9 down to Chang 10 (Fig. 2). The Yangchang Formation is characterized by monocline structure dipping from west to east, the eastern area being higher than western one; trap type is mainly stratigraphic.
 |
Fig. (2) Stratigraphic subdivisions of the Yanchang Formation in the southwestern part of the Ordos Basin. |
3. METHODOLOGY
The study area is located in the southwestern Ordos Basin, where 10 wells have been drilled by the Huabei Oil-field Company (Fig. 1c). Well data include well logging data, core analysis data and core photos. Wireline Well logging data (10 wells) involve curves of natural gamma ray, spontaneous potential, bulk density, acoustic and resistivity recorded in the Yanchang formation. Core analysis data from HH49 and HH105 well include porosity, permeability and oil saturation, the measurements obtained interval of HH49 well ranges from 2249 to 2262 meters and HH105 ranges from 2270 to 2283meters in Chang812 reservoir formations, these data are provided by Sinopec, Huabei Oilfield. Core photos were taken in HH105 and HH49 wells. By analysing these data, it was possible to identify sand bodies and interpret porosity, permeability and oil saturation, required for reservoir geology modeling.
Seismic interpretation of 3D seismic reflection survey data has been carried out to identify faults and horizons and build structural model.
Sand body prediction model was built by using stochastic simulation of discrete variables. Gauss model and sequential Gauss simulation method were selected to built porosity, permeability and oil saturation models.
4. RESULTS
The analysis of well log and core data helped to characterize reservoir unit Chang 812 of the Triassic Yangchang Formation.
4.1. Sedimentary Microfacies
4.1.1. Sedimentary Structures
The sedimentary structures of fine sandstone of Chang 812 layer mainly include parallel bedding Fig. (3a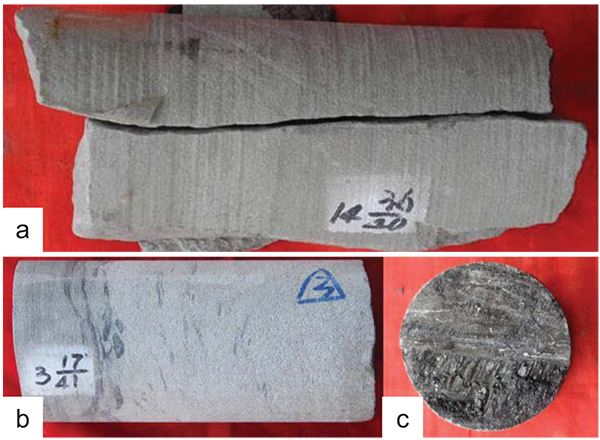 ), trough cross bedding (Fig. 3b), which with mud gravel deposition and scour surface in bottom Fig. (3b), reflect a strong hydrodynamic conditions of shallow water flow. Erosion surface is a typical evidence of channel sediment. Main sedimentary characteristic of mudstone is a horizontal lamination, inter-distributary bay and swamp. Plant stems, leaves and impression are common in silty mudstone or mudstone of Chang 812 layer and the fine sandstone intercalate thin coal or carbonaceous shale (Fig. 3c), reflecting a low-water level depositional environment as floodplain or swamp.
4.1.2. Types of Sedimentary Microfacies
The Chang 812 layer was formed under settings of braided delta plain. It includes 3 microfacies types of distributary channel, inter-distributary bay and swamp. (1) Distributary channel microfacies are mainly composed of fine sandstone. Rocks are characterized by parallel bedding and cross bedding. Mud gravel deposition and erosion surface are common at the bottom of sand bodies. Main logging curves are dentate bell or dentate box. (2) Inter-distributary bay microfacies are composed of yellow green, purplish red mudstones with horizontal lamination. The logging curve is low amplitude and straight. (3) Swamp microfacies are composed of argillaceous siltstone, silty mudstone, partly carbonaceous shale and coal line. The logging curve often is jagged features.
(Fig. 3) Core photos demonstrating sedimentary characteristics of rocks. (a) HH105 well, Chang 812, 2262 meters, fine sandstone of parallel bedding, high-angle fracture. (b) HH49 well, Chang812, 2283 meters, mud gravel at the bottom of the sandstone, erosion surface. (c) HH105 well, Chang 812, 2259 meters, fine sandstone with coal line.

4.1.3. Plane Distribution Characteristics of Sand Body
The Chang 812 layer is distinguished in the southwestern steep slope belt, and it is mainly characterized by two large-scale distributary channels in the study area, representing a typical braided delta plain depositionary environments. Thickness of sand body varies from 6m in Honghe88 and Honghe60 wells to 25m, in Honghe44 well. The drilling rate for the sand body units decreases to 90% or more, as thickness of the layer is over 4 m. Sedimentary microfacies mainly are related to distributary channel. Sand body is characterized by numerically irregular geometry distribution, typical for inter-distributary bay and swamp deposits (Fig. 1c).
4.2. Features of Reservoir Property
Based on a statistical analysis carried out for 10 wells in the study area (Fig. 1c), the sand body thickness in the Chang 8 member ranges from 2 to 20m, with 5–10m and 10–15m thicknesses being dominant values (Fig. 4a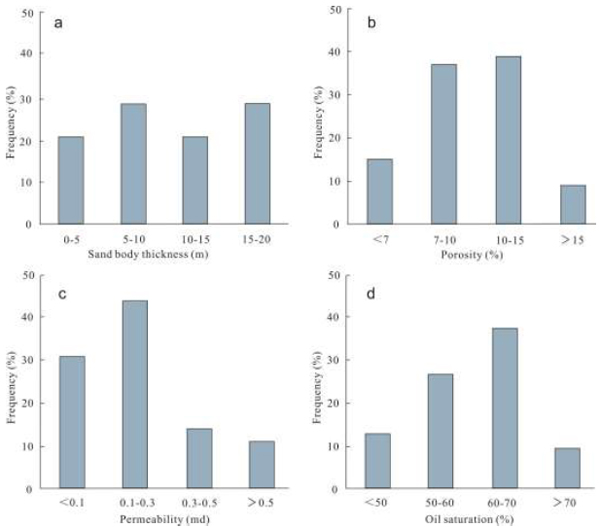 ). Based on a statistical analysis of 208 core samples from 4 wells in the study area, the porosity of sandstone reservoir in the Chang 8 member ranges from 1 to 15%, 7 to15% being the dominant value (Fig. 4b). The permeability of sandstone reservoir in the Chang 8 member varies in range from 0.01 to 1.2×10⁻³μm2, with 0.1–0.3×10⁻³μm2 being the dominant vales (Fig. 4c). The oil saturation of sandstone reservoir in the Chang 8 member is in the range of 35–75%, with 60–70% being the dominant range (Fig. 4d).

4.3. Reservoir Geology Modeling
The reservoir geological modeling was carried out to establish an attribute model reflecting the characteristics of subsurface reservoir (sand body, porosity, permeability and oil saturation) spatial distribution. Attribute model should be calibrated with results of core analysis data [18J.H. Wang, "Greeting the great development of theories and applications of reservoir modeling", Earth Science Frontiers, vol. 15, no. 1, pp. 016-025., 19P.Y. Chen, H.T. Yang, X.L. Liu, X.B. Zhong, and X.T. Yang, "3D Modeling of Vug Carbonate Reservoir in the Sixth-Seventh Blocks of Tahe Oilfield, Tarim Basin", Dizhi Lunping, vol. 60, no. 4, pp. 884-892.]. The conventionally deterministic modeling method with a few points interpolating may poorly reflect space change of the parameters of sand body, porosity, permeability, oil saturation, and heterogeneity and anisotropy of the distribution of subsurface reservoir. The geostatistics and stochastic simulation methods help to quantitatively describe spatial distribution of reservoir properties.
4.3.1. Grid Design
Grid size determination plays an important role in the resolution and size of the model, well spacing density, reservoir lateral and vertical heterogeneity, resolution of thickness of a single layer; well data, sampling density and other factors should be considered. The grid size and number of cells determine time necessary for running reservoir simulation.
In the model of 600 m in lateral direction the grid cells were set 30 m x 30 m, that corresponds to 20 cells along X and Y axes. As thickness of most of the layers ranges from 5 to 8m, the vertical thickness of horizons in the grid was set 1 m. Therefore, the grid cell is 30m×30m×1m.
4.3.2. Building Structural Model
The structural model was built in two steps, including interpretation of faults and horizons. In the study area, 15 large-scale faults have been identified.
Layer model is based on seismic interpretation of horizons and taking into consideration well tops data, spatial distribution of faults. Structural maps of each layer were built using kriging interpolation method.
Structure of Chang 812 layer represents a monocline affected by faults with a structural framework of three nearly east-west nasal convex clamp and two nose concaves.
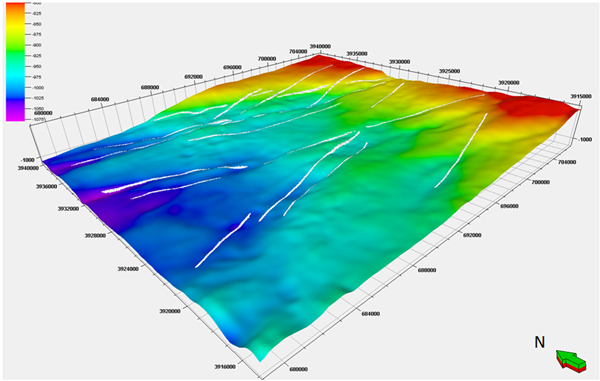 |
Fig. (5) Structure map of the top of Chang 812 layer in Honghe36 well area. |
4.3.3. Sand Bodies Modeling
Thickness of sand bodies varies depending on the width of channels, according to statistical classification method of thickness of a single sand body. Corresponding variograms are set for different types of thickness of sand bodies, and then used to more accurately predict interwell distribution characteristics of sand bodies. Based on a single well logging interpretation of sand bodies, thickness of sand bodies are statistically determined in accordance with the classification method of the single sand body and divided into ranges of thicknesses of 0 to 5m, 5 to 10m, 10 to 15m, 15 to 20m. Sand data, a discrete variable, have certain physical characteristics and geological distribution, so the sand body prediction between wells is stochastic simulation of discrete variables [20J.F. Xue, J.H. Wang, X.J. Zu, G.X. Xi, and B.F. Chen, "Multi-stochastical realization of reservoir modeling and conformation rate of sandbody prediction", Acta Petrol. Sin., vol. 24, no. 5, pp. 79-83.].
According to the sand data characteristics of the Honghe36 well area, combined with the applicability of different stochastic simulation method, the distribution of selecting the truncated Gauss simulation of the reservoir sand body is simulated.
To build a sandstone skeleton model by grid processing, the sand grid ranging from 0 to 5m and the color is green, the assignment is 1; ranging from 5 to 10m and the color is yellow, the assignment is 2; when ranging from 10 to 15m and the color is orange, the assignment is 3; when ranging from 15 to 20m and the color is red, the assignment is 4; when the color of mudstone grid is blue, and the assignment is 0. The model is based on sandstone skeleton mode, using the truncated Gaussian simulation to establish sand body model of Chang 812 of Yanchang formation (Fig. 6b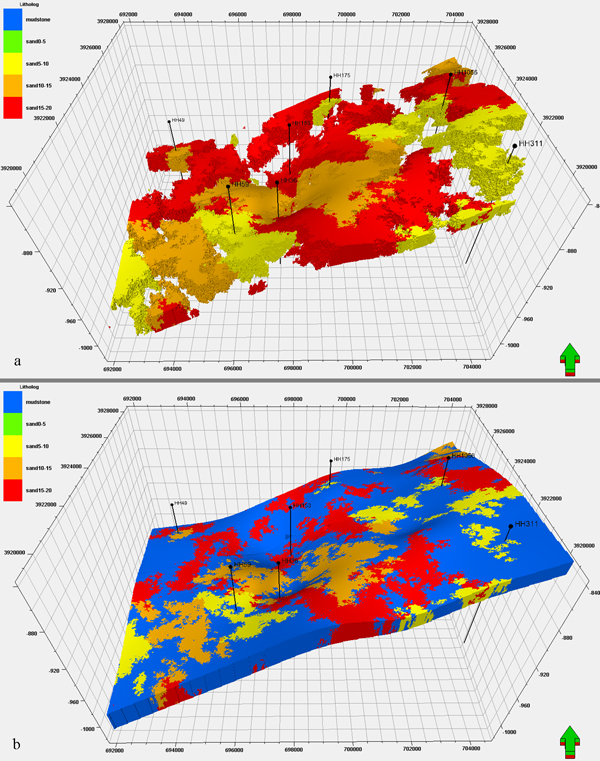 ).
).
 |
Fig. (6) Sandstone classification and model of sand body thickness distribution of Chang 812 in Honghe36 well area: (a) Mudstone is not shown; (b) Mudstone is shown. |
It was found that the main thickness of Chang 812 layer ranges dominantly from 15 to 20m. Second range is from 5 to 10m, while range from 10 to 15m was not dominant, and a range from 0 to 5m-thick sand bodies is the less dominant in the study area (Fig. 6a).
4.3.4. Porosity Modeling
The sequential Gauss simulation method is applied to simulate the porosity continuous distribution of Chang 812 layer. This method is rapid, simple and suitable for the simulation of reservoir attribute parameters of intermediate values; distributed continuous and extreme values [21X.H. Yu, "A review of development course and prospect of petroleum reservoir characterization and stochastic modeling", Earth Sci. Front, vol. 15, no. 1, pp. 1-15.]. In stochastic modeling process, variogram is a core parameter, different variogram models with variable length, and the results of the simulation are also different. By multiple comparison test of different variogram model can find that using Gauss model simulate porosity is closer to the actual geological conditions, so select Gauss model and sequential Gauss simulation method to establish the study area porosity model (Fig. 6b).
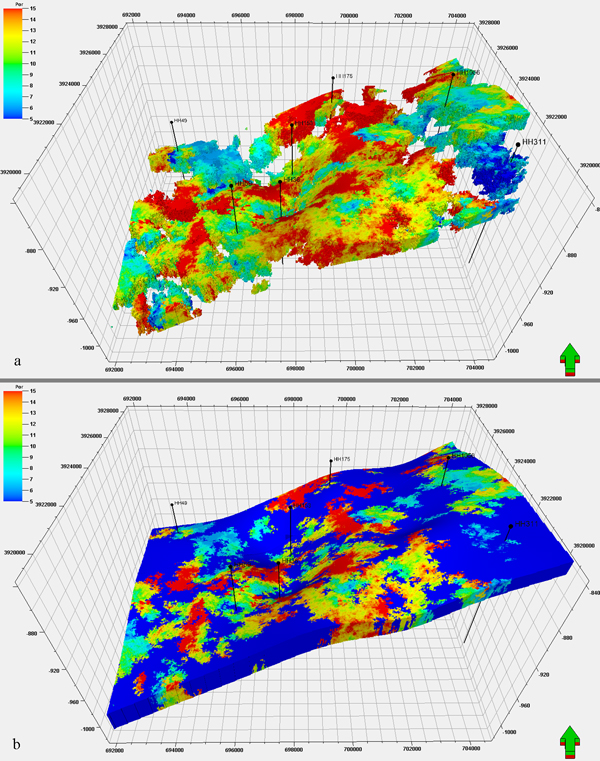 |
Fig. (7) Porosity distribution model of Chang 812 in Honghe36 well area (a) Mudstone is not shown; (b) Mudstone is shown. |
It was found that porosity of Chang 812 layer is mainly distributed with a range from 5 to 15%. For the layer thickness more than 10m of sand body, porosity values are greater than 10%, in the vicinity of the Honghe49 well area. For the sandstones with thickness more than 15m, porosity values less than 8%. The sand body of higher thickness is characterized by relatively greater the porosity values (Figs. 5a , 7a
, 7a ).
).
4.3.5. Permeability Modeling
Permeability modeling method based on the sequential Gauss simulation method coupled with constraint of porosity (Fig. 8b ).
).
It was found that permeability of Chang 812 layer is mainly distributed with the range from 0.1 to 2×10⁻³μm2. For the sand body thickness more than 10m, permeability values are greater than 0.1×10⁻³μm2, in the vicinity of the Honghe311 well area. For the sandstones thickness from 5 to 10m, permeability values are less than 0.1×10⁻³μm2. The larger the porosity value, the relatively greater the permeability value is (Figs. 7a, 8a).
 |
Fig. (8) Permeability distribution model of Chang 812 in Honghe36 well area (a) Mudstone is not shown; (b) Mudstone is shown. |
4.3.6. Oil Saturation Modeling
Oil saturation model method is based on the sequential Gauss simulation method (Fig. 9b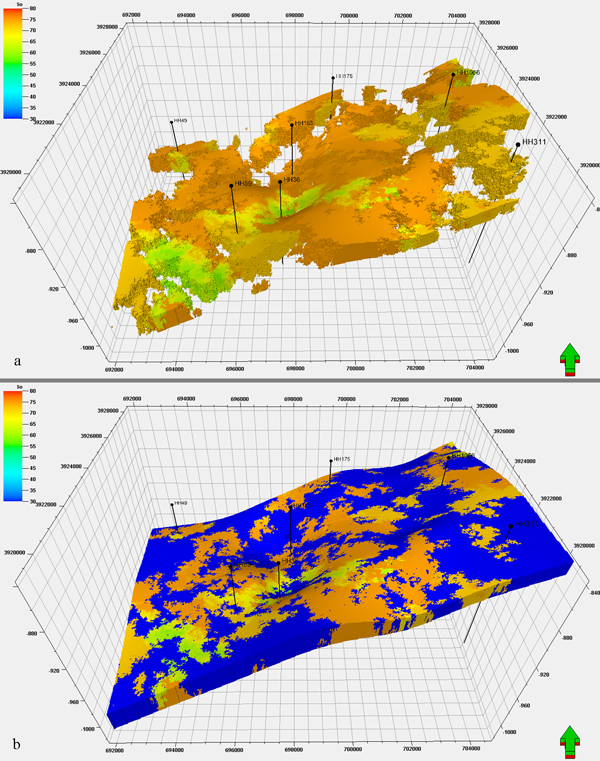 ). It was found that oil saturation of Chang 812 layer is mainly distributed with a range from 55 to 70%. For sand body thickness more than 10m, porosity is higher than 10% and oil saturation is higher than 65%. In the southwest of the study area, sandstones thickness ranges from 5 to 15m, and porosity values range from 7 to 12%, oil saturation values are lower less than 55%. The larger the porosity value is, the relatively greater is the oil saturation value (Figs. 7a, 9a).
 |
Fig. (9) Oil saturation distribution model of Chang 812 in Honghe36 well area (a) Mudstone not shown;(b) Mudstone is shown. |
CONCLUSION
(1) The results of our study show that the Chang 812 layer of Triassic Yanchang Formation mainly formed in braided delta plain depositional environment and it includes three main sedimentary microfacies: distributary channel, inter-distributary bay and swamp. The distributary channel microfacies are mainly composed of fine sandstones with parallel- and cross-bedding. Mud gravel and erosion surface are common for the bottom of distributary channel deposits. The inter-distributary bay microfacies are mainly composed of yellow green, purplish red mudstones with horizontal bedding. The swamp microfacies are represented by argillaceous siltstone or silty mudstone, partly with carbonaceous shale and coal line.
(2) Based on single well logging interpretation of sand body, thickness of sand body is statistically divided in accordance with the classification method of the single sand body thickness into 4 classes of 0 to 5m, 5 to 10m, 10 to 15m, 15 to 20m. The truncated Gauss simulation of sand body was applied in simulation. Thickness of Chang 812 layer ranging from 15 to 20m has the largest overall distribution in the study area. Other classes of sand body thickness ranging from 5 to 10m, from 10 to 15m, and from 0 to 5m are subsequently less distributed in the study area.
(3) The porosity, permeability and oil saturation modeling were carried out by applying Gauss model and sequential Gauss simulation method. It was found that the major porosity of Chang 812 layer ranges from 5 to 15%, the major permeability ranges from 0.1 to 2×10⁻³μm2 and the major oil saturation ranges from 55 to 70%. The larger the thickness of the sand body is, the relatively greater are the porosity, permeability and oil saturation values.
CONSENT FOR PUBLICATION
Not applicable.
CONFLICT OF INTEREST
The authors declare no conflict of interest, financial or otherwise.
ACKNOWLEDGEMENTS
This work was financially supported by Opening Foundation of Shaanxi Key Laboratory of Exploration and Comprehensive Utilization of Mineral Resources; Shaanxi Provincial Key Laboratory of the Ministry of Education (14JS084).
REFERENCES
| [1] | T. Wu, Y. Yang, and D.F. Wang, "Methods of Reservoir Modeling on Braided River Sandstones", Acta Sedimentologica Sinica, vol. 17, no. 2, pp. 258-262. |
| [2] | C. Calvert, L. Foreman, and T.T. Yao, "Spectral component geplogic modeling: a novel approach for intergrating seismic data into geologic models", Leading Edge (Tulsa Okla.), vol. 23, no. 5, pp. 466-470. [http://dx.doi.org/10.1190/1.1756836] |
| [3] | Y. Zhao, J.B. Li, J. Zhang, and Q. Zhang, "Methodology for geologic modeling of low-permeability fluvial sandstone reservoirs and its application: A case study of the Su-6 infilling drilling pilot in the Sulige Gas Field", Nature Gas Industry, vol. 30, no. 7, pp. 32-35. |
| [4] | L.B. Ouyang, "Assessing the needs to incorporate completion details in a petroleum reservoir simulation model", Open Petroleum Engineering Journal, vol. 8, pp. 16-28. [http://dx.doi.org/10.2174/1874834101508010016] |
| [5] | C.V. Deutsch, and T.T. Tran, "Fluvsim: A program for object-based stochastic modeling of fluvial depositional systems", Comput. Geosci., vol. 28, no. 4, pp. 525-535. [http://dx.doi.org/10.1016/S0098-3004(01)00075-9] |
| [6] | Y.S. Yin, C.G. Zhang, and S.H. Li, "A new stochastic modeling method for 3D forecasting lateral accretion beddings of point bars in meandering rivers", Acta Petrol. Sin., vol. 32, no. 2, pp. 315-319. |
| [7] | N. Orellana, J. Cavero, and I. Yemez, "Influence of variograms in 3D reservoir modeling outcomes: An example", Leading Edge (Tulsa Okla.), vol. 33, no. 8, pp. 890-902. [http://dx.doi.org/10.1190/tle33080890.1] |
| [8] | C.L. Zhang, D.Z. Liang, D.Y. Yin, and G.L. Song, "Productivity prediction model of vertical artificial fracture well and analysis of influence factor in low permeability reservoir", Open Petroleum Engineering Journal, vol. 8, pp. 420-426. [http://dx.doi.org/10.2174/1874834101508010420] |
| [9] | X.H. Yu, J.Y. Chen, and Z.J. Zhang, "Stochastic modeling for characteristics of petroleum reservoir constrained by facies", Earth Sci. Front, vol. 12, no. 3, pp. 237-244. |
| [10] | G.J. Wang, L.M. Zhao, W. Li, and G.L. Zhao, "Sensitivity of variogram in stoehastic modeling", Petroleum Exploration and Devlopment, vol. 32, no. 1, pp. 72-75. |
| [11] | C.Y. Lin, S.Z. Chen, X.G. Zhang, W.J. Liu, and J.X. Shang, "Probability constraint method based on multiple trend integration and its application in reservoir modeling", Acta Petrol. Sin., vol. 36, no. 6, pp. 730-739. |
| [12] | W.J. Feng, S.H. Wu, S.L. Yin, S.Y. Shi, and J.L. Liu, "A vector information based multiple-point geostatistic method", J. Cent. South Univ., vol. 45, no. 4, pp. 1261-1268. [Science and Technology]. |
| [13] | X.Y. Hu, X.C. Yuan, and J.G. Hou, "Modeling method of carbonate fracture-cavity reservoirs using multiscale karst facies-controlling", Acta Petrol. Sin., vol. 35, no. 2, pp. 340-346. |
| [14] | J.L. Liu, "Reservoir modeling of Che-2 well-block in the Junggar Basin", Oil & Gas Geology, vol. 29, no. 4, pp. 537-542. |
| [15] | J.Y. Chen, C.B. Tian, X.M. Zhou, and H. Wang, "Sedimentary microfacies studies and reservoir modeling by integration of multiple seismic attributes", Oil Geophysical Prospecting, vol. 46, no. 1, pp. 98-102. |
| [16] | J.H. Fu, Z.Q. Guo, and X.Q. Deng, "Sedimentary facies of the Yanchang Formation of Upper Triassic and petroleum geological implication in southwestern Ordos Basin", Journal of Palaeogeography, vol. 7, no. 1, pp. 34-43. |
| [17] | H. Yang, W.T. Dou, X.Y. Liu, and C.L. Zhang, "Analysis on sedimentary facies of member 7 in Yangchang Formation of Triassic in Ordos Basin", Acta Sedmentologica Sinica, vol. 28, no. 2, pp. 254-262. |
| [18] | J.H. Wang, "Greeting the great development of theories and applications of reservoir modeling", Earth Science Frontiers, vol. 15, no. 1, pp. 016-025. |
| [19] | P.Y. Chen, H.T. Yang, X.L. Liu, X.B. Zhong, and X.T. Yang, "3D Modeling of Vug Carbonate Reservoir in the Sixth-Seventh Blocks of Tahe Oilfield, Tarim Basin", Dizhi Lunping, vol. 60, no. 4, pp. 884-892. |
| [20] | J.F. Xue, J.H. Wang, X.J. Zu, G.X. Xi, and B.F. Chen, "Multi-stochastical realization of reservoir modeling and conformation rate of sandbody prediction", Acta Petrol. Sin., vol. 24, no. 5, pp. 79-83. |
| [21] | X.H. Yu, "A review of development course and prospect of petroleum reservoir characterization and stochastic modeling", Earth Sci. Front, vol. 15, no. 1, pp. 1-15. |