- Home
- About Journals
-
Information for Authors/ReviewersEditorial Policies
Publication Fee
Publication Cycle - Process Flowchart
Online Manuscript Submission and Tracking System
Publishing Ethics and Rectitude
Authorship
Author Benefits
Reviewer Guidelines
Guest Editor Guidelines
Peer Review Workflow
Quick Track Option
Copyediting Services
Bentham Open Membership
Bentham Open Advisory Board
Archiving Policies
Fabricating and Stating False Information
Post Publication Discussions and Corrections
Editorial Management
Advertise With Us
Funding Agencies
Rate List
Kudos
General FAQs
Special Fee Waivers and Discounts
- Contact
- Help
- About Us
- Search


The Open Atmospheric Science Journal
(Discontinued)
ISSN: 1874-2823 ― Volume 14, 2020
MODIS Summer SUHI Cross-sections Anomalies over the Megacities of the Monsoon Asia Region and Global Trends
Hofit Itzhak-Ben-Shalom1, *, Pinhas Alpert2, Oded Potchter3, 4, Rana Samuels2
Abstract
Background:
Evidence has accumulated in recent years regarding the scope of local and global climate changes attributed to exacerbating anthropogenic factors such as accelerating population growth, urbanization, industrialization, traffic and energy use. Remote space monitoring, unlike ground-based measurements, has the advantage of providing global coverage on a daily basis.
Methods:
MODIS (Moderate Resolution Imaging Spectroradiometer) Aqua and Terra 1°×1° spatial resolution as well as the 1 km higher resolution of Aqua-MODIS were investigated for a global overview of megacities temperature variations, as well as the recent trends of the 10 largest Monsoon Asian megacities.
Results:
The average Land Surface Temperature (LST) cross-sections of the 10 Asian megacities were examined for June-August 2002-2014. Temperature variations fit a spatial bell-shaped curve, with a pronounced maximum over the city center. Nighttime data indicated sharp LST decreases with distance from the city center, particularly in the coldest cities, those of Tokyo, Seoul, Osaka and Beijing.
Conclusion:
Daytime latitudinal (E-W) and longitudinal (N-S) Surface Urban Heat Islands (SUHI) have steeper gradients than for nighttime data. During daytime, the SUHI gradients are largest in Tokyo, Seoul, Osaka and Beijing with values reaching 15oC followed by the cities of Shanghai and Guangzhou with ~11oC, and Karachi with ~5oC SUHI. Nighttime SUHIs were more moderate, 4-6oC in Tokyo, Seoul ~5oC, Osaka 5-7oC and Beijing ~7oC. Only in the three largest megacities, i.e., Tokyo, Guangzhou and Shanghai, did the nighttime LST trends decline.
Article Information

Identifiers and Pagination:
Year: 2017Volume: 11
First Page: 121
Last Page: 136
Publisher Id: TOASCJ-11-121
DOI: 10.2174/1874282301711010121
Article History:
Received Date: 16/8/2017Revision Received Date: 21/08/2017
Acceptance Date: 02/10/2017
Electronic publication date: 31/10/2017
Collection year: 2017
open-access license: This is an open access article distributed under the terms of the Creative Commons Attribution 4.0 International Public License (CC-BY 4.0), a copy of which is available at: https://creativecommons.org/licenses/by/4.0/legalcode. This license permits unrestricted use, distribution, and reproduction in any medium, provided the original author and source are credited.
* Address correspondence to this author at the The Porter School of Environmental Studies, Tel Aviv University 69978, Tel Aviv, Israel, Tel: 972-524-550040; E-mail: hofitben@gmail.com
| Open Peer Review Details | |||
|---|---|---|---|
| Manuscript submitted on 16-8-2017 |
Original Manuscript | MODIS Summer SUHI Cross-sections Anomalies over the Megacities of the Monsoon Asia Region and Global Trends | |
1. INTRODUCTION
50% of the world's population now lives in cities, with this percentage projected to increase [1United Nations, Department of Economic and Social Affairs, Population Division. World Population Prospects 2010.]. Urban areas with populations exceeding 10 million inhabitants are known as megacities; and such large concentrated populations have been identified as a major environmental issue, especially in developing countries [2Molina MJ, Molina LT. Megacities and atmospheric pollution. J Air Waste Manag Assoc 2004; 54(6): 644-80.
[http://dx.doi.org/10.1080/10473289.2004.10470936] [PMID: 15242147] ]. Although cities occupy a small fraction of land, amounting to only 2.8 per cent of the Earth’s land area [3United Nations Population Fund (UNFPA). Growing up urban 2007.], they are considered to have indirectly triggered global climate change due to their insatiable appetite for energy and materials [4Solomon S, Ed. Climate change: The physical science basis 2007.]. Alpert et al. [5Alpert P, Shvainshtein O, Kishcha P. AOD trends over megacities based on space monitoring using MODIS and MISR. AJJC 2012; 1(03): 117-31.], for instance, found that in megacities, which tend to have high levels of aerosol emissions, the Aerosol Optical Depth (AOD) indicates significantly increasing levels of anthropogenic pollution. Furthermore, rapidly expanding cities, as major consumers of energy and materials, have deteriorating air quality, as population, traffic, energy use, and industrialization grow [2Molina MJ, Molina LT. Megacities and atmospheric pollution. J Air Waste Manag Assoc 2004; 54(6): 644-80.
[http://dx.doi.org/10.1080/10473289.2004.10470936] [PMID: 15242147] , 6Dhorde A, Dhorde A, Gadgil AS. Long-term temperature trends at four largest cities of India during the twentieth century. J Indian Geophys Unio 2009; 13(2): 85-97., 7Mage D, Ozolins G, Peterson P, et al. Urban air pollution in megacities of the world. Atmos Environ 1996; 30(5): 681-6.
[http://dx.doi.org/10.1016/1352-2310(95)00219-7] ]. Fossil fuels are consumed due to large vehicular populations. Given their very high population densities and high-rise buildings, cities also absorb a greater amount of solar radiation. Seven of the 10 most populous countries in the world − China, India, Indonesia, Russia, Pakistan, Bangladesh and Japan − are located in Asia [8ADB (Asian Development Bank). Key Indicators http://www.adb.org 2002.].
The Asian region is marked by continuing high-level emissions of greenhouse gases from human activities [9Zeqiang F, Yunlong C, Youxiao Y, Erfu D. Research on the relationship of cultivated land change and food security in China. Ziran Ziyuan Xuebao 2001; 16(4): 313-9.]. IPCC Global Climate Models (GCMs) predict that the increase in annual mean warming could reach about 3°C by the 2050s and about 5°C by the 2080s over selected regions in Asia [4Solomon S, Ed. Climate change: The physical science basis 2007.]. A recent study using a Regional Climate Model (RCM) found that by the end of this century Southwest Asia will be uninhabitable [10Lelieveld J, Proestos Y, Hadjinicolaou P, Tanarhte M, Tyrlis E, Zittis G. Strongly increasing heat extremes in the Middle East and North Africa (MENA) in the 21st century 2015; 1-16., 11Pal JS, Eltahir EA. Future temperature in southwest Asia projected to exceed a threshold for human adaptability. Nat Clim Chang 2015; 6: 197-200.].
In light of the burgeoning population, social environment scientists and policy makers have recently begun to take special notice of urban climate change [12Grimmond CS, Roth M, Oke TR, et al. Climate and more sustainable cities: Climate information for improved planning and management of cities (producers/capabilities perspective). Procedia Environ Sci 2010; 1: 247-74.
[http://dx.doi.org/10.1016/j.proenv.2010.09.016] , 13Mills G, Cleugh H, Emmanuel R, et al. Climate information for improved planning and management of mega cities (needs perspective). Procedia Environ Sci 2010; 1: 228-46.
[http://dx.doi.org/10.1016/j.proenv.2010.09.015] ]. Various studies have also argued that significant collaboration between city planners and climate change scientists is required if these areas are to continue to maintain their livability and reduce their effect on global climate change [14Clinton N, Gong P. MODIS detected surface urban heat islands and sinks: Global locations and controls. Remote Sens Environ 2013; 134: 294-304.
[http://dx.doi.org/10.1016/j.rse.2013.03.008] -19Thorsson S, Lindberg F, Björklund J, Holmer B, Rayner D. Potential changes in outdoor thermal comfort conditions in Gothenburg, Sweden due to climate change: The influence of urban geometry. Int J Climatol 2011; 31(2): 324-35.
[http://dx.doi.org/10.1002/joc.2231] ].
Until recently, research on urban warming and its links to regional as well as global warming has been limited to observational measurements taken in mature cities, the only sites providing good sources of the data required for interpreting trends in urban climate change [20Tran H, Uchihama D, Ochi S, Yasuoka Y. Assessment with satellite data of the urban heat island effects in Asian mega cities. Int J Appl Earth Obs 2006; 8(1): 34-48.
[http://dx.doi.org/10.1016/j.jag.2005.05.003] ]. These in situ data have the advantage of long-term records but the disadvantage of poor spatial resolution [21Gallo KP, McNab AL, Karl TR, Brown JF, Hood JJ, Tarpley JD. The use of a vegetation index for assessment of the urban heat island effect. Remote Sens 1993; 14(11): 2223-30.
[http://dx.doi.org/10.1080/01431169308954031] -24van Wijngaarden WA, Mouraviev A. Seasonal and annual trends in Australian minimum/maximum daily temperatures. TOASJ 2016; 10(1): 39-55.
[http://dx.doi.org/10.2174/1874282301610010039] ]. More recently, observation from satellites, one of the most novel and effective monitoring tools developed for recording temperature change phenomena [25Govindankutty M, Chandrasekar A, Bohra AK, George JP, Dasgupta M. The impact of assimilation of MODIS observations using WRF-VAR for the prediction of a monsoon depression during September 2006. TOASJ 2008; 2: 68-78.
[http://dx.doi.org/10.2174/1874282300802010068] ] over broad geographic areas has come into use due to its methodological efficacy in recording local information [4Solomon S, Ed. Climate change: The physical science basis 2007.].
Land surface temperature (LST) plays a significant feature of global temperature [20Tran H, Uchihama D, Ochi S, Yasuoka Y. Assessment with satellite data of the urban heat island effects in Asian mega cities. Int J Appl Earth Obs 2006; 8(1): 34-48.
[http://dx.doi.org/10.1016/j.jag.2005.05.003] ]. The field of remote sensing lends itself well to urban climatology studies due to its greatly improved spectral and spatial resolution, which facilitates tracking the development of the respective phenomena [26Kaufman YJ, Tanré D, Boucher O. A satellite view of aerosols in the climate system. Nature 2002; 419(6903): 215-23.
[http://dx.doi.org/10.1038/nature01091] [PMID: 12226676] ]. The advantage it provides in measuring LST as a feature of global temperature has been noted in several studies that have focused on individual urban areas in China [27Kou X, Jiang L, Bo Y, Yan S, Chai L. Estimation of land surface temperature through blending MODIS and AMSR-E data with the Bayesian maximum entropy method. Remote Sens 2016; 8(2): 105.
[http://dx.doi.org/10.3390/rs8020105] -30Tan M, Li X. Quantifying the effects of settlement size on urban heat islands in fairly uniform geographic areas. Habitat Int 2015; 49: 100-6.
[http://dx.doi.org/10.1016/j.habitatint.2015.05.013] ], India [31Swain D, Roberts GJ, Dash J, Vinoj V, Lekshmi K, Tripathy S. Impact of rapid urbanization on the microclimate of Indian cities: A case study for the city of Bhubaneswar. Proceedings, SPIE Asia-Pacific Remote Sensing Conference 2016; 98772X.], and Dubai [32Elhacham E, Alpert P. Impact of coastline-intensive anthropogenic activities on the atmosphere from moderate resolution imaging spectroradiometer (MODIS) data in Dubai (2001–2014). Earths Futur 2016; 4(3): 54-61.
[http://dx.doi.org/10.1002/2015EF000325] ].
Recent studies have linked change in LST with atmospheric circulation; see for example, Zhuo [33Zhuo H, Liu Y, Jin J. Improvement of land surface temperature simulation over the Tibetan Plateau and the associated impact on circulation in East Asia. Atmos Sci Lett 2016; 17(2): 162-8.
[http://dx.doi.org/10.1002/asl.638] ] in China and Zhou and Wang [34Zhou C, Wang K. Land surface temperature over global deserts: Means, variability, and trends. J Geophys Res Atmos 2016; 121(14): 344-57.] over global deserts. Lensky and Dayan [35Lensky IM, Dayan U. Satellite observations of land surface temperature patterns induced by synoptic circulation. Int J Climatol 2015; 35(2): 189-95.
[http://dx.doi.org/10.1002/joc.3971] ] attempted to quantify the impact of several atmospheric circulations on LST patterns over the Eastern Mediterranean for 2000–2012 MODIS data. They found that the differences between the LST data retrieved from satellites and 2-m air temperature data as reported by land-based meteorological stations generally increase with stronger sun insolation but decline with the turbulence caused by strong winds. These parameters also vary according to synoptic-scale circulation, which is affected by horizontal pressure gradients and cloud cover. Lensky and Dayan [35Lensky IM, Dayan U. Satellite observations of land surface temperature patterns induced by synoptic circulation. Int J Climatol 2015; 35(2): 189-95.
[http://dx.doi.org/10.1002/joc.3971] ] have shown that synoptic circulation induces LST patterns, with variations in LST related, among others, to vegetation cover, clouds, water vapor, surface heterogeneity, and topography [36Martínez D, Jiménez MA, Cuxart J, Mahrt L. Heterogeneous nocturnal cooling in a large basin under very stable conditions. Boundary-Layer Meteorol 2010; 137(1): 97-113.
[http://dx.doi.org/10.1007/s10546-010-9522-z] ]. In another study, Lensky and Dayan [37Lensky IM, Dayan U. Detection of fine-scale climatic features from satellites and implications for agricultural planning. Bull Am Meteorol Soc 2011; 92(9): 1131-6.
[http://dx.doi.org/10.1175/2011BAMS3160.1] ] found that the high spatial variability of surface temperatures induces similar variability in 2-m air temperatures, hampering representation of these temperatures in numerical models [38Holtslag AA, Svensson G, Baas P, et al. Stable atmospheric boundary layers and diurnal cycles: Challenges for weather and climate models. Bull Am Meteorol Soc 2013; 94(11): 1691-706.
[http://dx.doi.org/10.1175/BAMS-D-11-00187.1] ]. As LST differs from 2-m air temperature in terms of physical magnitude, the derivation of 2-m air temperatures from LSTs is not straightforward [39Jin M, Dickinson RE. Land surface skin temperature climatology: Benefitting from the strengths of satellite observations. Environ Res Lett 2010; 5(4): 044004.
[http://dx.doi.org/10.1088/1748-9326/5/4/044004] ].
In consequence, methods applying statistical approaches and spatial smoothing are employed when predicting air temperatures from LSTs even though the outcomes are applicable only to the domain for which they were developed [40Kloog I, Chudnovsky A, Koutrakis P, Schwartz J. Temporal and spatial assessments of minimum air temperature using satellite surface temperature measurements in Massachusetts, USA. Sci Total Environ 2012; 432: 85-92.
[http://dx.doi.org/10.1016/j.scitotenv.2012.05.095] [PMID: 22721687] , 41Zhu W, Lű A, Jia S. Estimation of daily maximum and minimum air temperature using MODIS land surface temperature products. Remote Sens Environ 2013; 130: 62-73.
[http://dx.doi.org/10.1016/j.rse.2012.10.034] ] and are sensitive to station density [42Kilibarda M, Hengl T, Heuvelink G, et al. Spatio-temporal interpolation of daily temperatures for global land areas at 1 km resolution. J Geophys Res Atmos 2014; 119(5): 2294-313.
[http://dx.doi.org/10.1002/2013JD020803] ]. Although Blandford [43Blandford TR, Humes KS, Harshburger BJ, Moore BC, Walden VP, Ye H. Seasonal and synoptic variations in near-surface air temperature lapse rates in a mountainous basin. J Appl Meteorol Climatol 2008; 47: 249-61.
[http://dx.doi.org/10.1175/2007JAMC1565.1] ] adopted a physical approach using surface data at different altitudes to retrieve the thermal profile of the ~1500 m boundary layer, this method is unable to detect near-surface (2-m) temperatures.
In the last 2-3 decades, the number of comparative studies using satellite data has grown, with the technology allowing coverage of large geographic areas, thereby creating new opportunities for climate change research [20Tran H, Uchihama D, Ochi S, Yasuoka Y. Assessment with satellite data of the urban heat island effects in Asian mega cities. Int J Appl Earth Obs 2006; 8(1): 34-48.
[http://dx.doi.org/10.1016/j.jag.2005.05.003] ]. Imhoff [44Imhoff ML, Zhang P, Wolfe RE, Bounoua L. Remote sensing of the urban heat island effect across biomes in the continental USA. Remote Sens Environ 2010; 114: 504-13.
[http://dx.doi.org/10.1016/j.rse.2009.10.008] ], for example, examined the LST data obtained from MODIS for an average of three years (2003-2005) in the 38 most populous cities in the United States. The results demonstrated that Urban Heat Island (UHI) amplitude increases with city size and is seasonally asymmetric at a large number of sites. Peng [45Peng S, Piao S, Ciais P, et al. Surface urban heat island across 419 global big cities. Environ Sci Technol 2012; 46(2): 696-703.
[http://dx.doi.org/10.1021/es2030438] [PMID: 22142232] ] selected 428 of the world's largest cities when exploring the global drivers of the Surface Urban Heat Island (SUHI). Jin and Dickinson [39Jin M, Dickinson RE. Land surface skin temperature climatology: Benefitting from the strengths of satellite observations. Environ Res Lett 2010; 5(4): 044004.
[http://dx.doi.org/10.1088/1748-9326/5/4/044004] ], analyzed the MODIS skin temperature observations during 9 years (2000-2009) for diurnal, seasonal, and inter-annual variations at a 0.05◦ latitude/longitude grid over the global land surface. In 2010, Clinton and Gong [14Clinton N, Gong P. MODIS detected surface urban heat islands and sinks: Global locations and controls. Remote Sens Environ 2013; 134: 294-304.
[http://dx.doi.org/10.1016/j.rse.2013.03.008] ] performed a composite Aqua and Terra -MODIS analysis (with 5- and 10-km buffers) of the factors influencing urban vs. rural SUHI temperatures, followed by its global analysis and ranking of the urban areas surveyed. Both studies mapped urban areas while here the focus is given to the individual megacities in Asia. Also, extending time series longer-term LST trends (2002-2012) as they appeared in all the world's megacities are investigated here, in an effort to explain the inter-megacity variations. Tran et al. [20Tran H, Uchihama D, Ochi S, Yasuoka Y. Assessment with satellite data of the urban heat island effects in Asian mega cities. Int J Appl Earth Obs 2006; 8(1): 34-48.
[http://dx.doi.org/10.1016/j.jag.2005.05.003] ] also employed a 1-km MODIS resolution for 2001-2003 in their study of the SUHI's spatial patterns for eight Asian megacities as well as its relationship to land-cover properties such as vegetation, population and city area. While here, the 1-km MODIS resolution was employed when investigating longer-term LST trends (2003-2014) over the world's 29 largest megacities (>10 million inhabitants). It should be noticed that there are many more studies of the UHI of individual cities that are not cited here.
The overall objective of this study is to provide local comparative cross-sectional data of the SUHI for the top 10 megacities in the Monsoon Asian Region, the world's most rapidly growing geographic area. A further goal, for global comparison, was to provide an overview of trends in global temperature changes for 29 megacities based on MODIS LST data retrievals. In addition, comparisons between LST trends with different MODIS resolutions, i.e., 1 deg and 1 km, available in the Monsoon Asian Region, were also conducted.
2. MATERIAL AND METHODS
2.1. Data Sets
2.1.1. Population Data
For the purpose of this study, we defined global megacities as such with populations exceeding 10 million, based on Brinkhoff's recommendations [46Brinkhoff T. The principal agglomerations of the world 2006. Available at:
http://www.adb.orghttp:// www.citypopulation.de]. Agglomerations include a central city and neighboring communities, linked to the central city by either continuous built-up areas or a predetermined number of commuters. Some agglomerations may have two or more central cities (e.g., The Ruhr) although the majority have only one. Countries, cities, population and latitude-longitude coordinates appear in (Table 1 and Fig. 1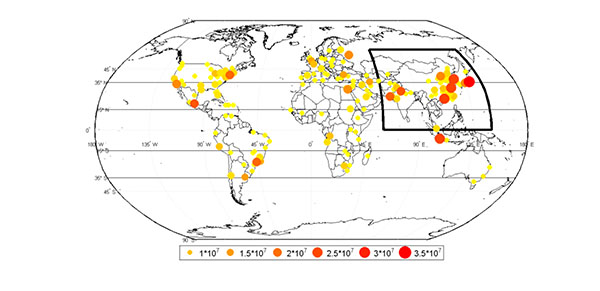 ).
).

2.1.2. MODIS Data
MODIS, the Moderate Resolution Imaging Spectroradiometer, is a satellite programmed to collect data for the spatial and temporal characteristics of the global LST during daytime and nighttime [47The Moderate Resolution Imaging Spectroradiometer https://www.nasa.gov/. Accessed on: 03 April]. The monitor has 36 channels, spanning the spectral range of 0.41 to 15 µm. MODIS, with its 2330-km viewing swath, provides almost daily global coverage. We employed Collection 5 (MOD08_M3.050) of Terra -MODIS and Collection 5.1 of Aqua -MODIS (MYD08_M3.051) level-3 monthly data with a global 1°×1° grid for the summer months - June to August – for the ten-year period 2002-2012.
An Aqua and Terra - MODIS database was constructed to enable estimation of LST trends. Global and local overviews in specific megacities were obtained using the two aforementioned sensors, positioned aboard two NASA satellites: Terra (launched in December 1999) and Aqua (launched in May 2002). With cameras focused directly (straight down) at the earth's surface, MODIS technology records a broad range of global temperature and other data. The LST trends themselves were calculated for the summer months, when data from the two sensors were available [48Remer LA, Kleidman RG, Levy RC, et al. Global aerosol climatology from the MODIS satellite sensors. J Geophys Res-Atmos (1984–2012) 2008; 113: D14S07.-51Roth M, Oke TR, Emery WJ. Satellite-derived urban heat islands from three coastal cities and the utilization of such data in urban climatology. Int J Remote Sens 1989; 10(11): 1699-720.
[http://dx.doi.org/10.1080/01431168908904002] ].
2.1.3. Cloudiness Effect
The MODIS expanse becomes limited with increasing cloud cover [52Lebassi B, Gonzalez J, Fabris D, et al. Observed 1970-2005 cooling of summer daytime temperatures in coastal California. J Clim 2009; 22(13): 3558-73.
[http://dx.doi.org/10.1175/2008JCLI2111.1] , 53Price C, Michaelides S, Pashiardis S, Alpert P. Long term changes in diurnal temperature range in Cyprus. Atmos Res 1999; 51(2): 85-98.
[http://dx.doi.org/10.1016/S0169-8095(99)00022-8] ] due to the aerosol effect. This means that the satellite's data retrieval under overcast conditions is less accurate than when cloud cover is nonexistent or thin due to aerosols. According to Remer et al. [52Lebassi B, Gonzalez J, Fabris D, et al. Observed 1970-2005 cooling of summer daytime temperatures in coastal California. J Clim 2009; 22(13): 3558-73.
[http://dx.doi.org/10.1175/2008JCLI2111.1] , 53Price C, Michaelides S, Pashiardis S, Alpert P. Long term changes in diurnal temperature range in Cyprus. Atmos Res 1999; 51(2): 85-98.
[http://dx.doi.org/10.1016/S0169-8095(99)00022-8] ], percent cloud cover exceeding 0.8, may lead to overestimated satellite retrieval of AOD because cloud droplets can become mixed with coarse mode particles. In order to minimize retrieval uncertainty, the data used was collected only during months characterized by percent cloud cover below 0.7. The effect of cloudiness on land surface temperature may be significantly smaller (personal communication with MODIS people) still the present analysis screened high-cloudiness months. It is assumed that this screening did not have a significant influence on our SUHI results.
2.1.4. The MODIS 8-Day 1-km LST
Products in the Giovanni cover the Monsoon Asian Integrated Regional Study (MAIRS) region [50The MODIS 8-day 1-km LST. Available at: https://giovanni.sci.gsfc.nasa.gov/ giovanni/ [Accessed on: 03 April 2017].]. The 8-day product's observation time is a simple average of daily observation time. Terra's daily local equator-crossing times are 10:30 AM and 10:30 PM, whereas Aqua's daily passes occur at local 1:30 AM and 1:30 PM. Orbit width is 2,330 km; hence, local time at its edge indicates a difference of approximately 1.5 hours. For the SUHI investigation we focused only on Aqua -MODIS data to ensure that the satellite sensors could differentiate between LST trends over megacities and the surrounding rural areas at 1:30 PM, the hottest hour of the day. The subsequent data file, which covers the entire Asian Monsoon Region, was comprised of averaged daytime and nighttime LSTs under cloudless conditions, with quality flags, during the summer months June to August, 2003-2014.
It should be clarified that the Terra and Aqua -MODIS readings obtained to extract trends and mean LST data have two different resolutions; first, 1°×1° (summer 2002-2012), for the world's 233 largest cities and second employing the finer 1 km horizontal grid (summer 2002-2014), for the 10 megacities in the Asian Monsoon Region. In addition, it was assumed here that the detectable temperature differences and/or absolute temperature accuracies of the MODIS sensor had a small effect on the calculated trends. This, because changes in the MODIS sensor accuracy during the 11-12 years period were assumed to be small enough.
3. METHODOLOGY
3.1. Temperature Analysis
Our approach to estimating the effect of urbanization on temperature change across the world's top ten megacities was based on an analysis of long-term variations in LST trends for the chosen sites in the selected time period. The LST parameters estimated in three stages. First, we investigated the latitudinal and longitudinal spread of each city center and confirmed our results with Google Earth. In order to compare mean LST distributions between city centers, mean LST values, labeled “running mean”, acted as a filter for the calculated vectors as follows in Equation (1):
(1) Y (i) = sum(X (j)) / (2*M+1), for j = (i-M): (i+M), and i=1: length(X)
Where Y = RUNMEAN (X, M) calculates a running mean on the elements of vector X, which in this study is the LST Average, using a window of 2*M+1 data points. M is defined as the length of each city's vector for each city's latitudinal and longitude distribution.
In the second stage, we created a global map at 1°×1°, day and night, covering the world's 233 largest cities (i.e., population exceeding 2 million), including the world's 29 megacities, based on the Terra and Aqua -MODIS readings obtained during the study period (summer 2002-2012). To ensure that the satellite sensors would differentiate between LST trends in megacities and the surrounding rural areas, we used Aqua -MODIS (1 km resolution) data exclusively. The 1 km resolution is better for understanding the impact of urbanization on local climate. The Aqua data are available for 10 megacities in the Asian Monsoon Region (counted among the world's 20 largest cities) during June-August, 2003-2014. It should note that cloudiness impedes data collection in tropical climates during the rainy season. Hence, no data is available for India among other sites. In addition, megacities for which more than six years of data were missing were deleted from the sample in order to minimize retrieval uncertainty.
3.2. Study Area
The Asian Monsoon Region extends from 0o to 60oN, 60o to 150oE; it includes eastern China, the Japanese islands, the Korean peninsula, Mongolia, Taiwan (Republic of China), Pakistan and India. Geographically, the region is located in the eastern segment of the Eurasian continent — the world's largest continent — and borders the Pacific, the world's largest ocean [4Solomon S, Ed. Climate change: The physical science basis 2007.]; (Fig. 1 and Table 2).

4. RESULTS
4.1. The Surface Urban Heat Island 1 km Resolution Cross-Sections
First, the cross-sections of LST for 10 selected megacities according to the latitude (E-W) as shown in Figs. (2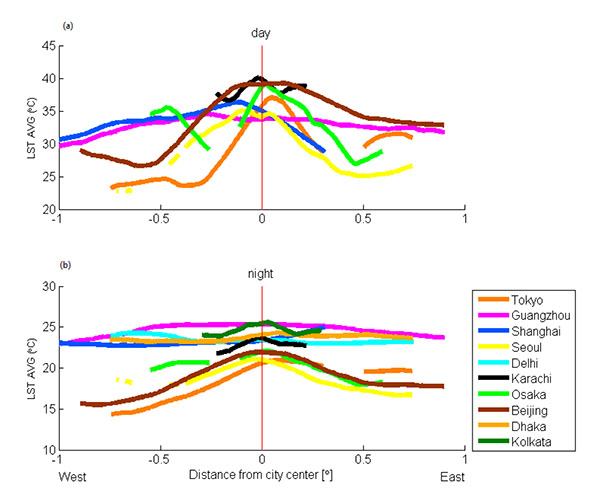 , 4
, 4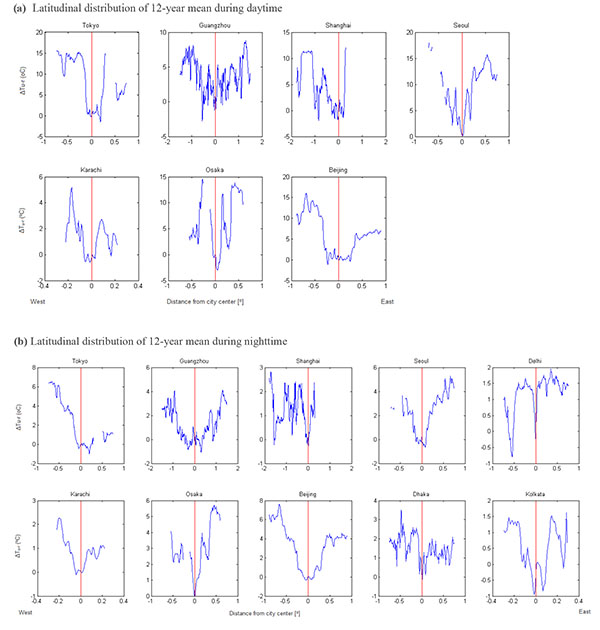 ) and longitude (N-S) Figs. (3, 5
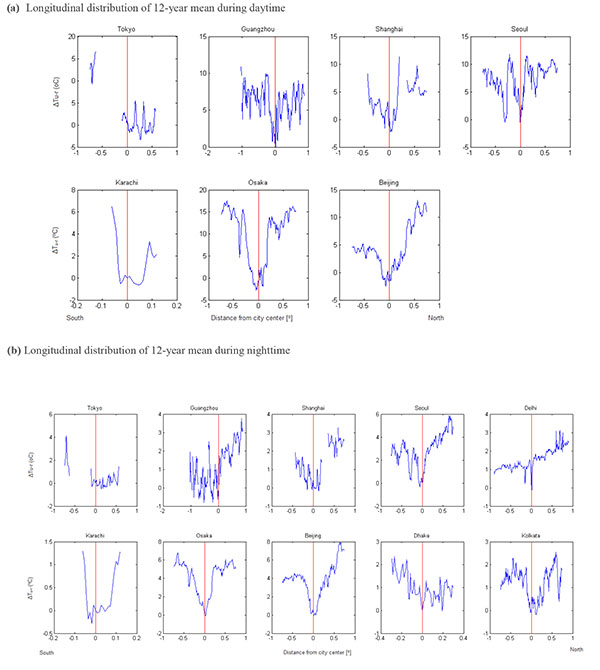 ) of their SUHI averaged for 2003-2014 period, were investigated. The exact location of the city center was taken from Brinkhoff [46Brinkhoff T. The principal agglomerations of the world 2006. Available at:
http://www.adb.orghttp:// www.citypopulation.de] and confirmed by Google Earth.
) of their SUHI averaged for 2003-2014 period, were investigated. The exact location of the city center was taken from Brinkhoff [46Brinkhoff T. The principal agglomerations of the world 2006. Available at:
http://www.adb.orghttp:// www.citypopulation.de] and confirmed by Google Earth.

 |
Fig. (3) As in Fig. (2)  but for the longitudinal distributions. but for the longitudinal distributions.
|
 |
Fig (4) The change in Urban-Rural of the longitudinal distribution of 12-year mean (a) daytime and (b) nighttime LST based on Aqua -MODIS data sets for 1 km for each megacity. |
Figs. (2, 3 ) compare the Lat and Lon distributions of the SUHI Aqua -MODIS LSTs in the proximity of the city centers. They show that the LSTs are on the average decreasing with distance with an approximated bell-shaped distribution for both day and night, with a pronounced SUHI maximum over the city center. However, it should be noted that our figures are averages over a period of 12-y during which the city fringes have probably undergone significant LST changes. Hence the LST decreases with distance from city center represent a 12-y average picture which misses sub-period variations.
It is also interesting to note that during daytime, pronounced maximum LST are found especially over the megacities of Tokyo, Seoul and Beijing with a larger decrease for latitudinal (E-W) variation as shown in Fig. (2a) as compared with the longitudinal (N-S) change in (Fig. 3a).
During nighttime as shown in Figs. (2b, 3b), the LST slopes were found larger in the coldest cities, i.e., Tokyo, Seoul, Osaka and Beijing (the cities with lower temperatures). In addition, a relatively flat LST distribution along both latitude and longitude was found in Guangzhou, Shanghai, Delhi and Dhaka; it should be noted, however, that SUHI can still reach ~2-4oC (as particularly noticed in the individual cities' cross-sections in Figs. (4, 5). In Shanghai, the flat distribution at night is contrasted during the daytime by a pronounced bell-shaped distribution in both latitude/ longitude of ~8-11oC.
 |
Fig (5) The change in Urban-Rural of the longitudinal distribution of 12-year mean (a) daytime and (b) nighttime LST based on Aqua -MODIS data sets for 1 km for each megacity. |
4.1.1. Individual LST Cross-Sections
The “Urban minus Rural temperature” differences, ΔTu-r LST Aqua -MODIS data is calculated between the city center and the nearby urban area for each megacity, in terms of latitudinal as in Fig. (4) and longitudinal in Fig. (5) for (a) day and (b) night. In Fig. (4), a pronounced distribution was found in Tokyo, Seoul, Osaka and Beijing (arranged in the decreasing order) with a maximum of 15oC, following with Shanghai (12oC); Guangzhou (8.8oC) and Karachi with 5.1oC SUHI. Fig. (4b) represents the latitude nighttime, the maximum SUHI was found with smaller values (compared to the daytime), in Beijing (7.6oC); Tokyo (6.4oC), Osaka and Seoul (~5.5oC); Guangzhou and Dhaka (~3.5oC). In the other megacities, ΔTu-r reaches maximum values of 2.5oC SUHI only.
According to Fig. (5a), for the longitude daytime data, the maximum SUHI found in two cities Osaka and Beijing in the order of 15oC. Following are Seoul, Shanghai and Guangzhou with ~11oC; and Karachi with 6.5oC SUHI. Fig. (5b) represents the longitude nighttime data; the maximum temperature differences were also found to be more moderate compared to the daytime as in Fig. (4). For example, the maximum SUHI was found in Tokyo (6.4oC E-W; 4.1oC N-S), Seoul (5.2oC E-W; 5.9oC N-S), Osaka (5.7oC E-W; 6.7oC N-S) and in Beijing (7.6oC E-W; 7.9oC N-S).
In all the four graphs Figs. (2, 5), it can be identified the location where the SUHI begins, ends and sometimes starts again. For example, Figs. (2, 3) shows the SUHI appears very clearly in Tokyo, Beijing and Osaka during the daytime, while at nighttime the SUHI appears clearly in the tropical megacities of Kolkata and Seoul.
The next section presents maps of the day and night LST trends with time for all global megacities during the periods 2002-2012 and 2003-2014 for Terra and Aqua, respectively.
4.2. Maps of Global Megacities LST Trends with Time
In order to obtain a global map of day and night LST trends based on Terra and Aqua -MODIS temperatures that are covering the largest cities similar to the methodology employed by Alpert [5Alpert P, Shvainshtein O, Kishcha P. AOD trends over megacities based on space monitoring using MODIS and MISR. AJJC 2012; 1(03): 117-31.] for aerosol trends, were employed. However, here the trends were calculated by the LST time-slopes. The maps in Figs. (6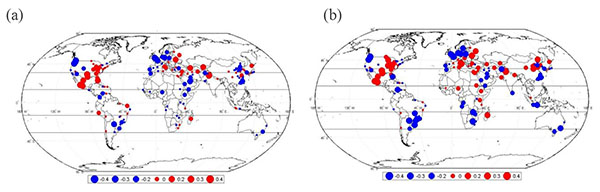 , 7
, 7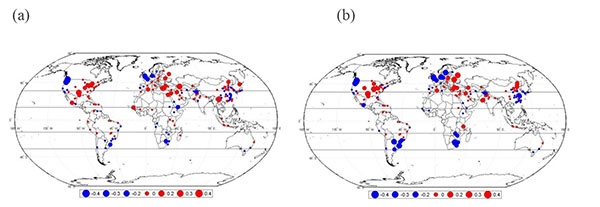 ) represent the world's 233 largest cities having populations exceeding 2 million [46Brinkhoff T. The principal agglomerations of the world 2006. Available at:
http://www.adb.orghttp:// www.citypopulation.de]. Circles of various diameters and colors indicate the extent and sign of the LST tendencies (see bottom panel). The circles radii represent the value of the LST trends, while the color indicates the sign of the trend, blue/red indicates decrease/increase.
) represent the world's 233 largest cities having populations exceeding 2 million [46Brinkhoff T. The principal agglomerations of the world 2006. Available at:
http://www.adb.orghttp:// www.citypopulation.de]. Circles of various diameters and colors indicate the extent and sign of the LST tendencies (see bottom panel). The circles radii represent the value of the LST trends, while the color indicates the sign of the trend, blue/red indicates decrease/increase.

Our figures clearly indicate areas where LST slopes are positive or negative during the study period, 2002-2012. The data also reveal the effect of urbanization on LST, with changes associated with a low/high level of anthropogenic development. The global data provided by the two sensors (Aqua/Terra) suggest as follows. The Terra -MODIS shown in Fig. (6a)and Aqua in Fig. (6b) show similar rising LST trends during daytime, were found over the majority of the selected sites in the areas of the Mid-East, the Asian Monsoon region and in the S. & E. of the USA. In contrast, declining LST trends were dominant in Europe, Saudi Arabia, parts of NW America, and the E. part of S. America.
Based on Terra -MODIS data from the 29 megacities (population over 10 million) in the sample, in Fig. (6a) shows a significant LST increase in Asian megacities, i.e., Cairo, Jakarta, Istanbul, Seoul, Tehran, Osaka and especially in Moscow. Increasing LST is also found in Mexico City and New York. In contrast, London and Paris, Los Angeles, São Paulo, Rio de Janeiro and Buenos Aires, and some Asian areas (Tokyo, Beijing, Tianjin and Karachi), exhibit declining LSTs. Out of the 29 megacities Terra and Aqua -MODIS (1°×1°) show similar increasing trends in Cairo, Istanbul, Osaka and Moscow. Similar declining LSTs were found for both Terra/Aqua in London, Paris, Los Angeles, São Paulo, Rio de Janeiro, Buenos Aires and Tokyo (Fig. 6 and Table 2).
 |
Fig.(7) As in Fig. (6 ) but for nighttime based on LST data sets of (a) Terra -MODIS (179 cities) and (b) Aqua -MODIS (172 megacities) at 1°×1°.
|

The 10 megacities LST trends in Fig. (8 ) and Table (3) (based on Aqua -MODIS) are more pronounced due to the 1 km resolution as compared with the previous maps at 1°×1° in Figs. (6, 7). The Aqua -MODIS results for the Monsoon Asian Region clearly show dominant increasing LSTs during daytime. Furthermore, declining nighttime LST was indicated in the three largest megacities, i.e., Tokyo, Guangzhou and Shanghai. The Daily Temperature Range (DTR) was found to increase except for Osaka. In addition, increases in the LST throughout the day and night were found in Seoul, Karachi, Osaka and Beijing. Our statistical estimates for the slopes during daytime hours were found to be significant at the 95% confidence level (p<0.05) only for Karachi (p<0.03). Note that the Karachi data are for 11 years only, ending in 2011; (Table 3).

The world's top 29 megacities, listed by number of inhabitants in decreasing order (see Table 1). The 2002-2012 LST trends (oC/11y) are for the two MODIS sensors, Terra and Aqua, at 1°×1°; NA = not available. Statistically significant slopes at a 95% (i.e., P < 0.05). In parentheses, the (R2; P -value) are also indicated.

5. DISCUSSION
According to the report issued by the UN’s Department of Economic and Social Affairs [1United Nations, Department of Economic and Social Affairs, Population Division. World Population Prospects 2010.], the world's human population is expected to exceed 10 billion in the near future. Countries with high population densities will consequently witness rising pressure on the environment. The pressure in the Asian region is likely to increase even more when compared to other countries due to the rising demand for grains and economic development [9Zeqiang F, Yunlong C, Youxiao Y, Erfu D. Research on the relationship of cultivated land change and food security in China. Ziran Ziyuan Xuebao 2001; 16(4): 313-9.].
Since the beginning of the 21st century, most studies have examined climate change with in-situ data, usually collected in one or two cities [20Tran H, Uchihama D, Ochi S, Yasuoka Y. Assessment with satellite data of the urban heat island effects in Asian mega cities. Int J Appl Earth Obs 2006; 8(1): 34-48.
[http://dx.doi.org/10.1016/j.jag.2005.05.003] , 51Roth M, Oke TR, Emery WJ. Satellite-derived urban heat islands from three coastal cities and the utilization of such data in urban climatology. Int J Remote Sens 1989; 10(11): 1699-720.
[http://dx.doi.org/10.1080/01431168908904002] ]. Here, in contrast, the use of latitudinal and longitudinal cross-sectional Aqua -MODIS LST data enabled mapping of 10 Asian megacities during June-August. Based on these data, we found that the sites exhibiting maximum SUHI intensity roughly coincided with the heavily built-up areas located in major city centers. Hence, cities with extremely urbanized areas, characterized by low albedo and dense construction, exhibited significantly higher daytime surface temperatures when compared to the surrounding rural area comprised of relatively moister vegetated areas [20Tran H, Uchihama D, Ochi S, Yasuoka Y. Assessment with satellite data of the urban heat island effects in Asian mega cities. Int J Appl Earth Obs 2006; 8(1): 34-48.
[http://dx.doi.org/10.1016/j.jag.2005.05.003] ]. With respect to the LST magnitudes shown in Figs. (4, 5), steeper temperature gradients were observed during daytime hours, i.e., Tokyo, Seoul, Osaka and Beijing with 15oC gradients, followed by Shanghai with 12oC and Guangzhou with 8.8o C. This finding fit those in the Tran et al. [20Tran H, Uchihama D, Ochi S, Yasuoka Y. Assessment with satellite data of the urban heat island effects in Asian mega cities. Int J Appl Earth Obs 2006; 8(1): 34-48.
[http://dx.doi.org/10.1016/j.jag.2005.05.003] ] study, which produced a similar ordering of cities by temperature gradient, i.e., Tokyo, followed by Beijing, Seoul and Shanghai. Temperatures were also found to decrease outward from the city center, distributed according to an approximate bell-shaped curve during the day, a finding that can be explained by the UHI phenomenon. During the night, megacities such as Guangzhou and Shanghai showed far gentler SUHI, which can be explained by the effect of peripheral cities or industrial centers, a condition that influences LST. Another factor could be the sun insolation that plays an important contribution to the increase of daily SUHI. Tran et al. [21Gallo KP, McNab AL, Karl TR, Brown JF, Hood JJ, Tarpley JD. The use of a vegetation index for assessment of the urban heat island effect. Remote Sens 1993; 14(11): 2223-30.
[http://dx.doi.org/10.1080/01431169308954031] ] also suggested that SUHI diurnal variations are due to differences in urban–rural characteristics such as moisture availability and surface cooling rates, further affected by topography, rural surroundings and the geographic location of cities relative to the sea [20Tran H, Uchihama D, Ochi S, Yasuoka Y. Assessment with satellite data of the urban heat island effects in Asian mega cities. Int J Appl Earth Obs 2006; 8(1): 34-48.
[http://dx.doi.org/10.1016/j.jag.2005.05.003] , 52Lebassi B, Gonzalez J, Fabris D, et al. Observed 1970-2005 cooling of summer daytime temperatures in coastal California. J Clim 2009; 22(13): 3558-73.
[http://dx.doi.org/10.1175/2008JCLI2111.1] ].
In contrast to in-situ UHI studies, in which minimum daily temperatures tend to increase at a higher rate than do daily temperatures (the latter inducing a decreasing long-term diurnal temperature range; see for example [52Lebassi B, Gonzalez J, Fabris D, et al. Observed 1970-2005 cooling of summer daytime temperatures in coastal California. J Clim 2009; 22(13): 3558-73.
[http://dx.doi.org/10.1175/2008JCLI2111.1] , 53Price C, Michaelides S, Pashiardis S, Alpert P. Long term changes in diurnal temperature range in Cyprus. Atmos Res 1999; 51(2): 85-98.
[http://dx.doi.org/10.1016/S0169-8095(99)00022-8] ]), the satellite-basedF SUHIs temperatures observed tending to be higher during the day, with peak temperatures reached in areas of large buildings or paved surfaces, and lowest during the night, due to difference in surface properties and cooling rates [20Tran H, Uchihama D, Ochi S, Yasuoka Y. Assessment with satellite data of the urban heat island effects in Asian mega cities. Int J Appl Earth Obs 2006; 8(1): 34-48.
[http://dx.doi.org/10.1016/j.jag.2005.05.003] , 51Roth M, Oke TR, Emery WJ. Satellite-derived urban heat islands from three coastal cities and the utilization of such data in urban climatology. Int J Remote Sens 1989; 10(11): 1699-720.
[http://dx.doi.org/10.1080/01431168908904002] ]. Therefore, in the current study, in order to monitor the seasonal variations in SUHIs (at a 1 km resolution), we focused only on Aqua -MODIS rather than Terra data, thus ensuring that the satellite sensors could differentiate between LST trends observed in megacities and those observed in the surrounding rural areas, both at 13:30 local time (LT), frequently observed to be the hottest hour of the day (as opposed to the 10:30 LT Terra measurement). Here, the DTR increased during 2002-2014 Table (3), which fit the earlier findings reported by Roth [51Roth M, Oke TR, Emery WJ. Satellite-derived urban heat islands from three coastal cities and the utilization of such data in urban climatology. Int J Remote Sens 1989; 10(11): 1699-720.
[http://dx.doi.org/10.1080/01431168908904002] ] and Tran [20Tran H, Uchihama D, Ochi S, Yasuoka Y. Assessment with satellite data of the urban heat island effects in Asian mega cities. Int J Appl Earth Obs 2006; 8(1): 34-48.
[http://dx.doi.org/10.1016/j.jag.2005.05.003] ], among others. Throughout the research period, a negative DTR was found only in Osaka. Furthermore, according to the IPCC's Atmosphere-Ocean Global Climate Model (OGCM) simulations the DTR will increase over central Asia and be significantly higher there than in other regions during the summer months of the 2050s and 2080s [54Lal M, Harasawa H. Future climate change scenarios for Asia as inferred from selected coupled atmosphere-ocean global climate models. J Meteorol Soc Jpn 2001; 79(1): 219-27.
[http://dx.doi.org/10.2151/jmsj.79.219] -56Yoshino M. Global warming and urban climates: report of the Research Center for Urban Safety and Security, Kobe University Special Report No. 1. Proceedings of the Second Japanese-German Meeting 1998; Klima Analyse fur die Stadtplanung 1998; 123-4.].
We should stress that, as Roth [57Roth M. Review of urban climate research in (sub) tropical regions. Int J Climatol 2007; 27(14): 1859-73.
[http://dx.doi.org/10.1002/joc.1591] ] has already noted, the limited range of urban morphologies characterizing the cities, as well as the role of building density and materials, prevented detailed exploration of temperature trends. Hence, further study is required in order to explore the contribution of these and other parameters, such as population density, energy consumption, and transportation volume, to urban warming.
CONCLUSION
This article has stressed the advantages provided by satellite remote sensing monitoring techniques when performing quantitative climatic observations worldwide, an ability that has significantly enhanced our ability to identify long-term trends in climate change [41Zhu W, Lű A, Jia S. Estimation of daily maximum and minimum air temperature using MODIS land surface temperature products. Remote Sens Environ 2013; 130: 62-73.
[http://dx.doi.org/10.1016/j.rse.2012.10.034] ]. These techniques have made reliable high-quality global coverage at high spatial resolution available, thereby creating opportunities for researchers to easily obtain improved global meteorological data and thus providing significant advantage relative to ground-based measurements. We should recall, however, that unlike ground-based measurements, satellite data are limited regarding the parameters to be measured; they likewise cannot provide accurate information on climate variables, which are important for the construction of human comfort indices.
The 1 km LST data from Aqua -MODIS can distinguish urban from surrounding rural areas, information supporting statistical analyses by making it possible to create bell-shaped data distributions (for latitude as well longitude magnitudes), which can indicate changes of trends in LST. By doing so, satellites provide us with the opportunity to compare global-temperature trends in different cities on the basis of data obtained from the same source and with the same measurement technology, irrespective of city size.
The same Aqua -MODIS (1 km) satellite source indicates that for Asia's three largest megacities -- Tokyo, Guangzhou and Shanghai -- a recent decrease in nighttime LST trends (2002-2014) has been observed. In contrast, the LST slope for both day and night was found to increase in Seoul, Karachi, Osaka and Beijing. Further research on the physical, economical, and social environment is required in order to better understand and evaluate climate change-induced vulnerabilities in the Asian Monsoon Region. These data are also relevant for assessing the feasibility of introducing adaptation measures in other regions. We should also anticipate that given the vital roles played by surface water and groundwater resources in forestry, agriculture, fisheries, livestock production and industrial activity in the Asian countries, the agricultural sector will continue to be highly sensitive to climate change impacts in that region [4Solomon S, Ed. Climate change: The physical science basis 2007.].
As to the Terra -MODIS and Aqua -MODIS (1°×1°) LST trends, Alpert et al. [5Alpert P, Shvainshtein O, Kishcha P. AOD trends over megacities based on space monitoring using MODIS and MISR. AJJC 2012; 1(03): 117-31.] have suggested that in cases where the different sensors show similar trends, the results can be considered reliable. This conclusion is supported by our findings for daytime hours, which were observed as increasing in the Mid-East and the Asian Monsoon region and in the southeastern US during 2002-2012. In contrast, trends in declining LST appeared to be dominant in Europe sites, Saudi Arabia, parts of Northwest America, and the Eastern segment part of South America. One suggestion is that those cities are aware of climate change, therefore implement climate change issues into their policies.
In general, we concluded that the MODIS satellite can be better-utilized if we were to adapt our current technologies and devise new methodologies. While most climatological studies conducted to date have employed in-situ data, the current study incorporated satellite data having global spatial coverage despite being limited in the variables to be observed. Furthermore, despite the methodological limitations of the current study, we suggest that the optimal direction of future research to involve: (a) Obtaining data with higher resolution MODIS 8-day 1 km LST for additional regions; (b) Expanding the list of variables, e.g., air humidity and wind speed, as tracked from land-based meteorological stations; and (c) Applying further combinations of high resolution satellite data with Global Climate Model (GCM) data for evaluation.
ETHICS APPROVAL AND CONSENT TO PARTICIPATE
Not applicable.
HUMAN AND ANIMAL RIGHTS
No Animals/Humans were used for studies that are base of this research.
CONSENT FOR PUBLICATION
Not applicable.
CONFLICT OF INTEREST
The authors declare no conflict of interest, financial or otherwise.
ACKNOWLEDGEMENTS
The authors thank Mr. Tomer Mayan for his assistance and construction of the maps. This research was funded through the international Virtual Institute DESERVE (Dead Sea Research Venue), funded by the German Helmholtz Association and the Gordon Center for Energy Studies. This study was made possible through the generous support of the Porter School of Environmental Studies, Tel Aviv University.
REFERENCES
| [1] | United Nations, Department of Economic and Social Affairs, Population Division. World Population Prospects 2010. |
| [2] | Molina MJ, Molina LT. Megacities and atmospheric pollution. J Air Waste Manag Assoc 2004; 54(6): 644-80. [http://dx.doi.org/10.1080/10473289.2004.10470936] [PMID: 15242147] |
| [3] | United Nations Population Fund (UNFPA). Growing up urban 2007. |
| [4] | Solomon S, Ed. Climate change: The physical science basis 2007. |
| [5] | Alpert P, Shvainshtein O, Kishcha P. AOD trends over megacities based on space monitoring using MODIS and MISR. AJJC 2012; 1(03): 117-31. |
| [6] | Dhorde A, Dhorde A, Gadgil AS. Long-term temperature trends at four largest cities of India during the twentieth century. J Indian Geophys Unio 2009; 13(2): 85-97. |
| [7] | Mage D, Ozolins G, Peterson P, et al. Urban air pollution in megacities of the world. Atmos Environ 1996; 30(5): 681-6. [http://dx.doi.org/10.1016/1352-2310(95)00219-7] |
| [8] | ADB (Asian Development Bank). Key Indicators http://www.adb.org 2002. |
| [9] | Zeqiang F, Yunlong C, Youxiao Y, Erfu D. Research on the relationship of cultivated land change and food security in China. Ziran Ziyuan Xuebao 2001; 16(4): 313-9. |
| [10] | Lelieveld J, Proestos Y, Hadjinicolaou P, Tanarhte M, Tyrlis E, Zittis G. Strongly increasing heat extremes in the Middle East and North Africa (MENA) in the 21st century 2015; 1-16. |
| [11] | Pal JS, Eltahir EA. Future temperature in southwest Asia projected to exceed a threshold for human adaptability. Nat Clim Chang 2015; 6: 197-200. |
| [12] | Grimmond CS, Roth M, Oke TR, et al. Climate and more sustainable cities: Climate information for improved planning and management of cities (producers/capabilities perspective). Procedia Environ Sci 2010; 1: 247-74. [http://dx.doi.org/10.1016/j.proenv.2010.09.016] |
| [13] | Mills G, Cleugh H, Emmanuel R, et al. Climate information for improved planning and management of mega cities (needs perspective). Procedia Environ Sci 2010; 1: 228-46. [http://dx.doi.org/10.1016/j.proenv.2010.09.015] |
| [14] | Clinton N, Gong P. MODIS detected surface urban heat islands and sinks: Global locations and controls. Remote Sens Environ 2013; 134: 294-304. [http://dx.doi.org/10.1016/j.rse.2013.03.008] |
| [15] | Fujibe F. Detection of urban warming in recent temperature trends in Japan. Int J Climatol 2009; 29(12): 1811-22. [http://dx.doi.org/10.1002/joc.1822] |
| [16] | Fujibe F. Urban warming in Japanese cities and its relation to climate change monitoring. Int J Climatol 2011; 31(2): 162-73. [http://dx.doi.org/10.1002/joc.2142] |
| [17] | Itzhak-Ben-Shalom H, Samuels R, Potchter O, Alpert P. Recent trends and future predictions until 2060 of urban warming in four Israeli cities employing the RegCM climate model. AJJC 2016; 5(04): 464. |
| [18] | Potchter O, Itzhak-Ben-Shalom H. Urban warming and global warming: Combined effect on thermal discomfort in the desert city of Beer Sheva, Israel. J Arid Environ 2013; 98: 113-22. [http://dx.doi.org/10.1016/j.jaridenv.2013.08.006] |
| [19] | Thorsson S, Lindberg F, Björklund J, Holmer B, Rayner D. Potential changes in outdoor thermal comfort conditions in Gothenburg, Sweden due to climate change: The influence of urban geometry. Int J Climatol 2011; 31(2): 324-35. [http://dx.doi.org/10.1002/joc.2231] |
| [20] | Tran H, Uchihama D, Ochi S, Yasuoka Y. Assessment with satellite data of the urban heat island effects in Asian mega cities. Int J Appl Earth Obs 2006; 8(1): 34-48. [http://dx.doi.org/10.1016/j.jag.2005.05.003] |
| [21] | Gallo KP, McNab AL, Karl TR, Brown JF, Hood JJ, Tarpley JD. The use of a vegetation index for assessment of the urban heat island effect. Remote Sens 1993; 14(11): 2223-30. [http://dx.doi.org/10.1080/01431169308954031] |
| [22] | Gallo KP, Owen TW. Assessment of urban heat islands: A multi-sensor perspective for the Dallas-Ft. Worth, USA region. Geocarto Int 1998; 13(4): 35-41. [http://dx.doi.org/10.1080/10106049809354662] |
| [23] | Weng Q, Lu D, Schubring J. Estimation of land surface temperature: Vegetation abundance relationship for urban heat island studies. Remote Sens Environ 2004; 89(4): 467-83. [http://dx.doi.org/10.1016/j.rse.2003.11.005] |
| [24] | van Wijngaarden WA, Mouraviev A. Seasonal and annual trends in Australian minimum/maximum daily temperatures. TOASJ 2016; 10(1): 39-55. [http://dx.doi.org/10.2174/1874282301610010039] |
| [25] | Govindankutty M, Chandrasekar A, Bohra AK, George JP, Dasgupta M. The impact of assimilation of MODIS observations using WRF-VAR for the prediction of a monsoon depression during September 2006. TOASJ 2008; 2: 68-78. [http://dx.doi.org/10.2174/1874282300802010068] |
| [26] | Kaufman YJ, Tanré D, Boucher O. A satellite view of aerosols in the climate system. Nature 2002; 419(6903): 215-23. [http://dx.doi.org/10.1038/nature01091] [PMID: 12226676] |
| [27] | Kou X, Jiang L, Bo Y, Yan S, Chai L. Estimation of land surface temperature through blending MODIS and AMSR-E data with the Bayesian maximum entropy method. Remote Sens 2016; 8(2): 105. [http://dx.doi.org/10.3390/rs8020105] |
| [28] | Zhao S, Zhou D, Liu S. Data concurrency is required for estimating urban heat island intensity. Environ Pollut 2016; 208(Pt A): 118-24. [http://dx.doi.org/10.1016/j.envpol.2015.07.037] [PMID: 26243476] |
| [29] | Liu K, Su H, Li X, Wang W, Yang L, Liang H. Quantifying spatial–temporal pattern of urban heat island in Beijing: An improved assessment using land surface temperature (LST) time series observations from LANDSAT, MODIS, and Chinese new satellite GaoFen-1. IEEE J-Stars 2016; 9(5): 2028-42. |
| [30] | Tan M, Li X. Quantifying the effects of settlement size on urban heat islands in fairly uniform geographic areas. Habitat Int 2015; 49: 100-6. [http://dx.doi.org/10.1016/j.habitatint.2015.05.013] |
| [31] | Swain D, Roberts GJ, Dash J, Vinoj V, Lekshmi K, Tripathy S. Impact of rapid urbanization on the microclimate of Indian cities: A case study for the city of Bhubaneswar. Proceedings, SPIE Asia-Pacific Remote Sensing Conference 2016; 98772X. |
| [32] | Elhacham E, Alpert P. Impact of coastline-intensive anthropogenic activities on the atmosphere from moderate resolution imaging spectroradiometer (MODIS) data in Dubai (2001–2014). Earths Futur 2016; 4(3): 54-61. [http://dx.doi.org/10.1002/2015EF000325] |
| [33] | Zhuo H, Liu Y, Jin J. Improvement of land surface temperature simulation over the Tibetan Plateau and the associated impact on circulation in East Asia. Atmos Sci Lett 2016; 17(2): 162-8. [http://dx.doi.org/10.1002/asl.638] |
| [34] | Zhou C, Wang K. Land surface temperature over global deserts: Means, variability, and trends. J Geophys Res Atmos 2016; 121(14): 344-57. |
| [35] | Lensky IM, Dayan U. Satellite observations of land surface temperature patterns induced by synoptic circulation. Int J Climatol 2015; 35(2): 189-95. [http://dx.doi.org/10.1002/joc.3971] |
| [36] | Martínez D, Jiménez MA, Cuxart J, Mahrt L. Heterogeneous nocturnal cooling in a large basin under very stable conditions. Boundary-Layer Meteorol 2010; 137(1): 97-113. [http://dx.doi.org/10.1007/s10546-010-9522-z] |
| [37] | Lensky IM, Dayan U. Detection of fine-scale climatic features from satellites and implications for agricultural planning. Bull Am Meteorol Soc 2011; 92(9): 1131-6. [http://dx.doi.org/10.1175/2011BAMS3160.1] |
| [38] | Holtslag AA, Svensson G, Baas P, et al. Stable atmospheric boundary layers and diurnal cycles: Challenges for weather and climate models. Bull Am Meteorol Soc 2013; 94(11): 1691-706. [http://dx.doi.org/10.1175/BAMS-D-11-00187.1] |
| [39] | Jin M, Dickinson RE. Land surface skin temperature climatology: Benefitting from the strengths of satellite observations. Environ Res Lett 2010; 5(4): 044004. [http://dx.doi.org/10.1088/1748-9326/5/4/044004] |
| [40] | Kloog I, Chudnovsky A, Koutrakis P, Schwartz J. Temporal and spatial assessments of minimum air temperature using satellite surface temperature measurements in Massachusetts, USA. Sci Total Environ 2012; 432: 85-92. [http://dx.doi.org/10.1016/j.scitotenv.2012.05.095] [PMID: 22721687] |
| [41] | Zhu W, Lű A, Jia S. Estimation of daily maximum and minimum air temperature using MODIS land surface temperature products. Remote Sens Environ 2013; 130: 62-73. [http://dx.doi.org/10.1016/j.rse.2012.10.034] |
| [42] | Kilibarda M, Hengl T, Heuvelink G, et al. Spatio-temporal interpolation of daily temperatures for global land areas at 1 km resolution. J Geophys Res Atmos 2014; 119(5): 2294-313. [http://dx.doi.org/10.1002/2013JD020803] |
| [43] | Blandford TR, Humes KS, Harshburger BJ, Moore BC, Walden VP, Ye H. Seasonal and synoptic variations in near-surface air temperature lapse rates in a mountainous basin. J Appl Meteorol Climatol 2008; 47: 249-61. [http://dx.doi.org/10.1175/2007JAMC1565.1] |
| [44] | Imhoff ML, Zhang P, Wolfe RE, Bounoua L. Remote sensing of the urban heat island effect across biomes in the continental USA. Remote Sens Environ 2010; 114: 504-13. [http://dx.doi.org/10.1016/j.rse.2009.10.008] |
| [45] | Peng S, Piao S, Ciais P, et al. Surface urban heat island across 419 global big cities. Environ Sci Technol 2012; 46(2): 696-703. [http://dx.doi.org/10.1021/es2030438] [PMID: 22142232] |
| [46] | Brinkhoff T. The principal agglomerations of the world 2006. Available at: http://www.adb.orghttp:// www.citypopulation.de |
| [47] | The Moderate Resolution Imaging Spectroradiometer https://www.nasa.gov/. Accessed on: 03 April |
| [48] | Remer LA, Kleidman RG, Levy RC, et al. Global aerosol climatology from the MODIS satellite sensors. J Geophys Res-Atmos (1984–2012) 2008; 113: D14S07. |
| [49] | Zhang J, Reid JS, Holben BN. An analysis of potential cloud artifacts in MODIS over ocean aerosol optical thickness products. Geophys Res Lett 2005; 32: L15803. [http://dx.doi.org/10.1029/2005GL023254] |
| [50] | The MODIS 8-day 1-km LST. Available at: https://giovanni.sci.gsfc.nasa.gov/ giovanni/ [Accessed on: 03 April 2017]. |
| [51] | Roth M, Oke TR, Emery WJ. Satellite-derived urban heat islands from three coastal cities and the utilization of such data in urban climatology. Int J Remote Sens 1989; 10(11): 1699-720. [http://dx.doi.org/10.1080/01431168908904002] |
| [52] | Lebassi B, Gonzalez J, Fabris D, et al. Observed 1970-2005 cooling of summer daytime temperatures in coastal California. J Clim 2009; 22(13): 3558-73. [http://dx.doi.org/10.1175/2008JCLI2111.1] |
| [53] | Price C, Michaelides S, Pashiardis S, Alpert P. Long term changes in diurnal temperature range in Cyprus. Atmos Res 1999; 51(2): 85-98. [http://dx.doi.org/10.1016/S0169-8095(99)00022-8] |
| [54] | Lal M, Harasawa H. Future climate change scenarios for Asia as inferred from selected coupled atmosphere-ocean global climate models. J Meteorol Soc Jpn 2001; 79(1): 219-27. [http://dx.doi.org/10.2151/jmsj.79.219] |
| [55] | Kumar KR, Kumar KK, Pant GB. Diurnal asymmetry of surface temperature trends over India. Geophys Res Lett 1994; 21(8): 677-80. [http://dx.doi.org/10.1029/94GL00007] |
| [56] | Yoshino M. Global warming and urban climates: report of the Research Center for Urban Safety and Security, Kobe University Special Report No. 1. Proceedings of the Second Japanese-German Meeting 1998; Klima Analyse fur die Stadtplanung 1998; 123-4. |
| [57] | Roth M. Review of urban climate research in (sub) tropical regions. Int J Climatol 2007; 27(14): 1859-73. [http://dx.doi.org/10.1002/joc.1591] |