- Home
- About Journals
-
Information for Authors/ReviewersEditorial Policies
Publication Fee
Publication Cycle - Process Flowchart
Online Manuscript Submission and Tracking System
Publishing Ethics and Rectitude
Authorship
Author Benefits
Reviewer Guidelines
Guest Editor Guidelines
Peer Review Workflow
Quick Track Option
Copyediting Services
Bentham Open Membership
Bentham Open Advisory Board
Archiving Policies
Fabricating and Stating False Information
Post Publication Discussions and Corrections
Editorial Management
Advertise With Us
Funding Agencies
Rate List
Kudos
General FAQs
Special Fee Waivers and Discounts
- Contact
- Help
- About Us
- Search


The Open Atmospheric Science Journal
(Discontinued)
ISSN: 1874-2823 ― Volume 14, 2020
Assimilation of GPS Radio Occultation Data for Tropical Cyclogenesis: A Case Study in the Eastern Atlantic
Keren Rosado1, *, Sen Chiao2
Abstract
Aim:
This study aimed to investigate the impact of using Global Positioning System Radio Occultation (GPS RO) sounding data (i.e., Constellation Observing System for Meteorology, Ionosphere, and Climate; COSMIC) for Tropical Cyclogenesis (TC-genesis) research.
Methods:
The Weather Research and Forecasting (WRF-ARW) model and the WRF data assimilation system (i.e., WRF 3DVAR) were employed to simulate Tropical Depression- 8 (TD8) 2006. A noteworthy feature about TD8-genesis was that Saharan dust outbreak was also observed during this period, which made this event more sophisticated. The time frame to be focused on was from 1200 UTC September 09 to 1200 UTC September 12, 2006. The level 2 wetPrf COSMIC data was adopted in this research. A 72-hour integration wasperformed with initial and time-dependent lateral boundary conditions derived from the NCEP final analysis data (FNL). A 2-domain nested simulation was configured with 30 km, and10 km horizontal resolutions, respectively.
Results:
Simulation results from all the experiments performed with different RO soundings combination showed that the RO sounding 8 has the greatest significant impact on TD8 simulation.
Conclusion:
Elevation, time, and location are the parameters that made RO sounding 8 the most treasured sounding to analyze TD8.
Article Information

Identifiers and Pagination:
Year: 2018Volume: 12
First Page: 33
Last Page: 47
Publisher Id: TOASCJ-12-33
DOI: 10.2174/1874282301812010033
Article History:
Received Date: 13/12/2017Revision Received Date: 1/4/2018
Acceptance Date: 13/4/2018
Electronic publication date: 30/04/2018
Collection year: 2018
open-access license: This is an open access article distributed under the terms of the Creative Commons Attribution 4.0 International Public License (CC-BY 4.0), a copy of which is available at: https://creativecommons.org/licenses/by/4.0/legalcode. This license permits unrestricted use, distribution, and reproduction in any medium, provided the original author and source are credited.
* Address correspondence to this author at the Department of Atmospheric Science, Howard University, NOAA/ESRL 325 Broadway Boulder, CO 80305-3337, Washington, DC, USA; Tel: (303) 497-5907; E-mail: keren.rosado@howard.edu
| Open Peer Review Details | |||
|---|---|---|---|
| Manuscript submitted on 13-12-2017 |
Original Manuscript | Assimilation of GPS Radio Occultation Data for Tropical Cyclogenesis: A Case Study in the Eastern Atlantic | |
1. INTRODUCTION
The Constellation Observing System for Meteorology, Ionosphere, and Climate (COSMIC) mission was created to improve atmospheric sounding from space. The mission is a collaborative project by University Corporation for Atmospheric Research (UCAR) in the United State and National Space Organization (NSPO) in Taiwan. Six microsatellites were launched on April 15, 2006, at an altitude of 512 km (actual altitude 800km). All of these satellites produce approximately 2,500 soundings every day. The data obtained is regarding water vapor, ionosphere vertical profiles, climate, global forecast, and tropospheric moisture and temperature [1Eiserloh AJ, Chiao S. Modeling studies of landfalling atmospheric rivers and orographic precipitation over northern California. Meteorol Atmos Phys 2015; 127: 1-16.
[http://dx.doi.org/10.1007/s00703-014-0350-4] -3Schreiner B, Hunt D, Rocken C, Sokolovskiy S. First CHAMP mission results for gravity, magnetic and atmospheric studies: Radio occultation data processing at the COSMIC data analysis and archival center 2003.]. These microsatellites were designed to provide data using the Global Positioning System (GPS) Radio Occultation RO Technique [4Cucurull L, Li R, Peevey TR. Assessment of radio occultation observations from the COSMIC-2 mission with a simplified observing system simulation experiment configuration. Mon Weather Rev 2017; 145: 3581-97.
[http://dx.doi.org/10.1175/MWR-D-16-0475.1] -6Syndergaard S, Kursinski ER, Herman BM, Lane EM, Flittner DE. A refractive index mapping operator for assimilation of occultation data. Mon Weather Rev 2005; 133(9): 2650-68.
[http://dx.doi.org/10.1175/MWR3001.1] ].
This research investigates how the COSMIC data (i.e., level 2 werPrf) affect the forecasts of tropical cyclone formation, and how accurate (or vice versa) is the forecast compared to the observations. We intend to determine their value to short-term regional forecasts; with an emphasis on the forecast of TC-genesis that was heavily affected by dust outbreak.
The impact on COSMIC data in tropical cyclones has been studied in the past with promising results for tropical cyclones forecast. Seventy-eight hours forecast for three typhoons that resulted in typhoons warnings for Taiwan in 2008, i.e., Sinlaku, Hagupit, and Jangmi were analyzed using the Weather Research and Forecast (WRF) system with data assimilation from COSMIC data [7Hsiao LF, Chen DS, Kuo YR, et al. Application of WRF 3DVAR to operational typhoon prediction in Taiwan: Impact of outer loop and partial cycling approaches. Weather Forecast 2015; 27: 1249-63.
[http://dx.doi.org/10.1175/WAF-D-11-00131.1] ]. Results from their investigation showed that the forecast with COSMIC data assimilation reduced track and intensity errors. They concluded that the COSMIC data provided a much needed environmental data in the northwest Pacific ocean basin producing a forecast with less track and intensity errors. Chen et al. 2015 [8Chen YC, Hsieh ME, Hsiao LF, et al. Systematic evaluation of the impacts of GPSRO data on the prediction of typhoons over the northwestern Pacific in 2008-2010. Atmos Meas Tech 2015; 8: 2531-41.
[http://dx.doi.org/10.5194/amt-8-2531-2015] ], analyzed 327 tropical cyclones cases over the northwest Pacific ocean for the years 2008-2010 using the Typhoon Weather Research and Forecast (TWRF) system with data assimilation from COSMIC data. By assimilating COSMIC data, typhoons track forecast had been improved by 5% in the 72-hours forecast due to the more reliable water vapor and temperature values [8Chen YC, Hsieh ME, Hsiao LF, et al. Systematic evaluation of the impacts of GPSRO data on the prediction of typhoons over the northwestern Pacific in 2008-2010. Atmos Meas Tech 2015; 8: 2531-41.
[http://dx.doi.org/10.5194/amt-8-2531-2015] ]. Also, results from another study by Biondi et al. 2015 [9Biondi R, Steiner AK, Kirchengast G, Rieckh T. Characterization of the thermal structure and conditions for overshooting of tropical and extratropical cyclones with GPS radio occultation. Atmos Chem Phys 2015; 15: 5181-93.
[http://dx.doi.org/10.5194/acp-15-5181-2015] ] showed that COSMIC RO data contributed to better forecast tropical cyclones thermal structure.
The case study analyzed was Tropical Depression 8 (TD8) later hurricane Helene 2006 (Fig. 1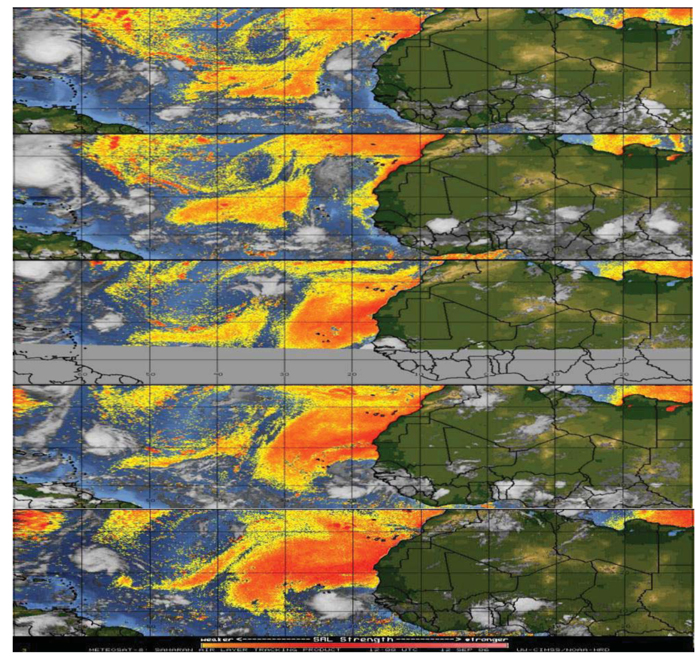 ); During the early morning hours of September 12, an African easterly wave in association with a Mesoscale Convective System (MCS) transposed over the Eastern Atlantic (12.5°N–18°W). Subsequently, a deep convection rapidly developed with the system [10Brown DP. Tropical cyclone report hurricane helene (AL082006) 12-24 September 2006 2006.]. It is interesting that intense convection is developed in such close proximity to the thermodynamically stable atmosphere associated with the Saharan Air Layer (SAL) [11Dunion JP, Velden CS. The impact of the Saharan air layer on Atlantic tropical cyclone activity. Bull Am Meteorol Soc 2004; 85(3): 353-65.
[http://dx.doi.org/10.1175/BAMS-85-3-353] , 12Prospero JM, Carlson TN. Vertical and areal distributions of Saharan dust over the western equatorial North Atlantic Ocean. J Geophys Res 1972; 77(27): 5255-65.
[http://dx.doi.org/10.1029/JC077i027p05255] ]. The time frame to be focused is from 09 1200 UTC to 12 1200 UTC, September 2006. The analyzed area covers latitudes 3°S-32°N and longitudes 41°W-25°E.

In the following sections, the methodology and data employed in this research are explained, followed by the experimental setups, results and discussion. At the end, our conclusions are explained as supported by the results of the previous experiments.
2. METHODOLOGY AND DATA
The Weather Research and Forecasting (WRF-ARW) model and the WRF data assimilation system (i.e., WRF 3DVAR) version 3.2.1 were employed in this research. WRF-ARW is a mesoscale numerical weather prediction model, fully compressible, and non-hydrostatic (WRF-ARW User Guide, April, 2011).
2.1. Control (CTRL) Experiment
A 72-hour simulation was required in order to better simulate the evolution of TD8-genesis. The initial and time-dependent later boundary conditions were derived from The National Center for Environmental Prediction (NCEP) Final Operational Global Analysis data (FNL) forecasts. This data was on 1.0° × 1.0° degree grids prepared operationally every six hours. A 2-domain nested simulation was configured with 30 km and 10 km horizontal resolutions for domains 1 and 2 respectively (Fig. 2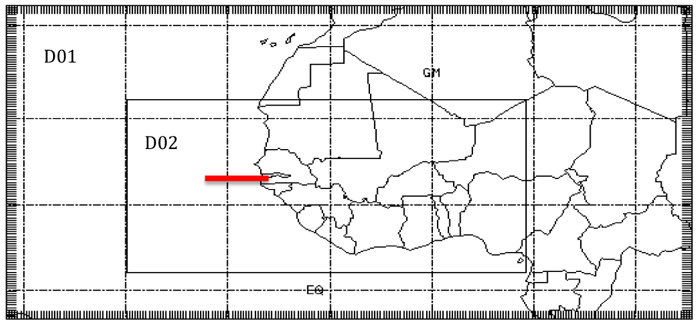 ). The two domains were set up to capture the transition from continental e.g. MCS to maritime system e.g. tropical wave at a different resolution from the central western Africa to the eastern Atlantic Ocean. The parent domain 1 location was (D1; 3°S-32°N, 41°W-25°E) with grid points west/east (i direction) 241, south/north (j direction) 134 and the inner domain 2 (D2) grid points are west/east (i direction) 421, south/north (j direction) 220 located at (3-22°N, 30°W-9°E).
 |
Fig. (2) Domain resolution set up: D1-30 km and D2-10 km. Red line cross section localization of the relative humidity and meridional winds. |
This simulation used was a 90 second time step. The microphysics Goddard 6-class scheme was applied for the two domains in this simulation with a cumulus parameterization Grell 3D ensemble scheme applied only in the 30-km resolution [13Tao WK, Simpson J, Baker D, et al. Microphysics, radiation and surface processes in the Goddard Cumulus Ensemble (GCE) model. Meteo Atm Phy 2003; 82: 97-137.
[http://dx.doi.org/10.1007/s00703-001-0594-7] , 14Grell AG, Dévényi D. A generalized approach to parameterizing convection combining ensemble and data assimilation techniques. J Geophys Res 2002; 29(14): 38.]. The Planetary Boundary Layer (PBL) scheme used for this study was the Yonsei University PBL scheme. Short and longwave radiation schemes were Goddard and Rapid Radiative Transfer Model (RRTM) [15Chou MD, Suarez MJ. An efficient thermal infrared radiation parameterization for use in general circulation models 1994; 3: 85., 16Mlawer EJ, Taubman SJ, Brown PD, Iacono MJ, Clough SA. Radiative transfer for inhomogeneous atmosphere: RRTM, a validated correlated-k model for the long-wave. J Geophys Res 1997; 102(D14): 16663-82.
[http://dx.doi.org/10.1029/97JD00237] ] respectively.
2.2. COSMIC-All Experiment
The experimental set up of the COSMIC-All experiment is the same as the CTRL experiment but with the COSMIC data assimilation. The initial and time-dependent lateral boundary conditions were derived from the COSMIC wetPrf level 2 data with nine RO soundings available for D01. “Level 2 is a post-processed data that provides atmospheric profiles of refractivity, temperature and water vapor. These profiles are based on 1D variational analysis using European Center for Medium Range Weather Forecasting (ECMWF) low-resolution analysis data (found in the ecmPrf files). The ecmPrf files provide temperature, pressure, and moisture profiles generated from the ECMWF gridded analysis and collocated with occultation profiles. These profiles are used by the COSMIC Data Analysis and Archival Center (CDAAC) post-processing system as a first guess for determining moisture below 10 km and for comparison purposes.” (For more details visit: www.cosmicio.cosmic.ucar.edu) In this experiment, the pre-processing was done using WRF Data Assimilation (WRFDA 3DVAR). Table 1 summarizes the two experiments and its corresponding model, version, and data assimilated.
 |
Fig. (3) From the seventy-two hours simulation: the most significant results Sep 11 1200UTC to Sep 12 1200UTC sea level pressures every 12 hours, CRTL (left) and COSMIC-All (right) experiments. |
3. RESULTS
3.1. Sea Level Pressure (SLP)
After 72 hours simulation, the most noteworthy changes were observed between September 11 and September 12 at 1200 UTC (Fig. 3 ). During these 24 hours period, the MCS (continental system) transitioned to a tropical wave (maritime system) followed by TC-genesis. The simulated SLP from the COSMIC-All experiment (Fig. 3) shows that the location is more consistent with the Meteo-France Rapid Developing Thunderstorm (RDT) Product Analysis (not shown) and the low-pressure center of CTRL at 1200 UTC September 12 was near 13.5°N, and 19.0°W. Nevertheless, the best track as reported by National Hurricane Center (NHC) for this case at 1200 UTC 12 Sep was at 11.9°N, and 22.0°W [10Brown DP. Tropical cyclone report hurricane helene (AL082006) 12-24 September 2006 2006.]. The COSMIC-All experiment showed a local minimum pressure of 976 hPa located at 13°N and 21.5°W at 1200 UTC on September 12 (Table 3). In this experiment, the tropical cyclone intensifies and the speed of motion is faster than the CTRL experiment.
3.2. Relative Humidity
An exhaustive analysis of the Relative Humidity (RH) has been done for the CTRL and COSMIC-All experiments in order to analyze where is the location of the drier and moisture air. East to West cross sections of the RH from the surface up to 10km were done to better analyze the moisture content and the interaction during the development of TD8 from an MCS, AEW, and later TD8. The vertical cross-section localization is shown in Fig. (2) (i.e., red line). Also, the northerly (dashed lines) and southerly wind speeds (solid lines) were analyzed to understand the wind fields around the system. The following analysis depicts the life cycle of this event based on Fig. (4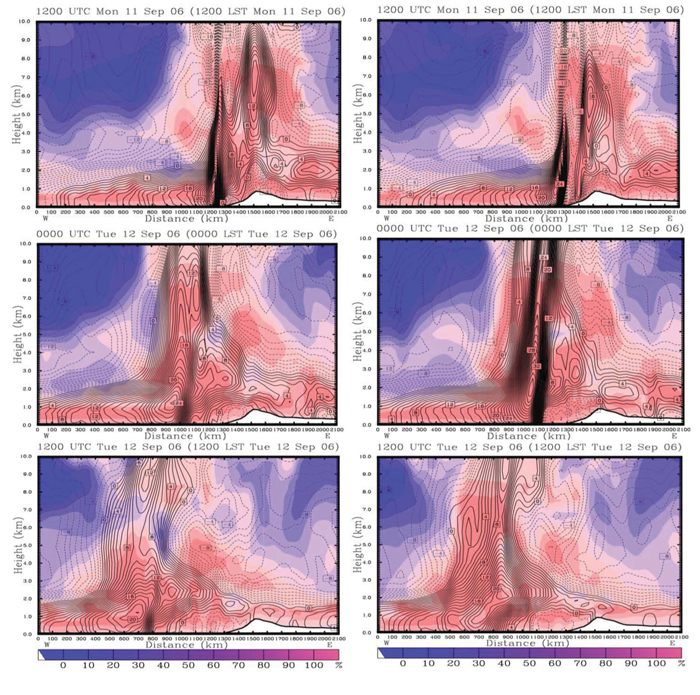 ). The northerly winds carried dry air. This dry air was associated with the SAL that was located to the north of the system. Based on the location of the SAL, the air on the northern side of the system was drier. On the other hand, high RH values were observed in the southern quadrant.
 |
Fig. (4) Simulated E-W cross section from surface up to 10km RH and N-S winds from Sep 11 1200UTC to Sep 12 1200UTC every 12 hours, CRTL (left) and COSMIC-All (right) experiments. |
3.3. Winds
A possible explanation of the more intense TD8 simulation could be the winds. Fig. (5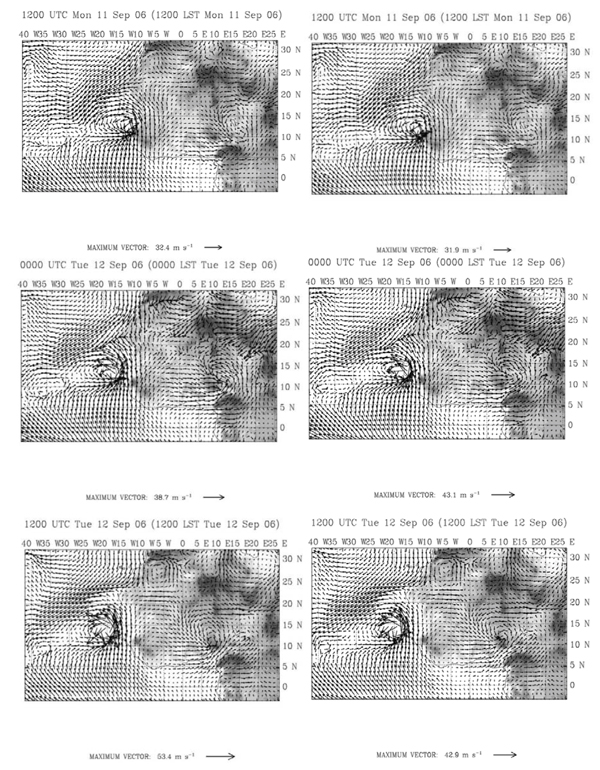 ) shows wind vectors and topography (gray color over land). The CTRL experiment was conducted on the left; the COSMIC-All experiment was conducted on the right. The CTRL experiment, in general, (Fig. 5) shows a tendency of less intense maximum wind vectors compared to the COSMIC-All experiment.

What is more important about these winds is the trajectory. In both the experiments, the wind trajectories were observed to be similar, i.e., the place from where the winds were coming and where they were heading . During the transition period from the MCS to an AEW, and later TD8 a SAL outbreak took place to the north of the MCS (Fig. 1). At the time of SAL outbreak, i.e., the first eighteen hours of the simulation, Sep 09 1200 UTC – Sep 10 0600 UTC, the winds were going south into the MCS. These winds were carrying drier air into the MCS. This is consistent with Fig. (4) where some drier air was observed into the MCS. Parallel to this, the air located south of the MCS had a high amount of moisture e.g. high RH (Fig. 4). The winds located in this moist air were from the southwest and brought moisture into the MCS. Later in the simulation (e.g., Sep 10 1200 UTC – Sep 12 1200 UTC), the direction of the winds over the SAL started to change more westerly (west-southwest), moving away from the AEW later TD8. The winds located in the moisture area had no significant changes. These winds speeds and trajectories results were corroborated with the winds observed by QuickSCAT satellite (Fig. 6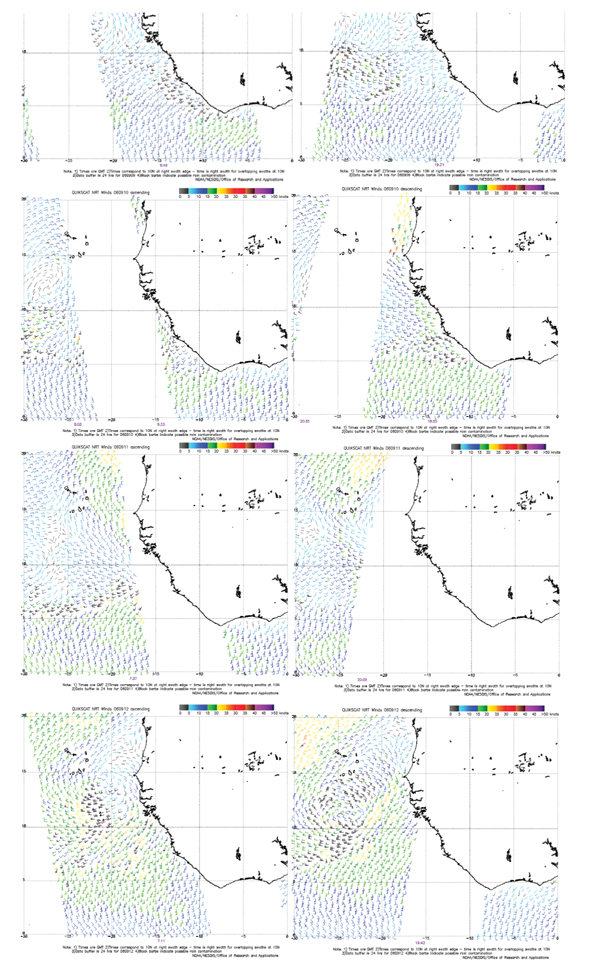 ).
).
 |
Fig. (6) http://manati.orbit.nesdis.noaa.gov/datasets/QuikSCATData.php QuickSCAT wind bars from Sep 09 through 12, 2006. Left satellite ascending path and right satellite descending path. Winds over the ocean surface are Near Real Time (NRT); times are in Greenwich Mean Time (GMT); times correspond to 10N at right swath edge time is right awath for overlapping awaths at 10N; data buffer is twenty four hours for 060909, 060910, 0609011, and 060912; and black barbs indicate possible rain contamination. Wind vectors 15 X 30 (25km). |
3.4. Increments
In order to evaluate the difference between the CTRL and the COSMIC-All experiment, the increments were calculated per each vertical level (i.e., 28 vertical levels) at the initial time of the simulation e.g. Sep 09 1200 UTC (Fig. 7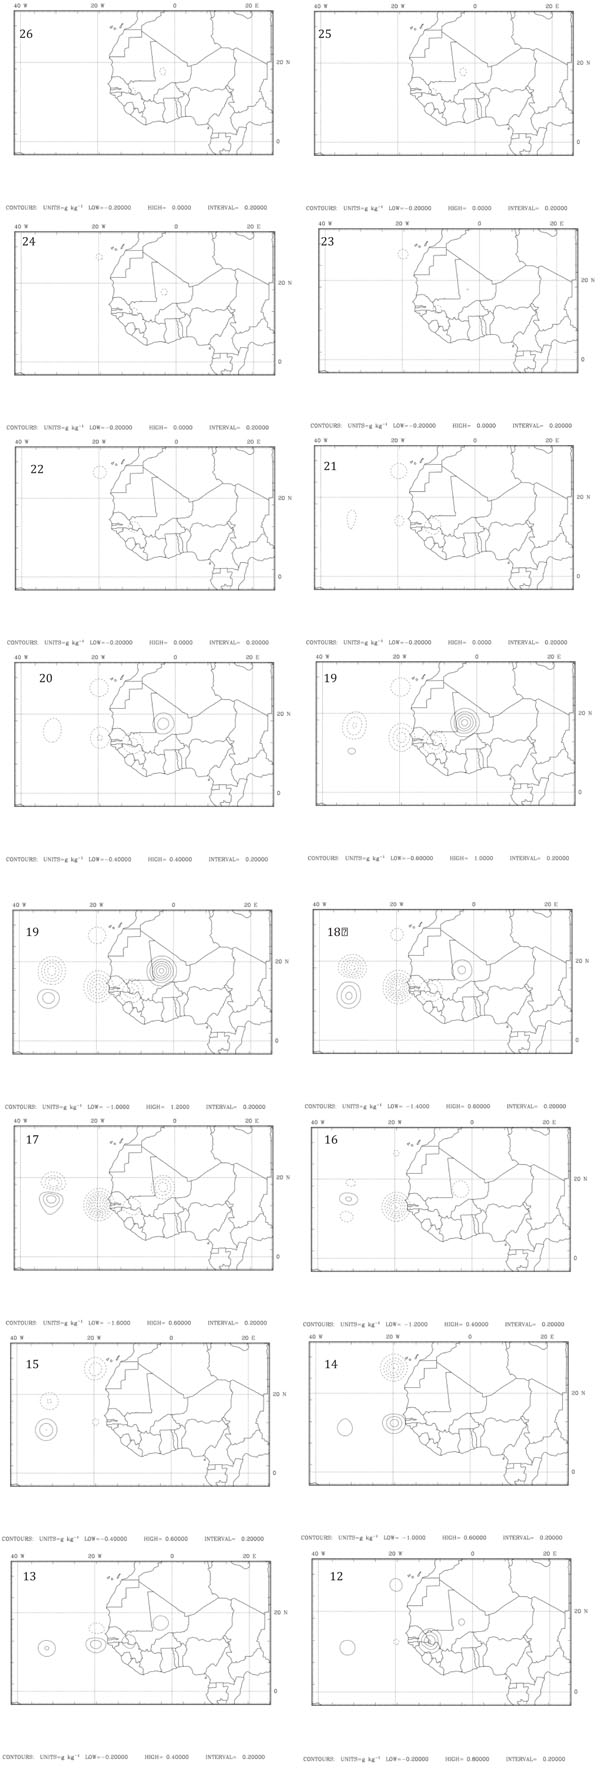 ). The dashed lines represent the amount of drier air as greater in the CTRL experiment compared to the COSMIC-All experiment. The opposite is true; the solid lines represent that the amount of moisture air is greater in the COSMIC-All experiment compared to the CTRL experiment. There is a pattern observed in all the water vapor mixing ratio differences. The pattern observed showed a difference between the experiments at localized areas. These localized areas are in agreement with the location of the nine RO soundings (Fig. 8
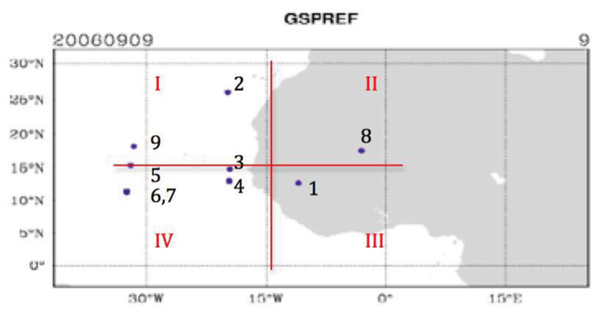 ). The increments in water vapor mixing ratio started at eta level 26. The levels 27 (1002 hPa) and 11 (126 hPa) through 1 (0 hPa) are not shown because there was no difference between both experiments in terms of water vapor mixing ratio.

 |
Fig. (8) RO sounding distribution in D01, each blue dot represent the location of the RO sounding, each black number refers to the sounding information and, the red romans number shows the Quadrant. |
The following discussion is based on Fig. (7). At level 26 (990 hPa) and 25 (976 hPa), a small area of drier air is located in the same place over the west coast of Africa. The same area of drier air observed in levels 26 and 25 was observed in level 24 as well, but with an additional region of drier air located over the ocean 10°N 20°W. At level 23 (933 hPa), the area of drier air located over land in the previous levels no longer existed (e.g., at this level there is no difference between the experiments in terms of water vapor mixing ration). At the same level, the area over the ocean observed on the previous level, i.e., level 24 (958 hPa) 10°N 20°W was observed too, but with an increment in size. Starting from level 22 (905 hPa), the amounts of drier air over land differed greatly . In level 19 (775 hPa), an area of 0.4 g kg-1 with more moisture in air than the CTRL was observed over land. This area of more moisture air in the COSMIC-All experiment can be associated with the MCS that was around that area at the initial time of the simulation. The same area of moisture air observed in the previous level intensified in the subsequent level, i.e., 18 (716 hPa) and 17 (652 hPa) with maximum moisture difference of 1.2 g kg-1 having more moisture than the CTRL experiment. Parallel to this difference in the moisture of air over land, areas of drier air were observed to be at west to the area of humid air and over water. At level 16 (583 hPa), there was not much moisture in the air associated with the COSMIC-All experiment over land. In this level, the most significant feature was observed right out of the west coast of Africa with a drier air (i.e., -1.0 g kg-1) associated with the CTRL experiment. Some difference over land between the two experiments was observed at level 13 (384 hPa). At this level, more moisture in the air was observed in general with only one area of drier air over the ocean. The area of humid air observed at level 13 was observed at level 12 (328 hPa) as well, but in this level, the moisture difference was greater than the one observed at level 12 (i.e., 0.4 g kg-1 and 0.8 g kg-1 respectively). This area of moisture over land started decreasing the moisture at level 11 with 0.6g/kg which decreased even more at level 10 (230 hPa) with 0.2 g kg-1 (not shown).
4. DISCUSSION
After simulating TD8, i.e., COSMIC-All experiment data with all the nine RO soundings included in the initial forecast time, the forecasted genesis of TD8 was too strong (987 hPa) compared to observations (1007 hPa). In order to better understand the impact of the data that is provided by the RO soundings, different combinations of RO soundings as well as their individual impact were analyzed (Table 2).

4.1. COSMIC Four-quadrant Experiment
Domain one was divided into a Cartesian plane (Fig. 8). First quadrant longitude (lon) 33°-16°W; latitude (lat) 15°-30°N, second quadrant lon 16°W-3°E; lat 15°-30°N, third quadrant lon 16°W-3°E; lat 15°N-0° and, fourth quadrant lon 16°-33°W lat ; 15°N-0°. Based on the Cartesian plane set up, the soundings were distributed as follows: first quadrant sounding 2, 5 and, 9; second quadrant sounding 8; third quadrant sounding 1; fourth quadrant soundings 3, 4, 6, and, 7.
After generating the later boundary conditions for each quadrant, the COSMIC Four-Quadrant experiment was simulated with the same parameterizations than the CTRL experiment. Results from this experiment showed that the most accurate simulation in terms of intensity and location was Quadrant II (981 hPa; lat 12°N; lon 20°W) and Quadrant III (986 hPa; lat 13°N; lon 18.5°W). Since each of these two Quadrants only has one observation, an evaluation of each individual RO soundings was required. The complete sea level minimum pressures and location results for this experiment are shown in Table 3.

4.2. COSMIC-individual Experiment
An evaluation of each of the nine RO soundings was made in order to evaluate the following: how the location of the RO sounding (distance between RO sounding and the MCS) affected the first guest; the RO sounding level reached into the lower troposphere. The experimental set up is the same as the CTRL Experiment. Results from this experiment show that the best outcomes in terms of intensity and location were observed when compared to observation made at RO soundings 4 (985 hPa; lat 13°N; lon 20°W) and 8 (981 hPa; lat 12°N; lon 20°W). The complete sea level minimum pressures and location results for this experiment are shown in Table 4.
4.3. COSMIC-SAL Experiment
A series of simulations was designed in order to evaluate the impact of the drier air on the simulation. This experiment consisted of carrying out different combinations of the two better RO soundings, i.e., RO sounding 4 and 8 with the RO sounding located in the area of drier air, i.e., RO sounding 2. From the results of these different combinations, we cannot make the statement that one combination performed better than another; there was no improvement in terms of intensity. The experiment with RO soundings 4 and 8 provided better results in terms of location compared to the observations (lat 13°N; lon 20.5°W). In order to identify the most valuable RO sounding, the following parameters were evaluated: the elevation (how low reached RO into the lower troposphere, e.g., 2km above surface), the time when the RO took place compared to the initialized time (first guess), levels of the RO, and location of the RO, e.g., closer to the MCS at the time of the first guess. After comparing these two RO soundings, the RO sounding with less uncertainty is the RO sounding 8. The RO sounding 8 reached an elevation of 400 m above the surface, in time 11:51:58 (closer to first guess; simulation start 12:00), with level 311, and at the beginning of evaluation, the MCS was located around latitude 12°N longitude 2°E (RO sounding location latitude 17.544 °N longitude 2.980 °E; Fig. 9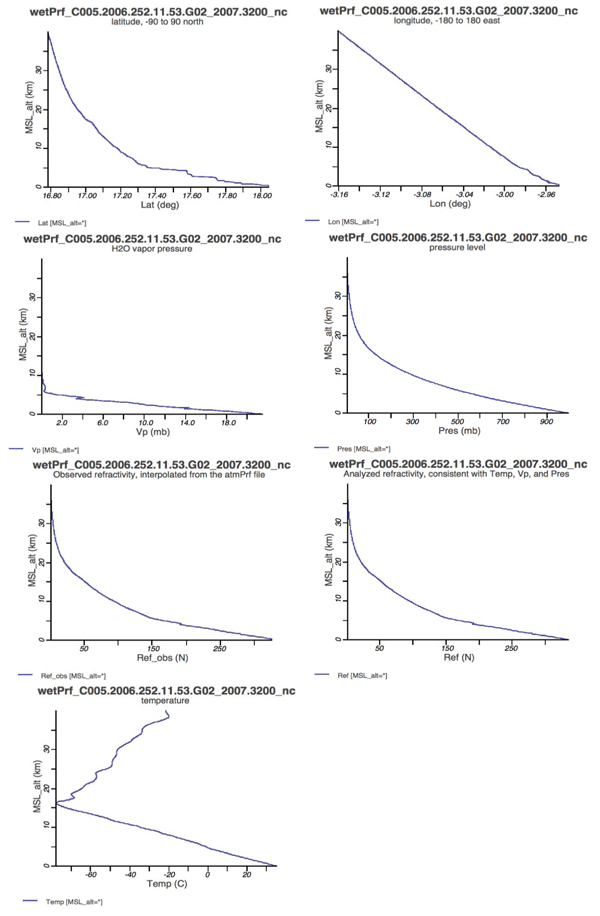 ). See Table 5 for complete results of this experiment.
 |
Fig. (9) RO sounding 8: latitude, longitude, water vapor pressure, pressure level, observed refractivity, analyzed refractivity, and temperature. |
CONCLUSION
This investigation was designed to examine how the COSMIC data (i.e., level 2 werPrf) affects the forecasts of tropical cyclone formation, and how accurate (or vice versa) the forecasts are compared to the observations, with an emphasis on the forecast of TD8 that was heavily affected by a dust outbreak.
Tropical Depression 8, as the AEW and vortex moved out over the Eastern Atlantic (12.5°N 18°W) during the early morning hours of September 12th, with deep convection rapidly developed with the system. It is interesting that intense convection developed in such close proximity to the thermodynamically stable atmosphere associated with the SAL [10Brown DP. Tropical cyclone report hurricane helene (AL082006) 12-24 September 2006 2006., 11Dunion JP, Velden CS. The impact of the Saharan air layer on Atlantic tropical cyclone activity. Bull Am Meteorol Soc 2004; 85(3): 353-65.
[http://dx.doi.org/10.1175/BAMS-85-3-353] ]. This investigation was accomplished by a seventy-two-hour simulation, showing the transition from continental, i.e., MCS to maritime system, i.e., AEW later TD8 (Hurricane Helene 2006) took place. The WRF-ARW model and the WRF data assimilation system (i.e., WRF 3DVAR) were employed in this research.
An evaluation was done of the impact of the different environmental conditions (e.g., sea level pressure, relative humidity, and winds), which affect TC genesis. Also, the impact of the nine RO soundings on TC genesis was evaluated.
The CTRL experiment simulation was established utilizing the FNL data. Since the CTRL experiment simulated TD8 well in terms of intensity, it was compared with the COSMIC-All experiment during the rest of the investigation. The COSMIC data wetPrf (Refractivity) was successfully assimilated into the WRF model for simulating TD8. The COSMIC data provides a better distribution of the moisture available in the atmosphere during the TC genesis stage of this event. By analyzing the sea level pressure in the CTRL and COSMIC-All experiments, the minimum pressure simulated using COSMIC-All data at the time was the AEW classified as TD8 which showed a more intense TD8 in both the domains. The minimum pressure was 983 hPa and 987 hPa for CTRL and COSMIC-All experiments, respectively. The simulated sea level pressure from the CTRL experiment (Fig. 3) shows that the intensity is more consistent with the previously mentioned RDT. Nevertheless, the simulation using the COSMIC-All data improved the location of TD8 in terms of lat and lon with a lat 13°N and lon 21.5°W versus observations of lat 11.9°N and lon 22.0°W at Sep 12 1200UTC.
The relative humidity and meridional winds show that the COSMIC-All experiment had more dry air after comparing the same areas with the CTRL experiment (Fig. 4). The opposite is true for the moisture areas. The COSMIC-All experiment shows more moisture areas compared with the CTRL experiment. Observing Fig. (4), the northerly and southerly winds are more intense in the COSMIC-All experiment. These wind enhancements by the COSMIC data can explain why TD8 simulation using the COSMIC data was more intense.
Wind verification took place between the simulations and the winds observed with the QuickSCAT satellite. The winds simulated in both the experiments agree with the winds observed with the QuickSCAT satellite (Fig. 6). What is most important about these winds is the trajectory. In both the experiments, the wind trajectories were observed to besimilar, e.g., where the winds came from and where did they go . During the three-day simulation, southeasterly flow was into the system (observations). In the southern part of the MCS later, TD8 an area with high RH was observed. The winds in the COSMIC-All experiment are stronger than the CTRL and observations. Based on this, it can be hypothesized that the stronger winds bring more moisture into the system making TD8 more intense. In the northern part of the system, an area of drier air was observed associated with the SAL. The winds in the area where the low RH was located were northeasterly, moving the drier air away from the MCS. The wind trajectory shows that the winds coming from the north (Fig. 5), e.g., carrying drier air from the SAL outbreak (Fig. 1) move away from the MCS, west trajectory. On the other hand, the winds located in the moisture area, e.g., south of the MCS, move into the MCS later TD8 (Fig. 5).
In order to understand the cause or the causes of why the COSMIC-All experiment intensified faster than the CTRL, more extensive simulations were conducted. In order to accomplish this task, a series of experiments was designed to evaluate how many COSMIC soundings should be assimilated in order to have a more accurate simulation. The experiments were as follows: COSMIC Four-Quadrant D01 was divided in to a Cartesian plane (Fig. 8); COSMIC-Individual, an evaluation for each of the nine RO soundings; COSMIC-SAL different combination of the two better RO soundings, i.e., RO sounding 4 and 8 with the RO sounding located in the area of drier air, i.e., RO sounding 2 (Fig. 8). All of these experiments were designed with the same setup as the CTRL but with different combinations of RO soundings as initial conditions. From all the experiments performed with the different RO soundings combination, the RO sounding that has the greatest significant impact on the TD8 simulation was RO sounding 8 (Fig. 9). The RO sounding 8 reached an elevation of 400 m above the surface, in time 11:51:58 (closer to first guess; simulation start 12:00), at level 311, and at the beginning of the evaluation, the MCS was located around latitude 12°N longitude 2°E (RO sounding location latitude 17.544 °N longitude 2.980 °E). From these results, we can conclude that the following parameters need to be fulfilled in order to improve the simulation:
- Time: The RO sounding time needs to be close enough to the time on which the experiment is going to be started.
- Elevation: How deep does the RO sounding reaches into the lower troposphere ? (e.g., 2km above surface).
- Levels: How many levels does the RO sounding have? (e.g., vertical level).
As for future work, the following points are suggested. There is some evidence that the RO technique had some negative bias in the lower levels of the atmosphere [3Schreiner B, Hunt D, Rocken C, Sokolovskiy S. First CHAMP mission results for gravity, magnetic and atmospheric studies: Radio occultation data processing at the COSMIC data analysis and archival center 2003.]. Based on that, a series of experiments can be performed by deleting the information provided by RO sounding for the low atmosphere. A cycling run needs to be performed as well, where the initial condition is updated as many times as desired (e.g., twenty-four hours and then run the WRFV3 to forecast the forty-eight hours left). The uncertainties in this cycling run are going to be less due to more data ingested into the model. A simulation using WRF-Chemistry and COSMIC data is suggested as well to evaluate how the COSMIC simulation behaves without the dust (drier air). As a final suggestion, an experiment using 4DVAR with the COSMIC data should be performed.
CONSENT FOR PUBLICATION
Not applicable.
CONFLICT OF INTEREST
The authors declare no conflict of interest, financial or otherwise.
ACKNOWLEDGEMENTS
We acknowledge the suppliers of datasets employed in this research. This research was supported by NSF AGS-0855286, and NASA contract# NNX15AQ02A.
REFERENCES
| [1] | Eiserloh AJ, Chiao S. Modeling studies of landfalling atmospheric rivers and orographic precipitation over northern California. Meteorol Atmos Phys 2015; 127: 1-16. [http://dx.doi.org/10.1007/s00703-014-0350-4] |
| [2] | Fong CJ, Yang SK, Chu CH, et al. FORMOSAT-3/COSMIC constellation spacecraft system performance: After one year in orbit. IEEE Trans Geosci Remote Sens 2008; 46(11): 3380-94. [http://dx.doi.org/10.1109/TGRS.2008.2005203] |
| [3] | Schreiner B, Hunt D, Rocken C, Sokolovskiy S. First CHAMP mission results for gravity, magnetic and atmospheric studies: Radio occultation data processing at the COSMIC data analysis and archival center 2003. |
| [4] | Cucurull L, Li R, Peevey TR. Assessment of radio occultation observations from the COSMIC-2 mission with a simplified observing system simulation experiment configuration. Mon Weather Rev 2017; 145: 3581-97. [http://dx.doi.org/10.1175/MWR-D-16-0475.1] |
| [5] | Kursinski ER, Hajj GA, Schofield JT. Lin- Field RP, Hardy KR. Observing earth’s atmosphere with radio occultation measurements using the global positioning system. J Geophys Res 1997; 102(D19): 23429-65. [http://dx.doi.org/10.1029/97JD01569] |
| [6] | Syndergaard S, Kursinski ER, Herman BM, Lane EM, Flittner DE. A refractive index mapping operator for assimilation of occultation data. Mon Weather Rev 2005; 133(9): 2650-68. [http://dx.doi.org/10.1175/MWR3001.1] |
| [7] | Hsiao LF, Chen DS, Kuo YR, et al. Application of WRF 3DVAR to operational typhoon prediction in Taiwan: Impact of outer loop and partial cycling approaches. Weather Forecast 2015; 27: 1249-63. [http://dx.doi.org/10.1175/WAF-D-11-00131.1] |
| [8] | Chen YC, Hsieh ME, Hsiao LF, et al. Systematic evaluation of the impacts of GPSRO data on the prediction of typhoons over the northwestern Pacific in 2008-2010. Atmos Meas Tech 2015; 8: 2531-41. [http://dx.doi.org/10.5194/amt-8-2531-2015] |
| [9] | Biondi R, Steiner AK, Kirchengast G, Rieckh T. Characterization of the thermal structure and conditions for overshooting of tropical and extratropical cyclones with GPS radio occultation. Atmos Chem Phys 2015; 15: 5181-93. [http://dx.doi.org/10.5194/acp-15-5181-2015] |
| [10] | Brown DP. Tropical cyclone report hurricane helene (AL082006) 12-24 September 2006 2006. |
| [11] | Dunion JP, Velden CS. The impact of the Saharan air layer on Atlantic tropical cyclone activity. Bull Am Meteorol Soc 2004; 85(3): 353-65. [http://dx.doi.org/10.1175/BAMS-85-3-353] |
| [12] | Prospero JM, Carlson TN. Vertical and areal distributions of Saharan dust over the western equatorial North Atlantic Ocean. J Geophys Res 1972; 77(27): 5255-65. [http://dx.doi.org/10.1029/JC077i027p05255] |
| [13] | Tao WK, Simpson J, Baker D, et al. Microphysics, radiation and surface processes in the Goddard Cumulus Ensemble (GCE) model. Meteo Atm Phy 2003; 82: 97-137. [http://dx.doi.org/10.1007/s00703-001-0594-7] |
| [14] | Grell AG, Dévényi D. A generalized approach to parameterizing convection combining ensemble and data assimilation techniques. J Geophys Res 2002; 29(14): 38. |
| [15] | Chou MD, Suarez MJ. An efficient thermal infrared radiation parameterization for use in general circulation models 1994; 3: 85. |
| [16] | Mlawer EJ, Taubman SJ, Brown PD, Iacono MJ, Clough SA. Radiative transfer for inhomogeneous atmosphere: RRTM, a validated correlated-k model for the long-wave. J Geophys Res 1997; 102(D14): 16663-82. [http://dx.doi.org/10.1029/97JD00237] |