- Home
- About Journals
-
Information for Authors/ReviewersEditorial Policies
Publication Fee
Publication Cycle - Process Flowchart
Online Manuscript Submission and Tracking System
Publishing Ethics and Rectitude
Authorship
Author Benefits
Reviewer Guidelines
Guest Editor Guidelines
Peer Review Workflow
Quick Track Option
Copyediting Services
Bentham Open Membership
Bentham Open Advisory Board
Archiving Policies
Fabricating and Stating False Information
Post Publication Discussions and Corrections
Editorial Management
Advertise With Us
Funding Agencies
Rate List
Kudos
General FAQs
Special Fee Waivers and Discounts
- Contact
- Help
- About Us
- Search


The Open Electrical & Electronic Engineering Journal
(Discontinued)
ISSN: 1874-1290 ― Volume 13, 2019
The Calculation and Optimization Research of Renewable Energy Investment Efficiency under Uncertain Conditions
Tao Yi1, Yifan Zhang1, *, Yanfeng Guo2
Abstract
Background:
In the renewable energy investment market, there are risks such as fossil fuel price fluctuations, environmental risks caused by pollutant emissions, electricity price fluctuations caused by energy policies, and so on, which bring certain difficulties to measure the investment efficiency.
Methods:
In this regard, the paper applies the portfolio theory to the Data Envelopment Analysis (DEA) model to evaluate investment efficiency. First of all, the Monte Carlo method is used to simulate the four uncertain factors of fuel unit price, feed-in tariff, annual operating hours, and carbon price, so as to quantitatively measure the risk and return of different power generation. According to the portfolio theory, it evaluates the portfolio risks and returns, respectively as input and output indicators, so as to build a Data Envelopment Analysis (DEA) model to estimate investment efficiency.
Conclusion:
The simulation and experimental results demonstrate the effectiveness of the presented method. In details, we select a poor efficiency sample, and then, we propose an optimization measure to improve the efficiency. By adjusting the proportion of its investment, the result proves that increasing the proportion of renewable energy can realize optimization and validity of renewable energy investment. Thus, it provides auxiliary support for the investment decision of renewable energy and realizes the coordinated allocation and efficient utilization of renewable energy.
Article Information

Identifiers and Pagination:
Year: 2018Volume: 12
First Page: 52
Last Page: 62
Publisher Id: TOEEJ-12-52
DOI: 10.2174/1874129001812010052
Article History:
Received Date: 16/3/2018Revision Received Date: 16/7/2018
Acceptance Date: 20/7/2018
Electronic publication date: 31/08/2018
Collection year: 2018
open-access license: This is an open access article distributed under the terms of the Creative Commons Attribution 4.0 International Public License (CC-BY 4.0), a copy of which is available at: https://creativecommons.org/licenses/by/4.0/legalcode. This license permits unrestricted use, distribution, and reproduction in any medium, provided the original author and source are credited.
* Address correspondence to this author at the School of Economics and Management, North China Electric Power University, Beijing, Changping District, 102206, China; Tel: +86-13718807916; E-mail: 1944506154@qq.com
| Open Peer Review Details | |||
|---|---|---|---|
| Manuscript submitted on 16-3-2018 |
Original Manuscript | The Calculation and Optimization Research of Renewable Energy Investment Efficiency under Uncertain Conditions | |
1. INTRODUCTION
With the shortage of fossil energy, more and more countries are facing the challenge of energy supply, especially the power industry. According to the “2017 Global Renewable Energy Development Report,” we can see that the new capacity of the global renewable energy power was reinvented to reach 161GW in 2017. China was ranked first in the world in terms of renewable energy investment and installed capacity, which means that China has great potential for renewable energy investment. However, the uncertainty and risk of current coal-based power generation structures are gradually emerging. It is mainly reflected in the following three points.
1.1. Price Fluctuation Risk
There is a contradiction between coal price changes and electricity price control after “coal and electricity linkage”. Since 2009, domestic coal prices have continued to rise and have been operating at a high level, leading excessive growth in fuel costs. The profits of domestic power generation companies, which rely mainly on thermal power, have fallen sharply, even large losses, resulting in increased business risk. Therefore, price fluctuations bring certain uncertainty to power generation investment.
1.2. Environmental Risk of Emissions
The coal-power-based power structure has brought a large amount of greenhouse gas and pollutant emissions. The environmental costs have risen dramatically, which brings great risks to the sustainable development of contemporary society. Moreover, in recent years, the carbon price policy has been regarded as an important means to cope with climate change. In the future, it is possible to influence power generation investment decisions through mandatory restrictions or carbon trading.
1.3. Renewable Energy Policy Risk
China's renewable energy investment has developed well, thanks to strong government support and subsidy policies, as well as the overall strength of the entire industry. The National Development and Reform Commission formulates tariff subsidies for renewable energy such as wind power, photovoltaic power, biomass power, etc. The changes in national policies may stimulate the increase of electricity prices, meanwhile, promote the progress of the renewable energy technology industry. In the changing market environment, renewable energy policy makes the electricity price subject to huge uncertainty.
Faced with uncertainty in the future energy market, renewable energy has obvious advantages due to its universality and availability. The environmental cost is almost zero and the investment risk is low, because it is unaffected by the price fluctuation of fossil fuel and the clean and pollution-free characteristics. Studies have shown that diversified portfolios can achieve risk hedging and neutralization. Li Ranran [1R. Li, and S. Mei, "Generation portfolio optimization based on portfolio theory", J Sys Manage, vol. 23, no. 6, pp. 854-860.] applied the investment portfolio theory to China's power generation portfolio optimization, combined with renewable energy price subsidies to study the optimal power generation portfolio under different tariffs and carbon taxes, and proposed that diversified power generation methods based on renewable energy generation can reduce overall power generation portfolio risk; Bhattacharya [2A. Bhattacharya, and S. Kojima, "Power sector investment risk and renewable energy: A japanese case study using portfolio risk optimization method", Energy Policy, vol. 40, no. 1, pp. 69-80.
[http://dx.doi.org/10.1016/j.enpol.2010.09.031] ] used Japanese data as an example to study the effects of different levels of electricity prices, carbon taxes, plant size and market size on the optimal power generation portfolio, and analyzed that the introduction of renewable energy investments can reduce system risks. Edelarue [3E. Delarue, C.D. Jonghe, R. Belmans, and W. D’Haeseleer, "Applying portfolio theory to the electricity sector: Energy versus power", Energy Econ., vol. 33, no. 1, pp. 12-23.
[http://dx.doi.org/10.1016/j.eneco.2010.05.003] ] proposed that the introduction of wind power generation can also reduce the risk, considering the variability of wind power and the climbing ability of conventional power plants.
For the uncertainty of the investment portfolio, domestic and foreign scholars have also conducted corresponding researches. Roques et al. [4F.A. Roques, D.M. Newbery, and W.J. Nuttall, "Fuel mix diversification incentives in liberalized electricity markets: A mean–variance portfolio theory approach", Energy Econ., vol. 30, no. 4, pp. 1831-1849.
[http://dx.doi.org/10.1016/j.eneco.2007.11.008] ] utilized Monte Carlo to simulate the benefits of natural gas, coal and nuclear power plants, and then used the results in a portfolio model to study the effective power generation mix of large-scale power plants in the free electricity market. Fuss et al. [5S. Fuss, J. Szolgayová, N. Khabarov, and M. Obersteiner, "Renewables and climate change mitigation: Irreversible energy investment under uncertainty and portfolio effects", Energy Policy, vol. 40, no. 4, pp. 59-68.
[http://dx.doi.org/10.1016/j.enpol.2010.06.061] ] introduced the mean-variance-combination theory into the real options evaluation framework to analyze the impact of market, technology, social and economic uncertainties on the investment decisions of power plants. Zeng Ming et al. [6Z. Ming, Z. Ping, W. Liang, Y. Zhang, and Z. Kun, "The power generation investment evaluation model based on monte carlo simulation under uncertainty", Automat elect Power Syst, vol. 39, no. 45, pp. 54-60.] applied the Monte Carlo simulation method to construct a probability distribution of various uncertainties, including capital cost, fuel, carbon price and load demand, and then the uncertainty was integrated into the portfolio analysis.
The above studies mainly focused on the investment risks and returns, but investment efficiency is a key indicator for measuring the appropriateness of resource allocation. There have been a lot of researches about it at home and abroad. Zhou Zhongbao and Ding Hui [7Z. Zhou, D. Hui, C. Ma, W. Mei, and W. Liu, "Portfolio efficiency estimation method considering the transaction cost ", Chinese Manage Sci, vol. 23, no. 1, pp. 25-33.] used the data-based portfolio DEA model to construct the frontier surface, and studied the efficiency evaluation of portfolios considering transaction costs. Angelelli E et al. [8E. Angelelli, R. Mansini, and M.G. Speranza, "A comparison of mad and cvar models with real features", J. Bank. Finance, vol. 32, no. 7, pp. 1188-1197.
[http://dx.doi.org/10.1016/j.jbankfin.2006.07.015] ] used CVar and mean absolute deviation to measure risk respectively, and established a corresponding mixed integer linear programming model, Optimizing the portfolio of securities; Yu and Lee [9J.R. Yu, and W.Y. Lee, "Portfolio rebalancing model using multiple criteria", Eur. J. Oper. Res., vol. 209, no. 2, pp. 166-175.
[http://dx.doi.org/10.1016/j.ejor.2010.09.018] ] proposed a series of multi-objective programming methods to guide investment decisions under the V-type transaction costs, to determine the portfolio model and obtain the optimal solution through fuzzy multi-objective planning; Moeini [10M. Moeini, "DC programming approach for portfolio optimization under step increasing transaction costs", Optimization, vol. 58, no. 3, pp. 267-289.
[http://dx.doi.org/10.1080/02331930902741721] ] considered the gradual increase of transaction cost to form a situation similar to multifaceted convex function, and constructed the corresponding portfolio model.
Through the above analysis, we can see that researches on investment efficiency mainly concentrated in the field of securities investment, and rarely involved in the field of renewable energy investment; In addition, they were based on complex mathematical derivation, and the real frontier was difficult to obtain, which brought great difficulties for the calculation of portfolio efficiency. So, DEA is introduced to assess portfolio efficiency based on real frontiers.The innovation of this paper is the application of DEA method to the renewable energy field, it can expand the application field of DEA, which provides a simple measurement method for renewable energy portfolio efficiency; This paper applies the portfolio theory to the DEA model, defines the portfolio efficiency based on the investment efficiency, and uses Monte Carlo simulation to simulate the risk and return of different power generation portfolio.
The second part of the article is on the basis of the traditional deterministic model, and uses the Monte Carlo method to simulate four uncertain factors: fuel price, feed-in tariff, annual operating hours, carbon price, and quantitatively measures the risks and returns of different power generation. The third part is based on the DEA model and takes seven regions of North China, Northeast China, East China, Central China, Northwestern China, South China, and China as the research object. It considers the ratio of newly installed power generation capacity as a portfolio. The DEA model is constructed by combining risk and return as input and output indicators. The simulation and experimental results demonstrate the versatility and practicality of the model. Further, by analyzing the investment efficiency, it puts forward optimization measures, which provide certain auxiliary decision-making for optimizing renewable energy investment; Section 4 presents the corresponding conclusion.
2. MATERIAL AND METHODS
2.1. Deterministic Model Construction
2.1.1. Measurement of Power Generation Cost
In this paper, the total power generation cost of various power generation methods consists of three parts: production cost, external cost and CO2 cost.
2.1.1.1. Production Cost
The production cost depends on factors such as construction costs, fuel costs, operating and maintenance costs, finance costs and operating hours, mainly includes investment costs, operation and maintenance costs and fuel costs in three parts. The cost of power generation as shown in Eq. (1):
 |
(1) |
Where I is the initial investment cost of power generation (yuan / kW), H donates the annual operating hours (h), a is the present value of annuity, co represents the operation and maintenance costs (yuan / kW), ks is the unit of electricity consumption (kg / kWh), p is the fuel unit price (yuan / kg).
The data of different power plants are shown in Table 1, of which thermal, nuclear, hydropower, wind power and solar power data, respectively, are estimated according to the literature [11X. Wang, "The social cost analysis of electricity supply", China Energy, vol. 32, no. 7, pp. 37-40.-15Y. Sun, W. Run, L. Xiao, L. Jian, and Y. Yu, "The economical and environmental benefits of china’s grid-connected photovoltaic power generation system”, Population", Resources Environment, vol. 21, no. 4, pp. 88-94.].

2.1.1.2. External Cost
The external cost is the environmental cost, which is the cost of the enterprise in order to avoid the economic loss. In this paper, we use the method of literature [16Shuying Ding, Qingyu Zhang, and Lina Pan, "Study on the cost calculation method of power generation environment", in China Association of Electrical Engineering, Clean and Efficient Coal fired Power Generation Technology, 2010, pp.1-4.] to calculate the unit environmental cost of pollutants by Ecosense model. By calculating the emissions of nitrogen oxides, sulfides, soot and other pollutants, the environmental costs of various power generation are estimated as shown in Table 2.

2.1.1.3. CO2 Cost
Greenhouse gas emissions will be caused by the use of equipment and fuel consumption in the whole life cycle of construction, operation and retirement. Yet, the generation mode of renewable energy can reduce the consumption of fossil fuels, cut down the emission of greenhouse gases, and decrease the cost of power generation to a certain extent. The CO2 cost is calculated by Eq. (2).
 |
(2) |
Where CO2 emission factor is the CO2 emissions per unit of power generation, which cites the reference [17L. Xiawei, Q. Tan, Z. Wen, X. Ma, and J. Ji, "Analysis of the potential and cost of greenhouse gas emissions reduction in china’s power generation industry life cycle", J Peking University, vol. 49, no. 5, pp. 885-891. [Natural Science Edition].]. With the increase of carbon emission reduction pressure, it is possible to introduce a carbon tax in the future. The paper uses carbon tax instead of carbon cost. According to the proposal of China's Ministry of Environmental Planning Institute, 20 yuan per ton of CO2 emissions is taxed at the initial stage. Table 3 depicts the CO2 costs of different types of power generation.

The power generation costs of five different types are summarized in Table 4.

2.1.2. Measurement of Power Generation Return
Due to the imperfect market mechanism, the generation cost of renewable energy is higher than the conventional energy, so renewable energy such as hydropower, wind and solar power need to be subsidized by the National Renewable Energy Development Fund.
The revenue of conventional power generation (including thermal power and nuclear power) are obtained by the Eq.(3). Otherwise, the return of renewable energy generation is calculated by the Eq.(4). Different types of power generation have different subsidy policies. Table 5 summarizes the feed-in tariffs and subsidies for renewable energy in China and shows the benefits of various power generation, based on the literature [18Y.Y. Qing, Y-X. Sun, C. Qin, and Z.F. Tan, "The pricing model for transmission and distribution tariff under different voltage levels based on the long-run marginal cost method", Open Electr. Electron. Eng. J., vol. 9, no. 1, pp. 347-354.
[http://dx.doi.org/10.2174/1874129001509010347] ].
 |
(3) |
 |
(4) |

2.2. Risk and Return Measurements Taking into Account Uncertainty Factors
The above model of power generation revenue is a deterministic model, in which each variable is fixed. However, in the actual production and operation, various power generation technologies will have great uncertainty in the power supply. Based on the deterministic investment model, we introduce the fuel unit price, feed-in tariffs, annual operating hours and carbon price as uncertain factors, using Monte Carlo Method to construct uncertainty risk and return model.
The basic steps are as follows:
(1) Building a probability distribution model of various uncertainties. For the uncertainties, the best probability distribution parameters are fitted according to their respective historical data.
(2) Using Monte Carlo method to simulate the data. This paper uses Crystal Ball simulation software. The Monte Carlo simulation will be performed using the Latin Hypercube sampling algorithm to solve the above optimization problem [19Y.W. Hu, "Sequential monte carlo method toward online rul assessment with applications", Chin. J. Mech. Eng., vol. 31, no. 1, .
[http://dx.doi.org/10.1186/s10033-018-0205-x] , 20K. Goswami, and B.G. Kim, "A design of fast high efficiency video coding (hevc) scheme based on markov chain monte carlo model and bayesian classifier", IEEE Trans. Ind. Electron., vol. 65, no. 11, pp. 8861-8871.
[http://dx.doi.org/10.1109/TIE.2018.2815941] ]. The whole optimization process, based on the mathematical search algorithm, runs the spreadsheet data until the set running times and finally produces the predicted value.
Through the simulation of uncertainties, we can get the average and standard deviation of return of different power generation. In this paper, we measure the return by the average and weigh the risk by the standard deviation.
2.3. DEA Portfolio Efficiency Evaluation
Data Envelopment Analysis (DEA) is a common method to evaluate the efficiency of portfolio based on the true frontier, mainly including the Constant Returns to Scale (CRS) and Variable Returns to Scale (VRS) model. The efficiency calculated by CRS model is called the Technical Efficiency (TE), which includes the component of scale efficiency; The efficiency obtained from VRS model is known as pure technical efficiency (PTE), excluding the impact of scale [21W. Zhu, and Y. Yu, "Sun and Panpan, ” Data envelopment analysis cross-like efficiency model for non-homogeneous decision-making units: The case of United States companies’ low-carbon investment to attain corporate sustainability", Eur. J. Oper. Res., vol. 269, no. 1, pp. 99-110.
[http://dx.doi.org/10.1016/j.ejor.2017.08.007] -23D. Chen, "Feng and Xiaojun, “Empirical study on the measurement of the high-tech industry efficiency in China--Based on the data of china’s 31 provinces (including municipalities and autonomous regions", 3rd International Conference on Education and Education Management (EEM), vol. vol 26, pp. 27-31.]. By comparing the efficiency values of VRS and CRS, the Scale Efficiency (SE) can be separated, as described in Eq. (5).
 |
(5) |
This CRS model based on input is commonly used to evaluate TE. A detailed description of the methodology is here presented:
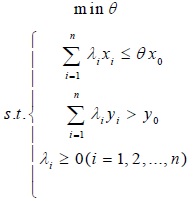 |
Where x is the input index, y is the output index, (x0, y0 ) represents the Decision Making Unit (DMU) to be evaluated. Using the model to evaluate DMU, we can get the DEA efficiency. At present, portfolio theory is applied to the DEA model [24Y.J. Zhang, and M.Y. Chen, "Evaluating the dynamic performance of energy portfolios: Empirical evidence from the DEA directional distance function", Eur. J. Oper. Res., vol. 269, pp. 64-78.
[http://dx.doi.org/10.1016/j.ejor.2017.08.008] ]. There are n power generation portfolios, i.e.M1 (σ1, r1),
M2 (σ2, r2),…,Mi (σi, ri), …,Mn (σn, rn). Where σi and ri respectively represent the risk and return of the ith power generation technology. According to the newly installed capacity proportion, a portfolio of five power generation technologies is constructed including thermal, nuclear, hydropower, wind and solar power generation. In order to evaluate the portfolio in different regions, the paper describes renewable energy portfolio with combined expected return E(rj) and portfolio risk V(rj), as depicted in Eq.(6) and Eq.(7), where 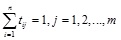 .
.
 |
(6) |
 |
(7) |
Assuming there are m DMUs, that is, m kinds of combinations, and count these m points as,  . Now, V(rj) and E(rj), respectively, represent for the input and output indicators for the jth DMU. The validity of DMU Qj can be evaluated as follows:
 |
Similar method is used to calculate the PTE on the basis of input VRS model, which is different from CRS that constraint  is added. According to the two models, two kinds of efficiency states can be obtained. When θ equals 1, it indicates that the investment unit is valid; and when θ is not equal to 1, namely, the investment unit is invalid.
3. EMPIRICAL ANALYSIS
3.1. Basic Data Preparation
On the basis of the deterministic model in chapter 2, the risk and income model, which considers the uncertain factors, is first built.According to the model construction steps, firstly, the probability distribution model is established considering the uncertain factors. According to the historical data, field investigation and advice from different types of power plants, the distribution of fuel unit price, electricity price and annual running hours is shown in Table 6.

Because of the change of carbon price, we use the existing data to simulate the distribution of carbon price on the basis of the trend of European Union (EU) carbon emission fluctuation. Based on the EU carbon price of European Climate Exchange, the carbon price within one month from April 17, 2017 to May 17, 2017 is selected as the basic data. It can be seen in Fig. (1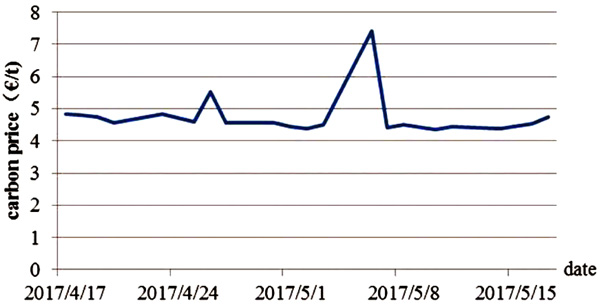 ). Then, simulations are performed using Monte Carlo software to obtain the distribution, as shown in Table 7.
 |
Fig. (1) Carbon emissions trading prices of European Climate Exchange. |

Chi-square test is used to sort out the distribution, which is the method of deviating the actual sample from the theoretical inference [25G.E. Gilbert, and S. Prion, "Making sense of methods and measurement: The chi-square test", Clin. Simul. Nurs., vol. 12, no. 5, pp. 145-146.
[http://dx.doi.org/10.1016/j.ecns.2015.12.013] ]. The discrepancy between actual observation and theoretical inference determines the size of the chi-square value. The larger the chi-square value, the less consistent, and vice versa [26N. Pandis, "The chi-square test", Am. J. Orthod. Dentofacial Orthop., vol. 150, no. 5, pp. 898-899.
[http://dx.doi.org/10.1016/j.ajodo.2016.08.009] [PMID: 27871717] ]. It can be seen in Table 8 that the carbon price obeys the lognormal distribution and the parameters are: mean value = 4.75, standard deviation = 0.66. To sum up, the probability distribution of uncertain factors of different power generation can be obtained, as described in Table 8.

Secondly, the Monte Carlo method is used to simulate the data. In this paper, the number of simulations N is 5000. After running 5000 times with Crystal Ball software, statistical analysis of the results sets is carried out, as shown in Table 9.

When constructing DEA efficiency evaluation model, this paper chooses the newly installed capacity of seven different regions in North China, Northeast China, East China, Central China, Northwest, South China and the whole country as the research object.According to the “China Electric Power Industry Annual Development Report” published by the China Electricity Council (CEC) in August 2017, by the end of 2016, new installed capacity in the different region is depicted in Fig. (2 ).
).
 |
Fig. (2) New installed capacity ratio of sub-regional type in 2016. |
According to different power generation installed capacity proportion as shown in Fig. (2), combining Eq.(6) and Eq.(7), a portfolio of five power generation technologies is constructed, including thermal power, nuclear power, hydropower, wind power and solar power. The return and risk of seven portfolio DMUs in North China, Northeast China, East China, Central China, Northwest, South China and whole country data as shown in Table 10.

3.2. Analysis of Simulation Results
The paper evaluates portfolio efficiency using Max DEA software, taking the combined risk and return as the input and output index. Then, the technical efficiency and pure technical efficiency can be obtained by running CRS model and VRS model respectively. The scale efficiency is calculated according to Eq. (5), and the calculation results are shown in Table 11.

As can be seen from Table 11, the South China region achieves the best in terms of PTE and SE. As the southern region is rich in water resources and large-scale hydropower stations are concentrated, the proportion of single unit capacity 600MW and above exceeds the national average. The wide application of high-capacity unit makes its technology efficient; The Northeast China region technically achieves DEA effectively, mainly due to the large proportion of new energy generation installed capacity, and its proportion of wind power and solar power is at a higher level than other regions. However, in terms of scale, as shown in Fig. (3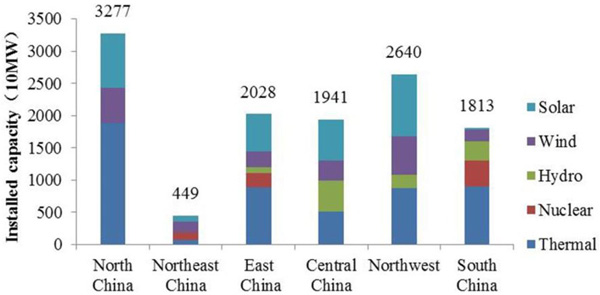 ), the overall installed capacity is small, significantly lower than the national average, and the investment scale needs to be further adjusted to achieve the optimal result.
 |
Fig. (3) New installed capacity of sub-regional type in 2016. |
For other regions, the technical and scale efficiency are not optimized, among which North China region has the lowest efficiency, mainly due to the large thermal power installed capacity and small installed capacity of new energy resources. Now, in order to improve the efficiency, we adjust the proportion of its investment in the way, expanding the proportion of new energy power generation and reducing the thermal power ratio.Taking into account the abundant wind resources in the Inner Mongolia region in the region, the proportion of wind power installed capacity is increased, as shown in Table 12.

According to the same method, the adjusted investment portfolio efficiency can be obtained. It can be seen from Table 13 that the technical efficiency has been improved, which shows that increasing the proportion of new energy can improve the investment efficiency.

Through the analysis of the simulation results, not only can we demonstrate the effectiveness of the presented method, but also propose the investment optimization method. National government departments can step up their support and subsidies for new energy generation. According to reserves of renewable energy and economic development in different regions, the government can selectively increase investment in renewable energy, optimizing investment portfolio of different power generation, thereby enhancing the efficiency of investment in the country.
CONCLUSION
Firstly, this paper uses Monte Carlo method to simulate the uncertainty factors, including fuel unit price, feed-in tariff, annual operating hour, and carbon price, and constructs a portfolio risk and return model. Secondly, we construct a DEA model to evaluate the efficiency of diversified portfolios, using portfolio risks and returns, respectively as input and output indicators. Finally, the newly installed capacity in seven different regions of North China, Northeast China, East China, Central China, Northwest China, South China, and China was taken as the research target. The model is used to calculate the investment efficiency of different regions. The simulation and experimental results demonstrate the effectiveness of the presented method. Meanwhile, we propose an optimization measure to improve the efficiency. By increasing the proportion of renewable energy, the investment efficiency can be increased, so as to provide supplementary support for national investment decisions under environmental policies and market policies.
CONSENT FOR PUBLICATION
Not applicable.
CONFLICT OF INTEREST
The authors declare no conflict of interest, financial or otherwise.
ACKNOWLEDGEMENTS
Decleared none.
REFERENCES
| [1] | R. Li, and S. Mei, "Generation portfolio optimization based on portfolio theory", J Sys Manage, vol. 23, no. 6, pp. 854-860. |
| [2] | A. Bhattacharya, and S. Kojima, "Power sector investment risk and renewable energy: A japanese case study using portfolio risk optimization method", Energy Policy, vol. 40, no. 1, pp. 69-80. [http://dx.doi.org/10.1016/j.enpol.2010.09.031] |
| [3] | E. Delarue, C.D. Jonghe, R. Belmans, and W. D’Haeseleer, "Applying portfolio theory to the electricity sector: Energy versus power", Energy Econ., vol. 33, no. 1, pp. 12-23. [http://dx.doi.org/10.1016/j.eneco.2010.05.003] |
| [4] | F.A. Roques, D.M. Newbery, and W.J. Nuttall, "Fuel mix diversification incentives in liberalized electricity markets: A mean–variance portfolio theory approach", Energy Econ., vol. 30, no. 4, pp. 1831-1849. [http://dx.doi.org/10.1016/j.eneco.2007.11.008] |
| [5] | S. Fuss, J. Szolgayová, N. Khabarov, and M. Obersteiner, "Renewables and climate change mitigation: Irreversible energy investment under uncertainty and portfolio effects", Energy Policy, vol. 40, no. 4, pp. 59-68. [http://dx.doi.org/10.1016/j.enpol.2010.06.061] |
| [6] | Z. Ming, Z. Ping, W. Liang, Y. Zhang, and Z. Kun, "The power generation investment evaluation model based on monte carlo simulation under uncertainty", Automat elect Power Syst, vol. 39, no. 45, pp. 54-60. |
| [7] | Z. Zhou, D. Hui, C. Ma, W. Mei, and W. Liu, "Portfolio efficiency estimation method considering the transaction cost ", Chinese Manage Sci, vol. 23, no. 1, pp. 25-33. |
| [8] | E. Angelelli, R. Mansini, and M.G. Speranza, "A comparison of mad and cvar models with real features", J. Bank. Finance, vol. 32, no. 7, pp. 1188-1197. [http://dx.doi.org/10.1016/j.jbankfin.2006.07.015] |
| [9] | J.R. Yu, and W.Y. Lee, "Portfolio rebalancing model using multiple criteria", Eur. J. Oper. Res., vol. 209, no. 2, pp. 166-175. [http://dx.doi.org/10.1016/j.ejor.2010.09.018] |
| [10] | M. Moeini, "DC programming approach for portfolio optimization under step increasing transaction costs", Optimization, vol. 58, no. 3, pp. 267-289. [http://dx.doi.org/10.1080/02331930902741721] |
| [11] | X. Wang, "The social cost analysis of electricity supply", China Energy, vol. 32, no. 7, pp. 37-40. |
| [12] | Y. Guang, and W. Huang, "Comparison of the cost of conformal verification of nuclear power and coal in china", Economic Management, vol. 32, no. 3, pp. 7-12. |
| [13] | Z. Qiang, and L. Sui, "The calculation method of two-part hydropower hydropower feed in electricity price", J Elect Power Syst Automat, vol. 24, no. 4, pp. 116-119. |
| [14] | M. Zeng, S. Ouyang, H. Shi, and Y. Ge, "Research on multi-stage generation and transmission coordinated planning model considering wind power integration", Open Electr. Electron. Eng. J., vol. 9, no. 1, pp. 141-146. |
| [15] | Y. Sun, W. Run, L. Xiao, L. Jian, and Y. Yu, "The economical and environmental benefits of china’s grid-connected photovoltaic power generation system”, Population", Resources Environment, vol. 21, no. 4, pp. 88-94. |
| [16] | Shuying Ding, Qingyu Zhang, and Lina Pan, "Study on the cost calculation method of power generation environment", in China Association of Electrical Engineering, Clean and Efficient Coal fired Power Generation Technology, 2010, pp.1-4. |
| [17] | L. Xiawei, Q. Tan, Z. Wen, X. Ma, and J. Ji, "Analysis of the potential and cost of greenhouse gas emissions reduction in china’s power generation industry life cycle", J Peking University, vol. 49, no. 5, pp. 885-891. [Natural Science Edition]. |
| [18] | Y.Y. Qing, Y-X. Sun, C. Qin, and Z.F. Tan, "The pricing model for transmission and distribution tariff under different voltage levels based on the long-run marginal cost method", Open Electr. Electron. Eng. J., vol. 9, no. 1, pp. 347-354. [http://dx.doi.org/10.2174/1874129001509010347] |
| [19] | Y.W. Hu, "Sequential monte carlo method toward online rul assessment with applications", Chin. J. Mech. Eng., vol. 31, no. 1, . [http://dx.doi.org/10.1186/s10033-018-0205-x] |
| [20] | K. Goswami, and B.G. Kim, "A design of fast high efficiency video coding (hevc) scheme based on markov chain monte carlo model and bayesian classifier", IEEE Trans. Ind. Electron., vol. 65, no. 11, pp. 8861-8871. [http://dx.doi.org/10.1109/TIE.2018.2815941] |
| [21] | W. Zhu, and Y. Yu, "Sun and Panpan, ” Data envelopment analysis cross-like efficiency model for non-homogeneous decision-making units: The case of United States companies’ low-carbon investment to attain corporate sustainability", Eur. J. Oper. Res., vol. 269, no. 1, pp. 99-110. [http://dx.doi.org/10.1016/j.ejor.2017.08.007] |
| [22] | F.D.S. Fernandes, "C. Stasinakis, and V. Bardarova, “Two-stage DEA-Truncated Regression: Application in banking efficiency and financial development", Expert Syst. Appl., vol. 96, pp. 284-301. [http://dx.doi.org/10.1016/j.eswa.2017.12.010] |
| [23] | D. Chen, "Feng and Xiaojun, “Empirical study on the measurement of the high-tech industry efficiency in China--Based on the data of china’s 31 provinces (including municipalities and autonomous regions", 3rd International Conference on Education and Education Management (EEM), vol. vol 26, pp. 27-31. |
| [24] | Y.J. Zhang, and M.Y. Chen, "Evaluating the dynamic performance of energy portfolios: Empirical evidence from the DEA directional distance function", Eur. J. Oper. Res., vol. 269, pp. 64-78. [http://dx.doi.org/10.1016/j.ejor.2017.08.008] |
| [25] | G.E. Gilbert, and S. Prion, "Making sense of methods and measurement: The chi-square test", Clin. Simul. Nurs., vol. 12, no. 5, pp. 145-146. [http://dx.doi.org/10.1016/j.ecns.2015.12.013] |
| [26] | N. Pandis, "The chi-square test", Am. J. Orthod. Dentofacial Orthop., vol. 150, no. 5, pp. 898-899. [http://dx.doi.org/10.1016/j.ajodo.2016.08.009] [PMID: 27871717] |