- Home
- About Journals
-
Information for Authors/ReviewersEditorial Policies
Publication Fee
Publication Cycle - Process Flowchart
Online Manuscript Submission and Tracking System
Publishing Ethics and Rectitude
Authorship
Author Benefits
Reviewer Guidelines
Guest Editor Guidelines
Peer Review Workflow
Quick Track Option
Copyediting Services
Bentham Open Membership
Bentham Open Advisory Board
Archiving Policies
Fabricating and Stating False Information
Post Publication Discussions and Corrections
Editorial Management
Advertise With Us
Funding Agencies
Rate List
Kudos
General FAQs
Special Fee Waivers and Discounts
- Contact
- Help
- About Us
- Search


The Open Fuels & Energy Science Journal
(Discontinued)
ISSN: 1876-973X ― Volume 11, 2018
Gas-Water Flow Behaviour During Mutual Displacement in Porous Media
Renyi Cao1, *, Junjie Xu2, Xiaoping Yang2, Renkai Jiang3, Changchao Chen1
Abstract
During oilfield development, there exist multi-cycle gas–water mutual displacement processes. This means that a cycling process such as water driving gas–gas driving water–water driving gas is used for the operation of injection and production in a single well (such as foam huff and puff in single well or water-bearing gas storage). In this paper, by using core- and micro-pore scales model, we study the distribution of gas and water and the flow process of gas-water mutual displacement. We find that gas and water are easier to disperse in the porous media and do not flow in continuous gas and water phases. The Jamin effect of the gas or bubble becomes more severe and makes the flow mechanism of multi-cycle gas–water displacement different from the conventional water driving gas or gas driving water processes. Based on experiments of gas–water mutual displacement, the changing mechanism of gas–water displacement is determined. The results indicate that (1) after gas–water mutual displacement, the residual gas saturation of a gas–water coexistence zone becomes larger and the two-phase zone becomes narrower, (2) increasing the number of injection and production cycles causes the relative permeability of gas to increase and relative permeability for water to decrease, (3) it becomes easier for gas to intrude and the invaded water becomes more difficult to drive out and (4) the microcosmic fluid distribution of each stage have a great difference, which caused the two-phase region becomes narrower and effective volume of gas storage becomes narrower.
Article Information

Identifiers and Pagination:
Year: 2017Volume: 10
First Page: 13
Last Page: 22
Publisher Id: TOEFJ-10-13
DOI: 10.2174/1876973X01710010013
Article History:
Received Date: 17/08/2016Revision Received Date: 11/11/2016
Acceptance Date: 13/11/2016
Electronic publication date: 25/01/2017
Collection year: 2017
open-access license: This is an open access article licensed under the terms of the Creative Commons Attribution-Non-Commercial 4.0 International Public License (CC BY-NC 4.0) (https://creativecommons.org/licenses/by-nc/4.0/legalcode), which permits unrestricted, non-commercial use, distribution and reproduction in any medium, provided the work is properly cited.
* Address correspondence to this author at the China University of Petroleum (Beijing), China, Tel: +8610-8973-3218; E-mails: caorenyi@126.com; caorenyi@gmail.com
| Open Peer Review Details | |||
|---|---|---|---|
| Manuscript submitted on 17-08-2016 |
Original Manuscript | Gas-Water Flow Behaviour During Mutual Displacement in Porous Media | |
1. INTRODUCTION
For single-well injection–production operations in oilfield development (such as single-well foam injection, injection–production of water-bearing gas storage), there exists a process of multi-cycle gas–water interactive displacement in the vicinity of injection–production wells that is quite different from the conventional single water driving gas or gas driving water process [1Amiell, P.G.F.; Billotte, J.; Meunier, G.; Arnould, M. The study of alternate and unstable gas-water displacements using a small-scale model. In: SPE Gas Technology Symposium; Society of Petroleum Engineers: Dallas, Texas, 1989. SPE19070
[http://dx.doi.org/10.2118/19070-MS] -5Xu, Z.P.; Jiang, J.X.; Ge, J.T.; Zhang, L.; Chen, K. Dynamic numerical simulation of injection-production in depleted reservoir underground gas storage. Nat. Gas Expl. Dev., 2011, 34(4), 53-55.]. Multi-cycle gas–water interactive displacement refers to the repeated cycling process of water driving gas and gas driving water in the formation with the driving direction continuously changing. For example, the foam plugging water process in the oil well is a gas driving water process, while the production process is a water driving gas process. If the second cycle of foam plugging water process is a gas driving water process, the production process is a water driving gas process repeatedly. In addition, the gas injection and gas production process in an injection–production well of water-bearing gas storage is another example. In winter, the gas production process is a water driving gas process. However, in summer, the gas injection process is a gas driving water process. Currently, little research has been performed in multi-cycle gas–water interactive displacement. The process of multi-cycle gas–water interactive displacement is different from the conventional single water driving gas or gas driving water process. The main reason for the difference is that there exists a great difference in drive mechanism. Several achievements have been realized in the research of continuous gas–water displacement characteristics in porous media, and its relative permeability law has been identified. Nevertheless, during the process of gas–water interactive displacement, gas and liquid are much easier to disperse in porous media and no longer flow in a continuous phase [6He, X.L.; Huang, S.J.; Sun, C.W.; Xu, J.; Zhang, X.; Yang, X. Gas-water relative permeability variation in multi-cycle injection production of underground gas storage in flooded depleted gas reservoir. Oil Gas Storage Transp., 2015, 34(2), 150-153.-8Shi, L.; Liao, G.Z.; Xiong, W.; Shusheng, G.; Tong, G. Gas-water percolation mechanism in an underground storage built on a water-drive sandstone gas reservoir. Nat. Gas Ind., 2012, 32(9), 85-87.]. A strong Jamin effect makes the percolation mechanism of multi-cycle gas–water interactive displacement different from the conventional single water driving gas or gas driving water processes. In this paper, we discussed the characteristics of gas and water distribution by carrying out core- and micro-pore scales physical simulations. What’s more, we discussed the fluid distribution of each stage of mutual cycle gas-water displacement. At last, we measured the relative permeability in the process of gas driving gas so the relative permeability law of gas-water interactive displacement can be confirmed.
2. EXPERIMENTAL MATERIALS, PROCESS AND METHODS
2.1. Sand Pack Model
There is a 20cm×20cm×1cm rectangle shape plexiglass model, the six faces of model were sealed to simulate the closed boundary except two channels to simulate two wells as shown in Fig. (1a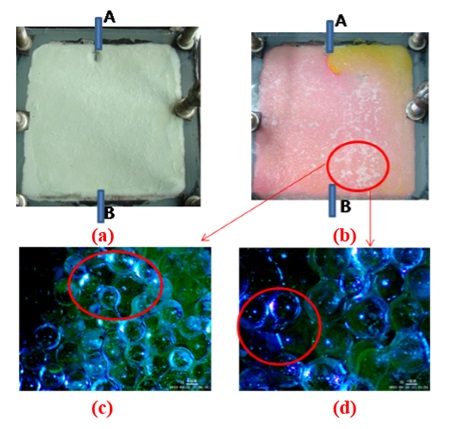 ). The plexiglass model was filled with 120 meshes quartz sand to simulate pore particle, and the permeability of model is almost 500mD. The gas used in experiments is nitrogen and water which dissolved with tony red dye for observation was prepared based on actual formation water, the experimental flow rate is a constant rate of 2ml/min. We can observe the microcosmic percolation characteristics of model by electron microscope.

2.2. Experimental Process
As shown in Fig. (1), first, inject water from entry A to simulate the process of water driving gas (displacement direction is from A to B). Then, inject gas from entry B to simulate the process of gas driving water until there is no water flow from entry A. Repeat the process above for five iterations.
2.3. The Method of Measuring Relative Permeability of Cores
The cores used in this paper got from an underground gas storage in China, named No.2 and No.3, the basic parameters of cores are shown in Table 1. The transient method is used to measure the relative permeability during the gas driving water processes of each cycle.

3. MICROCOSMIC MECHANISM OF MULTI-CYCLE GAS-WATER INTERACTIVE DISPLACEMENT
In Fig. (1), the process of gas–water interactive displacement is simulated by using the visual flat plate model, and the distribution of gas and water is observed [9Peden, J.M.; Husain, M.I. Visual investigation of multiphase flow and phase interactions within porous media. In: SPE Annual Technical Conference and Exhibition; Society of Petroleum Engineers: Las Vegas, Nevada, 1985.
[http://dx.doi.org/10.2118/14307-MS] -11Sun, C.L.; Hou, J.R.; Shi, L.; Liang, C.; Gan, Z. A physical simulation experimental system for injection-withdrawal operation of gas reservoir underground gas storage and its application. Nat. Gas Ind., 2016, 36(5), 58-61.]. Fig. (1) shows the result of the experiment. We can see that after multiple cycles of gas–water interactive displacement, the distribution of gas and water are dispersed within the flat plate model forming a discontinuous phase. Local amplification of the model can be seen from the electron microscope image in Fig. (1). For regions with gas and water distribution, we can see that the gas and water are in a dispersing distribution within a pore scale see Fig. (1c and d).
In the gas injection stage, due to higher viscosity of water, the viscous fingering phenomenon of gas is very obvious. The gas cannot sweep the whole model and flows only along several high-permeability channels as shown in Fig. (2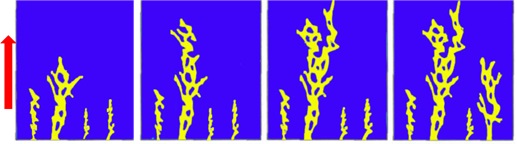 ).
).
 |
Fig. (2) Schematic for gas fingering during gas injection stage (yellow for gas, blue for water), the red arrow shows the direction of displacement. |
Under microscosmic conditions, the migration of gas or water depends on the co-ordination of four types of forces which are referred to as the driving pressure difference (ΔP), capillary force (Pc), friction of liquid flow (Fw) and the highly compressible elastic force of the gas. Therefore, during the process of gas–water interactive displacement, the distribution of gas and water is quite complicated in porous media, making it easy to form a gas–water blockage and leading to a discontinuous distribution of gas and water.
3.1. Water Driving Gas Process of the First Cycle
The water driving gas process of the first cycle corresponds to the gas production in an edge (or bottom) aquifer gas reservoir.
In the region of gas–water coexistence or in the intermediate zone of edge and bottom aquifer, microcosmic distribution of gas and water is shown in Fig. (3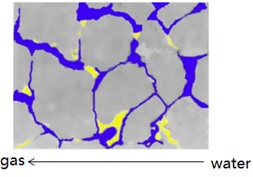 ). Because water is the wetting phase and gas is the non-wetting phase, water is mainly distributed in rock surfaces, small pores and small throats in a continuous phase under the effect of interfacial tension and Pc in the gas–water contact area. Due to the Jamin effect and Pc, residual gas is mainly distributed in the central large pore in a discontinuous phase.
 |
Fig. (3) Microcosmic distribution of gas and water in gas–water contact during the water driving gas process of the first circle (grey for rock, yellow for gas, blue for water, the same below). |
3.2. Gas Driving Water Process of the First Cycle
The gas driving water process of the first cycle corresponds to the process of gas injection in a gas storage rebuilt from a gas reservoir with edge and bottom aquifer. In a gas injection stage, the microcosmic distribution of gas and water in a two-phase coexistence region is shown in Fig. (4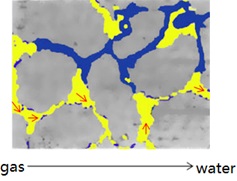 ). Due to drawdown pressure, Pc and the elastic force of gas, water first transports into a continuous pore and throat. The migration of a residual gas bubble might stop within the small pore throat due to the Jamin effect. When ΔP reaches a certain threshold, gas within large pores and throats will break through and continue to transport. The water that exists in the small pores and throats loses its original driving force and remains enclosed in the small pores and throats forming ‘fragmentary water’ or ‘sealed water’. Gas mainly migrates to the big pores and throats and causes a macroscopic fingering phenomenon of gas, Fig. (2).
 |
Fig. (4) Microscopic distribution of gas and water in gas–water contact during the first circle of gas driving water. |
3.3. Water Driving Gas Process of the Second Cycle
The water driving gas process of the second cycle corresponds to the gas production process of gas storage rebuilt from a gas reservoir with edge and bottom aquifer, or a gas production process after foam plugging water. In the gas production of the second cycle, the microcosmic distribution of gas and water in a two-phase coexistence region is shown in Fig. (5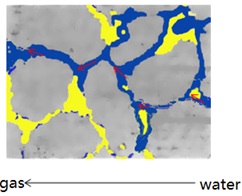 ). With the cooperation of an increasing displacement ΔP, Pc and decreasing formation pressure, the following effects will be recognized:
 |
Fig. (5) Microscopic distribution of gas and water in gas–water contact during the gas driving water process of the second circle. |
- The “immobile water”, which exists in the small pore throats, may start to flow. The water-flooded area expands in the formation and a new closed-gas region forms.
- When the water is driven to the small pores and throats, it combines with the sporadic water to form a continuous phase which reduces the flow resistance and accelerate the water propulsion. However, this type of water may cause the increase of formation pressure so the gas becomes compressed during the next cycle of gas injection. At this time, the water stays in small pores and throats and forms more “sporadic water” or “sealed water”.
- Under such a displacement mechanism, water continues to rush into the gas reservoir and results in an expanding gas–water coexistence region.
4. MICROSCOPIC FLUID DISTRIBUTION CHARACTERISTIC
We can analyze the fluid distribution during the process of the multi-cycle gas water interactive displacement from the macroscopic scale of the reservoir. The results are shown in Fig. (6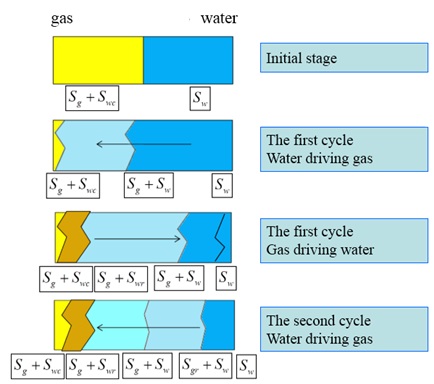 ).
).
4.1. Initial Stage
There is an obvious gas–water interface for the original fluid distribution in the gas reservoir with edge water. The water saturation of edge aquifer is 1.0 and the irreducible water saturation in pure gas region is Swc. There is an edge aquifer region (Sw) and a pure gas region (Sg + Swc) in the gas reservoir.
4.2. Water Driving Gas of the First Cycle Process
During the gas production period, the pressure declines with gas recovering in the gas reservoir. Edge water intrudes into the gas reservoir due to the ΔP. Because the water phase is the wetting phase and gas phase is the non-wetting phase, this is the process where the wetting phase displaces the non-wetting phase. There is an aquifer region (Sw), gas–water two-phase region (Sg + Sw) and a pure gas region (Sg + Swc) in the gas reservoir.
4.3. Gas Driving Water of the Second Cycle Process
The gas reservoir is rebuilt into gas storage after it depletes. During the process of gas injection, the flow ΔP needed will decrease as the gas flows from small pore throats into bigger pore throats, which can easily result in gas fingering. Here the process shows the non-wetting phase displaces the wetting phase. During the gas injection, water is difficult to displace because water would occupy small pore throats preferentially, so water saturation consists of irreducible water and difficult-to-displace water in this region(Swr, Swr > Swc). There exists a pure gas region (Sg + Swc), a gas region with difficult-to-displace water (Sg + Swr), a gas and water two-phase region (Sg + Sw) and an aquifer region (Sw). The two-phase region expands because of the difference between the gas driving water and water driving gas processes. The quantity of the invasion water will increase.
 |
Fig. (6) Schematic for gas and water distribution in porous media. |
4.4. Water Driving Gas of the Second Cycle Process
During the second cycle of gas production, gas is first produced in a continuous phase. With the pressure declining in the gas storage, the water which could not initially flow begins to flow due to gas expansion effect and drawdown pressure, and forms a region that aquifer invaded into two-phase region where remains difficult-to-displace gas(Sgr, Sgr > 0). Therefore, there are five regions: a pure gas region (Sg + Swc), a gas region with difficult-to-displace water (Sg + Swr), a gas and water two-phase region (Sg + Sw), an aquifer region with difficult-to-displace gas (Sgr + Sw,) and an aquifer region (Sw).
According to the analysis above, we can conclude that there are two main problems in the displacement processes. One is that gas fingering easily occurs. The other is that displacing water is difficult after water breaks through the two-phase region. They are caused by driving ΔP, Pc, Fw and the elastic force of the high compressible gas. It appears that there is gas–water blocking after gas–water interactive displacement. The residual water saturation and the residual gas saturation increase in the gas–water coexistence region. As a result, the two-phase region becomes narrower. Therefore, it is easy for gas to break through and difficult for invasion water to be displaced.
5. RELATIVE PERMEABILITY CHANGING DURING THE MULTI-CYCLE GAS-WATER INJECTION AND PRODUCTION
The transient method is used to measure the relative permeability of the multi-cycle gas–water injection and production. The experiment measures five cycles of the gas–water interactive displacement [6He, X.L.; Huang, S.J.; Sun, C.W.; Xu, J.; Zhang, X.; Yang, X. Gas-water relative permeability variation in multi-cycle injection production of underground gas storage in flooded depleted gas reservoir. Oil Gas Storage Transp., 2015, 34(2), 150-153.]. The basic parameters of cores are shown in Table 1. In this paper, we carried out multi-cycle gas-water injection and production of No.2 core twice and No.3 once. The Figs. (7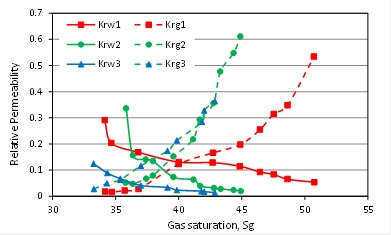 -13
-13 ) are redrawed from He et al. [6He, X.L.; Huang, S.J.; Sun, C.W.; Xu, J.; Zhang, X.; Yang, X. Gas-water relative permeability variation in multi-cycle injection production of underground gas storage in flooded depleted gas reservoir. Oil Gas Storage Transp., 2015, 34(2), 150-153.].
From the above experimental data we can draw the following conclusion:
First, the relative permeability of gas will increase and that of water will decrease with increasing cycles.
Second, the gas–water two-phase region becomes smaller and the residual gas saturation increases. The change of the residual water saturation is not so evident, as shown in Figs. (7-9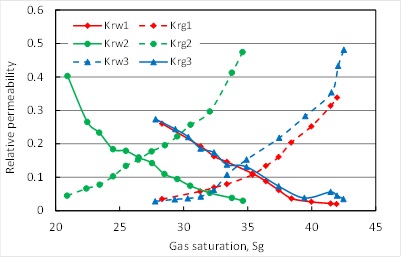 ).
).

 |
Fig. (8) Comparison of relative permeability curves for the second time of multi-cycle gas–water interactive displacement of No. 2 core. |

Third, the iso-osmotic point moves to low gas saturation area with the increasing times of injection and production.
It can be seen that the relative permeability of gas increases while the relative permeability of water declines after multi-cycle gas–water interactive displacement. It leads to the result that gas fingering becomes a more serious problem and the quantity of the residual water becomes larger.
The residual gas saturation of the No. 2 core has an increasing trend and increases to approximately 10% ~ 12% after several drainage cycles as shown in Fig. (10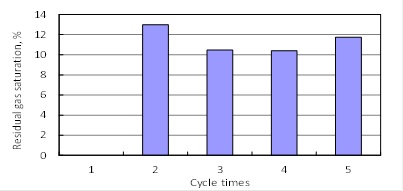 ). The No. 3 core has the same changing rule as shown in Fig. (11
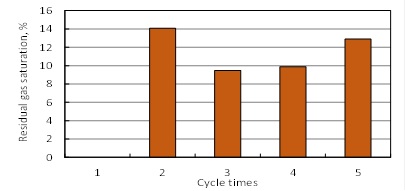 ). The change of the residual gas saturation in different permeability is not so evident. In a word, the residual gas saturation increases in the gas–water region with increasing cycle counts of injection and production.
 |
Fig. (10) Residual gas saturation for different cycles of No. 2 core. |
 |
Fig. (11) Residual gas saturation for different cycles of No. 3 core. |
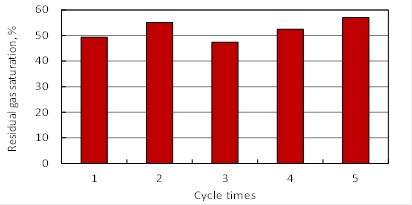 |
Fig. (12) Residual water saturation for different cycles of No. 2 core. |
The residual water saturation remains at high level and does not change greatly after iterations of gas–water interactive displacement as shown in Figs. (12 and 13). However, the residual water saturation of the No. 3 core see Fig. (13), remains at a level of 57% to 65%, higher than the residual water saturation of the No. 2 core (Figs. 12 and 13). The reason might be the heterogeneity of the No. 3 core is a more serious problem than that of the No. 2 core because the gas permeability of the No. 3 core is higher than that of the No. 2 core. The residual water saturation takes up a large proportion of the gas–water two-phase region with increasing cycles of injection and production.
 |
Fig. (13) Residual water saturation for different cycles of No. 3 core. |
CONCLUSION
- Multi-cycle gas–water mutual displacement makes the distribution of gas and water more disperse which is different from the conventional gas or water flooding.
- Microcosmic experiments show that gas–water mutual blockage is the main reason and gas fingering is another important factor for the variation of gas–water distribution.
- The microcosmic fluid distribution of each stage has a great difference, making the two-phase region and effective volume of gas storage narrower.
- Multi-cycle gas–water mutual displacement changes the relative permeability of gas and water making the two-phase flow region narrower and residual gas saturation increase.
CONFLICT OF INTEREST
The authors confirm that this article content has no conflict of interest.
ACKNOWLEDGEMENTS
We gratefully acknowledge the foundation funding by the National Natural Science Foundation of China (E040351304220) and the Science Foundation of China University of Petroleum, Beijing (No. 2462015YQ0206).
REFERENCES
| [1] | Amiell, P.G.F.; Billotte, J.; Meunier, G.; Arnould, M. The study of alternate and unstable gas-water displacements using a small-scale model. In: SPE Gas Technology Symposium; Society of Petroleum Engineers: Dallas, Texas, 1989. SPE19070 [http://dx.doi.org/10.2118/19070-MS] |
| [2] | Li, C.; Wang, J.M.; Xu, H.C.; Tang, L.; Sun, C. Study on fluids flow characteristics of water-gas mutual flooding in sandstone underground gas storage with edge water. In:
International Petroleum Technology Conference, 2013, pp. 5004-5010. [http://dx.doi.org/10.2523/IPTC-17093-MS] |
| [3] | Wang, B.H.; Yan, X.Z.; Yang, X.J.; Feng, Y.R. Study on dynamic prediction of the storage capacity in depleted gas reservoir. Sci. Technol. Eng., 2012, 20(10), 2286-2289. |
| [4] | Wang, J.M.; Jiang, F.G. A prediction model on dynamic injection and production for underground gas storages. Nat. Gas Ind., 2009, 29(2), 108-110. |
| [5] | Xu, Z.P.; Jiang, J.X.; Ge, J.T.; Zhang, L.; Chen, K. Dynamic numerical simulation of injection-production in depleted reservoir underground gas storage. Nat. Gas Expl. Dev., 2011, 34(4), 53-55. |
| [6] | He, X.L.; Huang, S.J.; Sun, C.W.; Xu, J.; Zhang, X.; Yang, X. Gas-water relative permeability variation in multi-cycle injection production of underground gas storage in flooded depleted gas reservoir. Oil Gas Storage Transp., 2015, 34(2), 150-153. |
| [7] | Moradi, B.S. Study of gas injection effects on rock and fluid of a gas condensate reservoir during underground gas storage process. In: Latin American and Caribbean Petroleum Engineering Conference; Society of Petroleum Engineers: Cartagena de Indias, Colombia, 2009. SPE121830 [http://dx.doi.org/10.2118/121830-MS] |
| [8] | Shi, L.; Liao, G.Z.; Xiong, W.; Shusheng, G.; Tong, G. Gas-water percolation mechanism in an underground storage built on a water-drive sandstone gas reservoir. Nat. Gas Ind., 2012, 32(9), 85-87. |
| [9] | Peden, J.M.; Husain, M.I. Visual investigation of multiphase flow and phase interactions within porous media. In: SPE Annual Technical Conference and Exhibition; Society of Petroleum Engineers: Las Vegas, Nevada, 1985. [http://dx.doi.org/10.2118/14307-MS] |
| [10] | Sohrabi, M.; Tehrani, D.H.; Danesh, A.; Henderson, G.D. Visualization of oil recovery by water-alternating-gas injection using high-pressure micromodels. SPE Journal, 2004, 9(03), 290-301. [http://dx.doi.org/10.2118/89000-PA] |
| [11] | Sun, C.L.; Hou, J.R.; Shi, L.; Liang, C.; Gan, Z. A physical simulation experimental system for injection-withdrawal operation of gas reservoir underground gas storage and its application. Nat. Gas Ind., 2016, 36(5), 58-61. |