- Home
- About Journals
-
Information for Authors/ReviewersEditorial Policies
Publication Fee
Publication Cycle - Process Flowchart
Online Manuscript Submission and Tracking System
Publishing Ethics and Rectitude
Authorship
Author Benefits
Reviewer Guidelines
Guest Editor Guidelines
Peer Review Workflow
Quick Track Option
Copyediting Services
Bentham Open Membership
Bentham Open Advisory Board
Archiving Policies
Fabricating and Stating False Information
Post Publication Discussions and Corrections
Editorial Management
Advertise With Us
Funding Agencies
Rate List
Kudos
General FAQs
Special Fee Waivers and Discounts
- Contact
- Help
- About Us
- Search


The Ergonomics Open Journal
(Discontinued)
ISSN: 1875-9343 ― Volume 11, 2018
Patterns in Emergency-Department Arrivals and Length of Stay: Input for Visualizations of Crowding
Morten Hertzum*
Abstract
Crowding is common in emergency departments (EDs) and increases the risk of medical errors, patient dissatisfaction, and clinician stress. The aim of this study is to investigate patterns in patient visits and bottlenecks in ED work in order to discuss the prospects of visualizing such patterns to help manage crowding. We analyze two years of data from a Danish ED for patterns in the patient visits and interview six clinicians from the ED about bottlenecks in their work. The hour of the day explains 50% of the variance in the number of patient arrivals. In addition, there are weekly and yearly patterns in patient arrivals. With respect to the flow of patients through the ED, length of stay increases from low to medium triage levels and then decreases from medium to high triage levels. Also, length of stay increases with patient age. The bottlenecks in the work in the ED relate to patient input (mornings, boom days), patient throughput (staff work hours, linear workflows, manual data entry, overview of patient progress, personal competences), and patient output (no admissions at night, scheduling patient transfers, home transports). The patterns in patient arrivals and length of stay capture factors important to the evolving balance between the demand for ED services and the available resources. Visualization of the patterns, thus, appears a promising tool in managing ED crowding. However, visualizations presuppose reliable data and are expected by the clinicians to be accurate and prognostic. We propose three visualizations.
Article Information

Identifiers and Pagination:
Year: 2016Volume: 9
First Page: 1
Last Page: 14
Publisher Id: TOERGJ-9-1
DOI: 10.2174/1875934301609010001
Article History:
Received Date: 19/05/2015Revision Received Date: 12/11/2016
Acceptance Date: 30/03/2016
Electronic publication date: 13/05/2016
Collection year: 2016
open-access license: This is an open access article licensed under the terms of the Creative Commons Attribution-Non-Commercial 4.0 International Public License (CC BY-NC 4.0) (https://creativecommons.org/licenses/by-nc/4.0/legalcode), which permits unrestricted, non-commercial use, distribution and reproduction in any medium, provided the work is properly cited.
* Address correspondence to this author at the University of Copenhagen, Birketinget, 62300, Copenhagen, Denmark; Phone: +45 3234 1344; E-mail: hertzum@hum.ku.dk
| Open Peer Review Details | |||
|---|---|---|---|
| Manuscript submitted on 19-05-2015 |
Original Manuscript | Patterns in Emergency-Department Arrivals and Length of Stay: Input for Visualizations of Crowding | |
1. INTRODUCTION
The emergency department (ED) is the common entry point to hospitals for nearly all patients with acute problems. Consequently, external events, beyond the control of ED clinicians, influence the moment-to-moment evolution of their work conditions. Severely injured persons may arrive at any time and need the immediate attention of multiple clinicians, yet the majority of the patients have unalarming injuries that, nevertheless, require time and careful assessment [1FitzGerald G, Jelinek GA, Scott D, Gerdtz MF. Emergency department triage revisited. Emerg Med J 2010; 27(2): 86-92.
[http://dx.doi.org/10.1136/emj.2009.077081] [PMID: 20156855] ]. Unless patients leave the ED at the same pace as new patients arrive, the ED becomes crowded. ED crowding is a substantial problem because inadequate staffing makes it frequent, because it increases the risk of oversights and errors in the treatment of the patients, because it may develop into blocking where the ED must turn away new patients, and because it is stressful for the ED clinicians [2Moskop JC, Sklar DP, Geiderman JM, Schears RM, Bookman KJ. Emergency department crowding, part 1-concept, causes, and moral consequences. Ann Emerg Med 2009; 53(5): 605-11.
[http://dx.doi.org/10.1016/j.annemergmed.2008.09.019] [PMID: 19027193] -5Bernstein SL, Aronsky D, Duseja R, et al. The effect of emergency department crowding on clinically oriented outcomes. Acad Emerg Med 2009; 16(1): 1-10.
[http://dx.doi.org/10.1111/j.1553-2712.2008.00295.x] [PMID: 19007346] ]. Knowledge about patterns in patient visits is an important element in the prevention and management of crowding.
In this study we investigate patterns in ED patient visits. Empirically, this investigation takes place at an ED in Region Zealand, one of the five healthcare regions in Denmark. The patterns are analyzed on the basis of quantitative data extracted from the electronic whiteboard that keeps track of the flow of patients through the ED, supplemented with interviews with ED clinicians. Specifically, the aim of this study is twofold:
● To analyze patterns in patient arrivals and their length of stay in the ED. Knowledge of such patterns makes variation in the number and length of visits more predictable and makes it easier to recognize extraordinary situations, which may require special precautions.
● To discuss the prospects and possibilities of supporting ED clinicians in the moment-to-moment organization of their work by visualizing patterns in patient visits, for example on the whiteboard, in order to counter ED crowding.
The whiteboard is a central artifact in the coordination of ED work [6Bjørn P, Hertzum M. Artefactual multiplicity: A study of emergency-department whiteboards. Comput Support Coop Work 2011; 20(1&2): 93-121.
[http://dx.doi.org/10.1007/s10606-010-9126-7] , 7Aronsky D, Jones I, Lanaghan K, Slovis CM. Supporting patient care in the emergency department with a computerized whiteboard system. J Am Med Inform Assoc 2008; 15(2): 184-94.
[http://dx.doi.org/10.1197/jamia.M2489] [PMID: 18096913] ]. It provides selected information about the patients, such as their arrival time, triage level, and the ED clinician responsible for their treatment. And it is attended by the clinicians on a regular basis to maintain their awareness of the state of the ED, to monitor the progress of their patients in the ED workflow, and to align and coordinate their activities with those of the other clinicians [6Bjørn P, Hertzum M. Artefactual multiplicity: A study of emergency-department whiteboards. Comput Support Coop Work 2011; 20(1&2): 93-121.
[http://dx.doi.org/10.1007/s10606-010-9126-7] , 8Hertzum M, Simonsen J. Visual overview, oral detail: The use of an emergency-department whiteboard. Int J Hum Comput Stud 2015; 82: 21-30.
[http://dx.doi.org/10.1016/j.ijhcs.2015.04.004] , 9Wong HJ, Caesar M, Bandali S, Agnew J, Abrams H. Electronic inpatient whiteboards: improving multidisciplinary communication and coordination of care. Int J Med Inform 2009; 78(4): 239-47.
[http://dx.doi.org/10.1016/j.ijmedinf.2008.07.012] [PMID: 18786851] ]. The substitution of electronic for dry-erase whiteboards has made the whiteboards a source of historical data about the flow of patients through the ED as well as a possible locale for visualizations of this flow. In the following, we review related work on factors associated with ED crowding, describe the method of our empirical work, present the results of our analysis, and discuss their implications for the prospects of visualizing patterns in patient visits to help manage ED crowding.
2. RELATED WORK
According to the American College of Emergency Physicians [10American College of Emergency Physicians. Crowding. Ann Emerg Med 2006; 47(6): 585.
[http://dx.doi.org/10.1016/j.annemergmed.2006.02.025] [PMID: 16713796] ], "crowding occurs when the identified need for emergency services exceeds available resources for patient care in the emergency department (ED), hospital, or both."
2.1. Factors Causing ED Crowding
The causes of crowding are many but can be grouped into input, throughput, and output factors [3Hoot NR, Aronsky D. Systematic review of emergency department crowding: causes, effects, and solutions. Ann Emerg Med 2008; 52(2): 126-36.
[http://dx.doi.org/10.1016/j.annemergmed.2008.03.014] [PMID: 18433933] , 11Asplin BR, Flottemesch TJ, Gordon BD. Developing models for patient flow and daily surge capacity research. Acad Emerg Med 2006; 13(11): 1109-13.
[http://dx.doi.org/10.1111/j.1553-2712.2006.tb01632.x] [PMID: 17015412] ]:
- Input factors are about sources and aspects of patient arrivals in the ED and, for example, include frequently returning patients.
- Throughput factors are about bottlenecks within the ED and, for example, include inadequate staffing.
- Output factors are about bottlenecks that originate in other parts of the healthcare system but affect the ED and, for example, include hospital bed shortages.
While the input factors relate to the demand for emergency services, the throughput and output factors relate to the supply of resources for patient care. Similarly, solutions to crowding may aim to manage demand by, for example, referring non-urgent arrivals to their general practitioner and diverting ambulances with urgent arrivals to other hospitals [e.g., 12Washington DL, Stevens CD, Shekelle PG, Henneman PL, Brook RH. Next-day care for emergency department users with nonacute conditions. A randomized, controlled trial. Ann Intern Med 2002; 137(9): 707-14.
[http://dx.doi.org/10.7326/0003-4819-137-9-200211050-00005] [PMID: 12416944] , 13Scheulen JJ, Li G, Kelen GD. Impact of ambulance diversion policies in urban, suburban, and rural areas of Central Maryland. Acad Emerg Med 2001; 8(1): 36-40.
[http://dx.doi.org/10.1111/j.1553-2712.2001.tb00546.x] [PMID: 11136145] ] or to increase supplies by, for example, calling in additional staff and increasing the number of beds [e.g., 14Bucheli B, Martina B. Reduced length of stay in medical emergency department patients: a prospective controlled study on emergency physician staffing. Eur J Emerg Med 2004; 11(1): 29-34.
[http://dx.doi.org/10.1097/00063110-200402000-00006] [PMID: 15167190] , 15McConnell KJ, Richards CF, Daya M, Bernell SL, Weathers CC, Lowe RA. Effect of increased ICU capacity on emergency department length of stay and ambulance diversion. Ann Emerg Med 2005; 45(5): 471-8.
[http://dx.doi.org/10.1016/j.annemergmed.2004.10.032] [PMID: 15855939] ]. A third type of solutions aims to improve ED clinicians’ awareness of how the demand for their services will likely evolve in the near future to enable them to prepare for crowded periods and, thereby, make optimal use of the available resources. These solutions include the development of crowding measures, such as the Emergency Department Work Index (EDWIN) [16Bernstein SL, Verghese V, Leung W, Lunney AT, Perez I. Development and validation of a new index to measure emergency department crowding. Acad Emerg Med 2003; 10(9): 938-42.
[http://dx.doi.org/10.1111/j.1553-2712.2003.tb00647.x] [PMID: 12957975] ], and models of patterns in the patient volume.
Asplin et al. [11Asplin BR, Flottemesch TJ, Gordon BD. Developing models for patient flow and daily surge capacity research. Acad Emerg Med 2006; 13(11): 1109-13.
[http://dx.doi.org/10.1111/j.1553-2712.2006.tb01632.x] [PMID: 17015412] ] state that in the ED “arrivals follow predictable patterns.” Their data from an ED in the US show the highest number of patient arrivals on Mondays and the lowest on Sundays, but they acknowledge that the exact pattern may vary across EDs. In a study of a Brazilian ED, Marcilio et al. [17Marcilio I, Hajat S, Gouveia N. Forecasting daily emergency department visits using calendar variables and ambient temperature readings. Acad Emerg Med 2013; 20(8): 769-77.
[http://dx.doi.org/10.1111/acem.12182] [PMID: 24033619] ] find little variation in daily arrivals across the months of the year. In addition, extending their model with daily temperature readings did not improve its precision relative to a model that predicted patient arrivals on the basis of calendar variables only. Similarly, Jones et al. [18Jones SS, Thomas A, Evans RS, Welch SJ, Haug PJ, Snow GL. Forecasting daily patient volumes in the emergency department. Acad Emerg Med 2008; 15(2): 159-70.
[http://dx.doi.org/10.1111/j.1553-2712.2007.00032.x] [PMID: 18275446] ] find that the precision of their model of ED patient volumes improved only marginally when extended with predictor variables beyond calendar variables. The location-dependence of the patterns is emphasized by a study of an Israeli ED in which patient arrivals were highest on Sundays followed by Thursdays and lowest on weekends, which in Israel is half of Friday and all Saturday [19Rotstein Z, Wilf-Miron R, Lavi B, Shahar A, Gabbay U, Noy S. The dynamics of patient visits to a public hospital ED: a statistical model. Am J Emerg Med 1997; 15(6): 596-9.
[http://dx.doi.org/10.1016/S0735-6757(97)90166-2] [PMID: 9337370] ]. An additional seasonal variation indicated fewer arrivals at the Israeli ED in winter (December-March) than in spring and summer (April-September).
While patient arrivals measure ED input, the main measure of throughput is length of stay. The mean ED length of stay varies across studies and depends on the exact division of labor between the ED and the inpatient departments: 2.6 hours [20Herring A, Wilper A, Himmelstein DU, et al. Increasing length of stay among adult visits to U.S. Emergency departments, 2001-2005. Acad Emerg Med 2009; 16(7): 609-16.
[http://dx.doi.org/10.1111/j.1553-2712.2009.00428.x] [PMID: 19538503] ], 3.0 hours [21Horwitz LI, Green J, Bradley EH. US emergency department performance on wait time and length of visit. Ann Emerg Med 2010; 55(2): 133-41.
[http://dx.doi.org/10.1016/j.annemergmed.2009.07.023] [PMID: 19796844] ], and 4.0 hours [22Rathlev NK, Chessare J, Olshaker J, et al. Time series analysis of variables associated with daily mean emergency department length of stay. Ann Emerg Med 2007; 49(3): 265-71.
[http://dx.doi.org/10.1016/j.annemergmed.2006.11.007] [PMID: 17224203] ]. According to Rathlev et al. [22Rathlev NK, Chessare J, Olshaker J, et al. Time series analysis of variables associated with daily mean emergency department length of stay. Ann Emerg Med 2007; 49(3): 265-71.
[http://dx.doi.org/10.1016/j.annemergmed.2006.11.007] [PMID: 17224203] ] the primary drivers of ED length of stay are the number of arrivals, the number of elective surgical admissions, and the hospital occupancy, while the day of the week has no independent effect on length of stay. That is, length of stay increases with increasing competition for needed clinical resources. McCarthy et al. [23McCarthy ML, Zeger SL, Ding R, et al. Crowding delays treatment and lengthens emergency department length of stay, even among high-acuity patients. Ann Emerg Med 2009; 54(4): 492-503.e4.
[http://dx.doi.org/10.1016/j.annemergmed.2009.03.006] [PMID: 19423188] ] find that the increase in ED length of stay with increasing crowding is an increase in waiting time prior to ED treatment and in boarding time (i.e., time from ED decision to admit until actual transfer to the inpatient department), while the ED treatment time is unaffected. They also report that crowding increases the waiting time for high-acuity patients, not just for patients at the lower triage levels.
With respect to output factors, the influence of bottlenecks in inpatient departments on crowding in the ED varies with the rate of patients admitted to an inpatient department after being seen in the ED. Pines et al. [24Pines JM, Mutter RL, Zocchi MS. Variation in emergency department admission rates across the United States. Med Care Res Rev 2013; 70(2): 218-31.
[http://dx.doi.org/10.1177/1077558712470565] [PMID: 23295438] ] report admission rates ranging between 10% and 26% for 1376 US hospitals. It appears that admission rates cannot be predicted from calendar variables [25Abraham G, Byrnes GB, Bain CA. Short-term forecasting of emergency inpatient flow. IEEE Trans Inf Technol Biomed 2009; 13(3): 380-8.
[http://dx.doi.org/10.1109/TITB.2009.2014565] [PMID: 19244023] ].
2.2. Visualizing ED Crowding
Visualization provides possibilities for presenting data in ways that facilitate exploration and understanding of the data [26Card SK, Mackinlay JD, Shneiderman B, Eds. Readings in information visualization: Using vision to think. San Francisco, CA: Morgan Kaufmann 1999.], often with a focus on showing many data in a format that enables users to gain an at-a-glance overview or see patterns in the data [27Hornbæk K, Hertzum M. The notion of overview in information visualization. Int J Hum Comput Stud 2011; 69(7&8): 509-25.
[http://dx.doi.org/10.1016/j.ijhcs.2011.02.007] ]. Most ED whiteboards have a tabular layout with a row of information about each patient [28Rasmussen R. Electronic whiteboards in emergency medicine: A systematic review. In: Luo G, Liu J, Yang CC, Eds. Proceedings of the IHI2012 International Health Informatics Symposium. 483-92.
[http://dx.doi.org/10.1145/2110363.2110418] ]. That is, they do not provide aggregate information that aims to visualize the flow of patients through the ED or predict imminent crowding.
The most common visualization in studies of ED arrivals and crowding is a graph of the number of arrivals on the different hours of the day or days of the week [e.g., 11Asplin BR, Flottemesch TJ, Gordon BD. Developing models for patient flow and daily surge capacity research. Acad Emerg Med 2006; 13(11): 1109-13.
[http://dx.doi.org/10.1111/j.1553-2712.2006.tb01632.x] [PMID: 17015412] , 17Marcilio I, Hajat S, Gouveia N. Forecasting daily emergency department visits using calendar variables and ambient temperature readings. Acad Emerg Med 2013; 20(8): 769-77.
[http://dx.doi.org/10.1111/acem.12182] [PMID: 24033619] , 19Rotstein Z, Wilf-Miron R, Lavi B, Shahar A, Gabbay U, Noy S. The dynamics of patient visits to a public hospital ED: a statistical model. Am J Emerg Med 1997; 15(6): 596-9.
[http://dx.doi.org/10.1016/S0735-6757(97)90166-2] [PMID: 9337370] ]. Nielsen et al. [29Nielsen RF, Pérez N, Petersen P, Biering K. Assessing time to treatment and patient inflow in a Danish emergency department: a cohort study using data from electronic emergency screen boards. BMC Res Notes 2014; 7: 690.
[http://dx.doi.org/10.1186/1756-0500-7-690] [PMID: 25288356] ] extend such graphs by color-coding the bar for each hour of the day to indicate the number of arrivals at each triage level. A few studies propose interactive visualizations for use in the ED. Greci et al. [30Greci LS, Parshalle CE, Calvitti A, Renvall MJ. CrowdED: crowding metrics and data visualization in the emergency department. J Public Health Manag Pract 2011; 17(2): E20-8.
[http://dx.doi.org/10.1097/PHH.0b013e3181e8b0e9] [PMID: 21297403] ] propose a compact visualization that shows the hour-by-hour evolution in a configurable set of parameters, including the number of patients who left without being seen by a physician, the number of patient arrivals by triage level, the number of ED staff, and the crowding metric EDWIN. Boyle et al. [31Boyle J, Jessup M, Crilly J, et al. Predicting emergency department admissions. Emerg Med J 2012; 29(5): 358-65.
[http://dx.doi.org/10.1136/emj.2010.103531] [PMID: 21705374] ] propose a full-screen visualization that charts the number of patient arrivals across the hours of the day and forecasts the number of arrivals and admissions for tomorrow as well as their distribution on triage levels and medical specialties. Neither Greci et al. [30Greci LS, Parshalle CE, Calvitti A, Renvall MJ. CrowdED: crowding metrics and data visualization in the emergency department. J Public Health Manag Pract 2011; 17(2): E20-8.
[http://dx.doi.org/10.1097/PHH.0b013e3181e8b0e9] [PMID: 21297403] ] nor Boyle et al. [31Boyle J, Jessup M, Crilly J, et al. Predicting emergency department admissions. Emerg Med J 2012; 29(5): 358-65.
[http://dx.doi.org/10.1136/emj.2010.103531] [PMID: 21705374] ] evaluated their visualization during use in the ED.
3. METHOD
To investigate patterns in patient visits and the prospects of visualizing them we analyzed log data from two years of ED visits and interviewed six ED clinicians. Prior to conducting the study we obtained approval from the healthcare region. Access to the log data from the electronic ED whiteboard was regulated in a written agreement. The ED clinicians orally consented to be interviewed. Fig. (1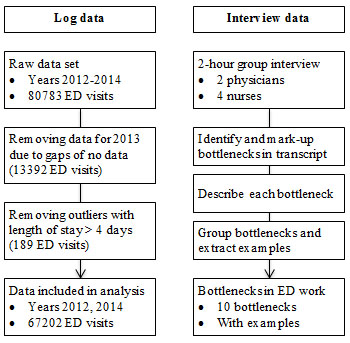 ) summarizes the method.
 |
Fig. (1) Steps in the analysis of the log and interview data. |
3.1. The ED
The study was conducted at a medium-size Danish hospital. The hospital had 250 beds and served an area of approximately 150,000 citizens. Almost all acute patients entered the hospital through the ED, which saw about 33,000 patients a year. As a rule of thumb, patients that could be discharged within 48 hours stayed in the ED for treatment, whereas all other patients were admitted and transferred to an inpatient department as quickly as possible. It may be noted that in Denmark hospital care is financed via taxes. Thus, neither ED treatment nor treatment in an inpatient department is dependent on the patient’s personal wealth or insurance.
The ED introduced an electronic whiteboard in late 2009. The whiteboard supplemented the electronic patient record by providing logistic information about the patients. For each patient, the whiteboard gave the patient’s name, age, time of arrival, room, triage level, responsible physician, responsible nurse, working diagnosis, current treatment activity, and a few other pieces of information. Clinicians updated the whiteboard manually and, in addition, some changes occurred automatically through integrations between the whiteboard and systems such as the laboratory system. Whenever the content of the whiteboard changed, the change was automatically logged.
3.2. Log Data
For the purpose of this study the whiteboard vendor produced a version of the log from which all patient names, clinician names, phone numbers, and other information that might identify persons had been removed. These anonymized log data covered the three-year period 2012-2014. However, the data for 2013 turned out to contain gaps of no data. To avoid that the gaps biased the results of our analysis, the data for 2013 were discarded and the analysis was based on the data for 2012 and 2014.
Each of the 1,934,041 entries in the log documented an event that changed the whiteboard content. A log entry consisted of a timestamp, the event type (e.g., TriageChanged), any values associated with the event (e.g., Triage: 4), and a system-generated identifier of the visit to which the event pertained. On the basis of the log data we, for each visit, determined:
- Time of arrival: when the patient arrived in the ED
- Length of stay: how long the patient was in the ED
- Triage level: the patient’s triage level at initial triage
- Age: the patient’s age in years
The clinicians expressed the triage level on the scale 1 (fast track), 2 (in need of assessment), 3 (ill), 4 (seriously ill), and 5 (life threatening). For 26% of the ED visits the log data contained no triage information. In addition, the log data contained no information about the patient’s age for 11% of the visits. Such incompleteness must be expected in operational data, the recording of which is secondary to the treatment of the patients. Information about time of arrival and length of stay was available for all visits. After removing 189 outliers (defined as visits longer than four days, i.e. 27 times the median length of stay), the log data comprised 67202 ED visits.
3.3. Interview Data
To enrich the log data we conducted a group interview with six ED clinicians: two physicians and four nurses. We chose a group interview because we believed that the discussions among the interviewees would deepen their deliberations and because our experience with the clinicians from previous work with the ED was that they talked freely in each other’s presence. Both reasons were confirmed during the interview. The purpose of the interview was to get information about the factors that affected the flow of patients through the ED and about how the ED clinicians handled the situations in which these factors threatened to lead to ED crowding. That is, the interview served to assess the importance of the patterns derivable from the log data relative to other factors affecting the flow of patients through the ED.
The interview lasted two hours. It was audio-recorded and, subsequently, transcribed. We analyzed the interview data through a process of meaning condensation. Initially, we read the transcript sentence by sentence to identify and mark up all mentions of bottlenecks in the patient flow. Then, we reread the transcript and produced a one-sentence description of each bottleneck and an additional one-sentence description of each initiative to counteract a bottleneck. Finally, similar descriptions were grouped to arrive at a list of unique bottlenecks, and the marked-up passages of the transcript were consulted again to extract examples of each bottleneck. For presentation purposes we sorted the list into bottlenecks relating to input, throughput, and output.
4. RESULTS
As a preamble to our analysis we note that with two years (731 days) of log data even small differences become statistically significant. We maintain the customary level of .05 for statistical significance but to avoid assigning importance to inconsequential effects we also report the effect size of the statistical tests. In addition, all pairwise comparisons were Bonferroni-adjusted to compensate for multiple comparisons.
4.1. Patient Arrivals
Fig. (2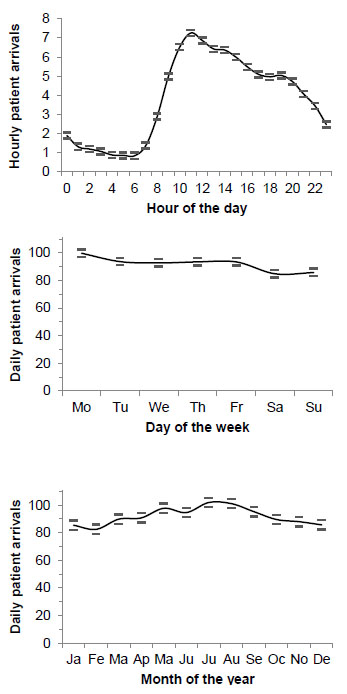 ) shows the daily, weekly, and yearly pattern in patient arrivals. Time evidently influenced the number of patient arrivals.
 |
Fig. (2) Number of patient arrivals by hour of the day (top), day of the week (middle), and month of the year (bottom) Note. Data for 731 days. Error bars show the 95% confidence interval. |
There was a significant effect of the hour of the day on the number of arrivals, F(23, 17520) = 766.95, p < .001, η2 = .50. As indicated by the effect size (η2), the effect was not just significant but also very large; the hour of the day explained 50% of the variance in the number of hourly arrivals. Arrivals varied from an average of 0.85 at 06 o’clock to an average of 7.25 at 11 o’clock. Pairwise comparisons showed significantly fewer arrivals during the night (01-07) than at any other time of the day, significant hour-by-hour increases in arrivals in the morning (08-11), and significant hour-by-hour decreases in arrivals from noon to midnight except in the early afternoon (13-15) and in the early evening (17-20).
There was also a significant effect of the day of the week on the number of arrivals, F(6, 724) = 14.05, p < .001, η2 = .10. The day of the week explained 10% of the variance in the number of daily patient arrivals, which varied from an average of 85 on Saturdays to an average of 100 on Mondays. Pairwise comparisons showed significantly more arrivals on Mondays than on any other day and significantly fewer arrivals on Saturdays and Sundays than on any non-weekend day.
Finally, there was a significant effect of the month of the year on the number of arrivals, F(11, 719) = 13.00, p < .001, η2 = .17. This effect explained 17% of the variance in the number of daily arrivals, which varied from an average of 82 in February to an average of 102 in July. Pairwise comparisons showed significantly more daily arrivals during summer (July-August) than during any month from mid autumn to mid spring (October-April) and significantly fewer daily arrivals during winter (December-February) than during any month from late spring to early autumn (May-September).
4.2. Length of Stay
We analyzed how the patients’ triage level, determined immediately upon their arrival to the ED, influenced their length of stay, (see Table 1). There was a significant effect of triage level on length of stay, F(4, 49538) = 1572.63, p < .001, η2 = .11. Triage level explained 11% of the variance in length of stay, which was an average of 5.6 times longer for patients at triage level 3 compared to triage level 5. Pairwise comparisons showed significant differences in length of stay for all pairs of triage level, except between levels 1 and 2. That is, length of stay increased from levels 1 and 2 to level 3 and progressively decreased from level 3 to level 4 and, in turn, to level 5.
We found a significant interaction between triage level and the hour of day, F(91, 49423) = 2.07, p < .001, η2 = .004. However, as indicated by the effect size, the interaction explained a negligible 0.4% of the variance in length of stay. There was also a significant interaction between triage level and the day of week, F(24, 49508) = 1.52, p < .05, η2 = .001, but again the effect size was negligible. Thus, for practical purposes the effect of the triage level on the length of stay differed neither from one hour of the day to another, nor from one day of the week to another.
To analyze the effect of age on length of stay, we divided the patients into five age groups, (see Table 2). There was a significant effect of age group on length of stay, F(4, 59961) = 1615.07, p < .001, η2 = .10. Age group explained 10% of the variance in length of stay, and the impact of this effect was corroborated by the fourfold increase in the average length of stay from the youngest to the oldest age group. Pairwise comparisons showed significant differences in length of stay for all pairs of age group. Thus, length of stay increased with age.
We found a significant interaction between age group and the hour of the day, F(92, 59846) = 2.37, p < .001, η2 = .003, but the effect size was negligible. Thus, for practical purposes the hour of the day did not modify the effect of age group on length of stay. There was no interaction between age group and the day of the week, F(24, 59931) = 1.14, p = .29. The observed power of this test was high (.89). Thus, the day of the week did not modify how age group affected length of stay.
We also analyzed whether length of stay was affected more by the hour of the day at which the patient arrived in the ED or the hour of the day at which the patient left the ED, (see Fig. 3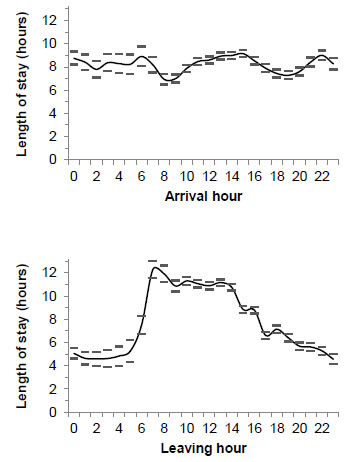 ). There was a significant effect of arrival hour on length of stay, F(23, 67178) = 11.35, p < .001, η2 = .004, but the effect size was negligible. There was also a significant effect of leaving hour on length of stay, F(23, 67178) = 172.44, p < .001, η2 = .056, and the effect size was about 14 times larger than for arrival hour. Thus, leaving hour explained considerably more of the variance in length of stay than arrival hour.
 |
Fig. (3) Length of stay by the hour of the day at which the patient arrived (top) and left the ED (bottom) Note. Data for 731 days. Error bars show the 95% confidence interval |
4.3. Bottlenecks in the ED
The interviewees identified a number of bottlenecks that might lead to crowding in the ED. The bottlenecks related to input, throughput, and output, (see Table 3).
The bottlenecks about the inflow of patients identified the points in time at which the interviewees knew the number of patient arrivals peaked. A reason for the daily peak in the morning was that patients started arriving after they had seen their general practitioners, who in the interviewees’ opinion were not good at helping to distribute the arrival of non-urgent patients across the day. A system informing the general practitioners about current waiting times in the ED was proposed as a means of helping the general practitioners advice non-urgent patients about when to go to the ED.

With respect to throughput, the interviewees agreed that ”It is the human resources - nurses, physicians, assistants, porters - that limit our possibilities for action.” Thus, several bottlenecks concerned scarcity of human resources and inefficient use of them. For example, the ED was only staffed with physicians from 08 to 21. The rest of the day physicians were only available on an on-call basis (from the inpatient departments). Also, blood samples could only be drawn and analyzed twice during the night for patients at triage levels 1 to 3. Overly linear workflows were identified as inefficient because they tied the physicians to single patients for too long. Manual data entry was a near permanent bottleneck and experienced as particularly annoying because the same information often had to be recorded multiple times, in different electronic systems that were not exchanging data. Another bottleneck concerned inadequate overview of how far the group of patients in the ED had progressed in their ED trajectory. This bottleneck created imbalances between the objective of maintaining the flow of patients through the ED and that of attending to the highly triaged patients first. Lowly triaged patients could often be completed quickly, thereby maintaining the flow and restoring a fuller focus on the highly triaged patients. A coordinating nurse had previously been dedicated to the task of assigning clinicians to patients and balancing the objectives of patient flow and treatment urgency. Without a coordinating nurse, the interviewees experienced that the overview required to maintain this balance became a frequent bottleneck. Finally, the competences of the individual clinicians working a shift were pertinent to throughput. The interviewees emphasized the stark difference between working a shift with competent as opposed to less competent colleagues. Less competent clinicians needed more time to complete tasks and responded less effectively to an increase in crowding, often as a result of having less experience in ED work.
Three bottlenecks restricted the outflow of patients from the ED. Patients could not be transferred from the ED to the inpatient departments during the night. This practice was adopted to shield the inpatient departments, some of which did not have the nighttime resources to receive new patients without possibly compromising the quality of care. However, the practice meant that the outflow from the ED during the night was restricted to the patients who could be sent home. The magnitude of this bottleneck was evident in the patients’ length of stay, which displayed a sharp increase for the patients discharged at 08 o’clock when the patients who had been boarding in the ED during the night started to be transferred to other departments, (see Fig. 3) (bottom). During the day, when patients could be transferred to the inpatient departments, the scheduling of these transfers constituted another bottleneck. From the interviewees’ point of view the inpatient departments were slow to accept new patients. The slowness frequently made it difficult for the ED to free beds as quickly as they needed them for new patients. Similarly, patients discharged to go home often had to stay in the ED for hours if they were to be transported home by ambulance. The waiting time for a home transport was longest when the ambulances were busy transporting new patients to the ED. Thus, the waiting time was longest when the ED was most in need of freeing beds for new patients to avoid crowding.
The interviewees also described several initiatives to prevent bottlenecks and manage crowding. These initiatives included a recently established daily bed meeting among the department heads to help distribute the patients more evenly across departments. Another initiative was a one-hour threshold for the inpatient departments to report back when they were able to admit a patient currently in the ED. However, most of the statements about initiatives to manage crowding centered on the possibility of receiving early warnings of upcoming crowding. An early warning would make precautions against crowding more effective because they would be triggered in time, and it could help prevent escalation and stress in other situations by signaling that these situations were not out of the ordinary. The interviewees proposed that early warnings could be generated on the basis of information about the number of announced patients, the occupancy level of the ED, how far the patients in the ED had progressed toward disposition, and the current staff resources in the ED. Much of this information could be extracted from the electronic whiteboard but the interviewees were very aware that for the early warnings to be accurate the whiteboard would have to be updated in a more consistent and timely manner, preferably by replacing most manual data entry with automated updates.
5. DISCUSSION
In the following, we discuss patterns in ED visits and bottlenecks in ED work with a view to the prospects of visualizing such patterns to help manage crowding.
5.1. Patterns in ED Visits
The number of patient arrivals in the ED varied predictably across the day, week, and year. In particular, the hour of the day explained 50% of the variance in patient arrivals, which displayed a pattern consistent with previous studies [11Asplin BR, Flottemesch TJ, Gordon BD. Developing models for patient flow and daily surge capacity research. Acad Emerg Med 2006; 13(11): 1109-13.
[http://dx.doi.org/10.1111/j.1553-2712.2006.tb01632.x] [PMID: 17015412] , 29Nielsen RF, Pérez N, Petersen P, Biering K. Assessing time to treatment and patient inflow in a Danish emergency department: a cohort study using data from electronic emergency screen boards. BMC Res Notes 2014; 7: 690.
[http://dx.doi.org/10.1186/1756-0500-7-690] [PMID: 25288356] ]. The interviewees were well aware of the daily pattern, whereas the weekly and yearly patterns were less apparent to them. Specifically, their subjective experience that weekdays, except Thursdays, were really busy does not fully reflect the weekly pattern in arrivals with more arrivals on Mondays and no difference between the other weekdays. Previous studies find somewhat different weekly patterns, thereby indicating that patterns exist but depend on local conditions [17Marcilio I, Hajat S, Gouveia N. Forecasting daily emergency department visits using calendar variables and ambient temperature readings. Acad Emerg Med 2013; 20(8): 769-77.
[http://dx.doi.org/10.1111/acem.12182] [PMID: 24033619] -19Rotstein Z, Wilf-Miron R, Lavi B, Shahar A, Gabbay U, Noy S. The dynamics of patient visits to a public hospital ED: a statistical model. Am J Emerg Med 1997; 15(6): 596-9.
[http://dx.doi.org/10.1016/S0735-6757(97)90166-2] [PMID: 9337370] ]. For yearly patterns the results of previous studies vary from little monthly variation [17Marcilio I, Hajat S, Gouveia N. Forecasting daily emergency department visits using calendar variables and ambient temperature readings. Acad Emerg Med 2013; 20(8): 769-77.
[http://dx.doi.org/10.1111/acem.12182] [PMID: 24033619] ] to a pattern similar to ours [19Rotstein Z, Wilf-Miron R, Lavi B, Shahar A, Gabbay U, Noy S. The dynamics of patient visits to a public hospital ED: a statistical model. Am J Emerg Med 1997; 15(6): 596-9.
[http://dx.doi.org/10.1016/S0735-6757(97)90166-2] [PMID: 9337370] ].
Length of stay varied predictably with triage level and age group. The increase in length of stay from triage levels 1 and 2 to level 3 probably results from the more severe condition of patients triaged at level 3, thereby requiring more treatment. The progressive decrease in the length of stay from level 3 to level 5 indicates that it is urgent to clarify the condition of patients triaged at levels 4 and, especially, 5 to be able to transfer them to an inpatient department for specialist treatment. The relationship between triage level and length of stay is consistent with the study by Yoon et al. [32Yoon P, Steiner I, Reinhardt G. Analysis of factors influencing length of stay in the emergency department. CJEM 2003; 5(3): 155-61.
[PMID: 17472779] ]. With respect to age, length of stay increased with age. Biber et al. [33Biber R, Bail HJ, Sieber C, Weis P, Christ M, Singler K. Correlation between age, emergency department length of stay and hospital admission rate in emergency department patients aged ≥70 years. Gerontology 2013; 59(1): 17-22.
[http://dx.doi.org/10.1159/000342202] [PMID: 23128892] ] find increasing length of stay with age for trauma patients but no age effect on length of stay for non-trauma patients. An explanation of the partial inconsistency with our results may be a more restricted scope of the work in the ED studied by Biber et al. [33Biber R, Bail HJ, Sieber C, Weis P, Christ M, Singler K. Correlation between age, emergency department length of stay and hospital admission rate in emergency department patients aged ≥70 years. Gerontology 2013; 59(1): 17-22.
[http://dx.doi.org/10.1159/000342202] [PMID: 23128892] ], in which the median length of stay was 1.78 hours compared to 3.52 hours in the ED we studied.
The staffing of the ED already follows a pattern similar to the daily pattern in patient arrivals with most staff during dayshifts and fewest during nightshifts. Knowledge of additional, possibly local, patterns would provide additional opportunities for matching available resources to the demand for clinical services. We see three implications of the presence of these patterns in patient visits. First, the patterns must be made known to the clinicians and their management. To this end, there is a need for a low-overhead tool that aggregates information across patients and provides visualizations akin to Figs. (2, 3). Such visualizations go beyond the current whiteboard and patient records, which provide information about the individual patient. Second, the yearly variation in patient arrivals is not matched by a similar variation in the staffing of the ED. Thus, the same number of clinicians has to treat more patients in the summer than in the winter. On the basis of analyses such as ours the staffing of an ED could be matched more closely to recurrent patterns in the flow of patients, thereby balancing the workload and reducing the risk of oversights caused by high workload. Third, emergency patients compete with elective patients for access to, for example, surgery. Waiting for surgery is stressful for the patient, increases length of stay, and may have ripple effects on other patients. It may, therefore, be considered to schedule more of the elective patients for surgery during the periods with fewer arrivals in the ED.
5.2. Bottlenecks
The bottlenecks identified by the six interviewees show that temporality is important to throughput and output in addition to input. Specifically, the throughput bottleneck of staff work hours and the output bottleneck of not admitting patients to inpatient departments during the night are tightly linked to the hours of the day, just as the input bottleneck in the morning. The temporal bottlenecks in throughput and output are reflected in the length of stay; the input bottleneck in the morning is about the number of arrivals. It is evident from the log data that the hour at which patients leave the ED explains more of the variance in length of stay than the hour at which patients arrive. That is, throughput and output factors influence length of stay much more than input factors. Patients leaving the ED in the morning have stayed almost three times as long in the ED as patients leaving during the night. This difference demonstrates that patients board in the ED during the night while waiting to be transferred to an inpatient department or seen by an ED physician.
The flow of patients through the ED is complicated by an inadequate overview of the patients’ progress in their ED trajectory. While the whiteboard aims at providing this overview for the individual patient, the interviewees express that it is missing at the level of the group of ED patients. That is, no tool or person continuously aggregates the information about the individual patients into an overview of the patient flow through the ED. The absence of such an overview degrades the ability of the ED to manage the fundamental difficulty associated with crowding: Whenever the demand for ED services exceeds the available resources, delays will occur. A delay has carry-over effects because the delayed treatment consumes resources that would otherwise have been available for later patients. In contrast, excess resources do not carry over; any excess capacity in resources is lost. The flexibility of the ED in managing crowding is further reduced by overly linear workflows and by tiresome, duplicated manual data entry. In transferring patients out of the ED it is a bottleneck that the inpatient departments are experienced as slow to accept new patients. Inpatient departments face the disincentive that discharging a relatively well patient very often means that the bed will immediately be filled with a patient from the ED who requires a high level of care. This disincentive makes it attractive for busy inpatient departments to hang on to their relatively well patients [34Jessup M, Wallis M, Boyle J, et al. Implementing an emergency department patient admission predictive tool: insights from practice. J Health Organ Manag 2010; 24(3): 306-18.
[http://dx.doi.org/10.1108/14777261011054635] [PMID: 20698405] ].
The bottlenecks in throughput and output have implications relating to the ability of the ED to respond to dynamically changing circumstances. First, a better overview of the patients’ progress in their ED trajectory is needed. A visualization at the level of the group of ED patients may facilitate this overview but it is futile unless the clinicians attend to it and react to crowding situations in a coordinated manner. Hertzum and Simonsen [8Hertzum M, Simonsen J. Visual overview, oral detail: The use of an emergency-department whiteboard. Int J Hum Comput Stud 2015; 82: 21-30.
[http://dx.doi.org/10.1016/j.ijhcs.2015.04.004] ] analyze how such an overview is provided by a coordinative unit consisting of an ED whiteboard and a coordinating nurse, thereby suggesting that a visualization on the whiteboard will not suffice. A person tasked with maintaining an overview of the ED may be necessary. Second, the disincentive faced by the inpatient departments may make them reluctant toward visualizations aimed at creating interdepartmental transparency about free beds. A more effective negotiated transparency can, probably, be achieved by the daily bed meeting among the department heads. This suggests that a visualization of ED crowding should be approached as an intradepartmental tool in order to increase acceptance, avoid gaming, and target issues on which the ED clinicians have influence.
5.3. Prospects of Visualizing Crowding
One approach to the visualization of crowding would be to relate the demand for ED services directly to the available resources. Given a rating of the clinicians’ level of competence and the patient conditions they are trained to handle it would, for example, be possible to relate the evolving mix of patients to the present supply of clinician resources. It may, however, be difficult to rate the clinicians with sufficient accuracy and controversial to make such explicit ratings of the individual clinicians. In addition, Asplin et al. [11Asplin BR, Flottemesch TJ, Gordon BD. Developing models for patient flow and daily surge capacity research. Acad Emerg Med 2006; 13(11): 1109-13.
[http://dx.doi.org/10.1111/j.1553-2712.2006.tb01632.x] [PMID: 17015412] ] contend that “deviations from expected LOS or census may be more important predictors of quality outcomes than absolute LOS or census”. This contention suggests that visualizations of crowding should relate the evolving state of the ED to its normal state, rather than relate demand to available resources.
The normal state of the ED is recorded in the log data from the ED whiteboard. The temporal pattern that explains most of the variance in the inflow of patients is the hour of the day. Thus, a simple but informative visualization could show today’s patient arrivals on the background of the normal hour-by-hour pattern in patient arrivals. In Fig. (4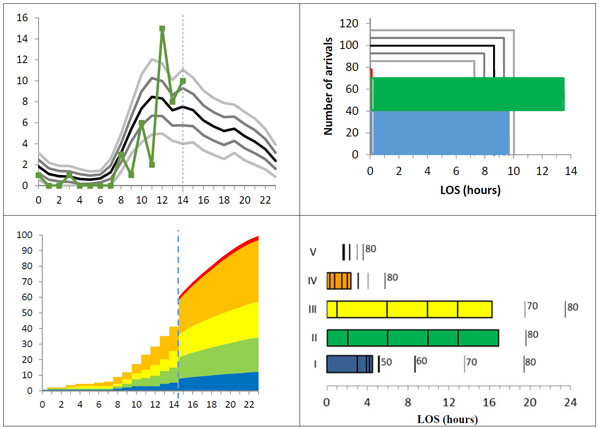 ) (top left) the background curves show the mean number of arrivals for the present day of the week (Monday) and the mean plus/minus half of the standard deviation and plus/minus the standard deviation. That is, the background curves divide the number of arrivals into six bands, each containing roughly one sixth of the historical data and, thereby, provide a context for interpreting today’s arrivals and estimating how their number is likely to evolve from the present time (14 o’clock) onward.
To provide information about throughput and output, length of stay must also be visualized. A compact way of adding information about length of stay to the number of arrivals is by leaving out information about the time of day (Fig. 4, top right). Today’s arrivals are broken into those who are no longer in the ED (blue), those who are currently in the ED (green), and those who have been announced for arrival but who have not yet arrived (red). Announced patients are also recorded on the whiteboard and provide explicit information about upcoming arrivals. For each group, the visualization gives the number of patients and their average length of stay. The background curves again show the mean, the mean plus/minus half of the standard deviation, and the mean plus/minus the standard deviation, for the present day of the week. As time passes, patients will move through the announced and current groups to the past group and the visualization will change.

A more elaborate visualization would also include information about the patients’ triage level because length of stay differs across the triage levels and because the time spent on the different treatment activities must be assessed relative to the patient’s triage level. In Fig. (4) (bottom) the left-hand part shows today’s accumulated patient arrivals until the present time of day (14 o’clock) divided onto triage levels and, thereafter, the historical mean number of arrivals for the present day of the week (Monday). The right-hand part of the visualization shows the length of stay for each triage level with indicators inside the bars giving the time for the main activities in the ED treatment workflow and indicators outside the bars marking selected percentile values in length of stay (e.g., 80% of the historical patients triaged at this level stayed in the ED for at most the time indicated by the 80 percentile).
We note three implications important to the prospects of visualizing ED crowding. First, visualizations require reliable data. The last visualization is the most diagnostic but it also involves data that are, at present, not recorded consistently. In the log data, triage levels are present for 74% of the patients and none of the main activities in the ED treatment workflow are present for more than 55% of the patients. The frequent absence of data beyond patients’ arrival and leaving times is a result of the constant tension between treating patients and documenting treatments. This tension is aggravated by the status of the whiteboard as a transitional artifact. Transitional artifacts hold procedural information and, thereby, fill a gap between the work being performed and the formal documentation of it [35Chen Y. Documenting transitional information in EMR. In: Proceedings of the CHI2010 Conference on Human Factors in Computing Systems. New York: ACM Press 2010; pp. 1787-96.
[http://dx.doi.org/10.1145/1753326.1753594] ]. While the procedural information is pertinent to the visualization of crowding, the transitional status of the whiteboard means that it is less consistently kept than the patient records with the formal documentation of the patients’ condition. Second, to achieve a broader range of reliable data, automated updates must replace manual data entry. Such integration of the whiteboard with other electronic systems in the ED would reduce a tiresome bottleneck in the clinicians’ work and improve the prospects of making reliable visualizations. Third, clinicians expect visualizations to be accurate and prognostic [34Jessup M, Wallis M, Boyle J, et al. Implementing an emergency department patient admission predictive tool: insights from practice. J Health Organ Manag 2010; 24(3): 306-18.
[http://dx.doi.org/10.1108/14777261011054635] [PMID: 20698405] ]. We propose visualizations that show data for today on the background of curves showing the historical pattern. This approach leaves the forecasting of future patient visits to the clinicians’ assessment of how today aligns with the historical pattern. An alternative, especially for longer forecasting intervals, is forecasting models based on time series analysis [36Box GE, Jenkins GM, Reinsel GC. Time series analysis: Forecasting and control. 4th ed. New York: Wiley 2008.
[http://dx.doi.org/10.1002/9781118619193] ].
5.4. Limitations
Three limitations should be remembered in interpreting the results of this study. First, the study is based on data from a single ED. It would be valuable to replicate the study in other EDs. These EDs should, preferably, span a range of base levels in the demand and supply of emergency services. Second, only a subset of the fields of information on the whiteboard was consistently filled in by the clinicians. We had information about the arrival time and leaving time of all patients and about the triage level and age of most patients. All other whiteboard information was available for at most half of the patients, though it should in principle be recorded for all patients. As a consequence, factors such as medical specialization and staff shifts are not considered in the analysis of the log data. Also, the possible effects of holidays (apart from weekends) are not analyzed. Third, the proposed visualizations have not been evaluated during ED work. The visualizations are based on data from two years of using the ED whiteboard and match many of the requirements expressed by the interviewees but we acknowledge that evaluation is necessary to assess the practical usefulness of the visualizations.
CONCLUSION
ED crowding is caused by bottlenecks in input, throughput, and output. While the variance in patient inflow in the studied ED can to a substantial extent be explained with calendar variables, a main measure of throughput and output is length of stay, which varies with triage level, patient age, and leaving hour. We propose three visualizations that show today’s patient visits – arrivals and length of stay – on top of curves showing the historical pattern in patient visits for the present day of the week. The visualizations capture factors important to the evolving balance between the demand for ED services and the available resources and, thereby, demonstrate the potential of using data from the ED whiteboard to provide early warnings of crowding. Whereas the whiteboard has a row for each current patient, the early warnings aggregate whiteboard data into a status at the level of the department rather than the individual patient. The clinicians ask for such early warnings but also expect them to be accurate and prognostic. To this end it would be desirable to split length of stay into components such as waiting to be seen, treatment, and boarding because these components can more directly be related to concrete bottlenecks, thereby increasing the diagnosticity of the visualizations. For example, linear workflows affect waiting times, personal competences affect treatment times, and home transports affect boarding times. However, in the studied ED such component times were, at present, not recorded with the consistency required for accurate visualizations. It is for future work to determine how ED clinicians will balance the value they derive from visualizations of crowding against the work they must put into consistently updating the whiteboard to yield accurate visualizations.
CONFLICT OF INTEREST
The author is neither financially, personally, nor otherwise related with the whiteboard vendor and the healthcare region, apart from the professional relations that have evolved in the course of the project.
ACKNOWLEDGEMENTS
This study is part of the Clinical Communication project, which is a research and development collaboration between Region Zealand, Imatis, Roskilde University, and University of Copenhagen. We are grateful to Rasmus Rasmussen at Imatis for extracting the anonymized log data from the electronic whiteboard. The interview was conducted together with John Damm Scheuer and transcribed by Jens Vejrup Lassen.
REFERENCES
| [1] | FitzGerald G, Jelinek GA, Scott D, Gerdtz MF. Emergency department triage revisited. Emerg Med J 2010; 27(2): 86-92. [http://dx.doi.org/10.1136/emj.2009.077081] [PMID: 20156855] |
| [2] | Moskop JC, Sklar DP, Geiderman JM, Schears RM, Bookman KJ. Emergency department crowding, part 1-concept, causes, and moral consequences. Ann Emerg Med 2009; 53(5): 605-11. [http://dx.doi.org/10.1016/j.annemergmed.2008.09.019] [PMID: 19027193] |
| [3] | Hoot NR, Aronsky D. Systematic review of emergency department crowding: causes, effects, and solutions. Ann Emerg Med 2008; 52(2): 126-36. [http://dx.doi.org/10.1016/j.annemergmed.2008.03.014] [PMID: 18433933] |
| [4] | Rondeau KV, Francescutti LH. Emergency department overcrowding: the impact of resource scarcity on physician job satisfaction. J Healthc Manag 2005; 50(5): 327-40. [PMID: 16268411] |
| [5] | Bernstein SL, Aronsky D, Duseja R, et al. The effect of emergency department crowding on clinically oriented outcomes. Acad Emerg Med 2009; 16(1): 1-10. [http://dx.doi.org/10.1111/j.1553-2712.2008.00295.x] [PMID: 19007346] |
| [6] | Bjørn P, Hertzum M. Artefactual multiplicity: A study of emergency-department whiteboards. Comput Support Coop Work 2011; 20(1&2): 93-121. [http://dx.doi.org/10.1007/s10606-010-9126-7] |
| [7] | Aronsky D, Jones I, Lanaghan K, Slovis CM. Supporting patient care in the emergency department with a computerized whiteboard system. J Am Med Inform Assoc 2008; 15(2): 184-94. [http://dx.doi.org/10.1197/jamia.M2489] [PMID: 18096913] |
| [8] | Hertzum M, Simonsen J. Visual overview, oral detail: The use of an emergency-department whiteboard. Int J Hum Comput Stud 2015; 82: 21-30. [http://dx.doi.org/10.1016/j.ijhcs.2015.04.004] |
| [9] | Wong HJ, Caesar M, Bandali S, Agnew J, Abrams H. Electronic inpatient whiteboards: improving multidisciplinary communication and coordination of care. Int J Med Inform 2009; 78(4): 239-47. [http://dx.doi.org/10.1016/j.ijmedinf.2008.07.012] [PMID: 18786851] |
| [10] | American College of Emergency Physicians. Crowding. Ann Emerg Med 2006; 47(6): 585. [http://dx.doi.org/10.1016/j.annemergmed.2006.02.025] [PMID: 16713796] |
| [11] | Asplin BR, Flottemesch TJ, Gordon BD. Developing models for patient flow and daily surge capacity research. Acad Emerg Med 2006; 13(11): 1109-13. [http://dx.doi.org/10.1111/j.1553-2712.2006.tb01632.x] [PMID: 17015412] |
| [12] | Washington DL, Stevens CD, Shekelle PG, Henneman PL, Brook RH. Next-day care for emergency department users with nonacute conditions. A randomized, controlled trial. Ann Intern Med 2002; 137(9): 707-14. [http://dx.doi.org/10.7326/0003-4819-137-9-200211050-00005] [PMID: 12416944] |
| [13] | Scheulen JJ, Li G, Kelen GD. Impact of ambulance diversion policies in urban, suburban, and rural areas of Central Maryland. Acad Emerg Med 2001; 8(1): 36-40. [http://dx.doi.org/10.1111/j.1553-2712.2001.tb00546.x] [PMID: 11136145] |
| [14] | Bucheli B, Martina B. Reduced length of stay in medical emergency department patients: a prospective controlled study on emergency physician staffing. Eur J Emerg Med 2004; 11(1): 29-34. [http://dx.doi.org/10.1097/00063110-200402000-00006] [PMID: 15167190] |
| [15] | McConnell KJ, Richards CF, Daya M, Bernell SL, Weathers CC, Lowe RA. Effect of increased ICU capacity on emergency department length of stay and ambulance diversion. Ann Emerg Med 2005; 45(5): 471-8. [http://dx.doi.org/10.1016/j.annemergmed.2004.10.032] [PMID: 15855939] |
| [16] | Bernstein SL, Verghese V, Leung W, Lunney AT, Perez I. Development and validation of a new index to measure emergency department crowding. Acad Emerg Med 2003; 10(9): 938-42. [http://dx.doi.org/10.1111/j.1553-2712.2003.tb00647.x] [PMID: 12957975] |
| [17] | Marcilio I, Hajat S, Gouveia N. Forecasting daily emergency department visits using calendar variables and ambient temperature readings. Acad Emerg Med 2013; 20(8): 769-77. [http://dx.doi.org/10.1111/acem.12182] [PMID: 24033619] |
| [18] | Jones SS, Thomas A, Evans RS, Welch SJ, Haug PJ, Snow GL. Forecasting daily patient volumes in the emergency department. Acad Emerg Med 2008; 15(2): 159-70. [http://dx.doi.org/10.1111/j.1553-2712.2007.00032.x] [PMID: 18275446] |
| [19] | Rotstein Z, Wilf-Miron R, Lavi B, Shahar A, Gabbay U, Noy S. The dynamics of patient visits to a public hospital ED: a statistical model. Am J Emerg Med 1997; 15(6): 596-9. [http://dx.doi.org/10.1016/S0735-6757(97)90166-2] [PMID: 9337370] |
| [20] | Herring A, Wilper A, Himmelstein DU, et al. Increasing length of stay among adult visits to U.S. Emergency departments, 2001-2005. Acad Emerg Med 2009; 16(7): 609-16. [http://dx.doi.org/10.1111/j.1553-2712.2009.00428.x] [PMID: 19538503] |
| [21] | Horwitz LI, Green J, Bradley EH. US emergency department performance on wait time and length of visit. Ann Emerg Med 2010; 55(2): 133-41. [http://dx.doi.org/10.1016/j.annemergmed.2009.07.023] [PMID: 19796844] |
| [22] | Rathlev NK, Chessare J, Olshaker J, et al. Time series analysis of variables associated with daily mean emergency department length of stay. Ann Emerg Med 2007; 49(3): 265-71. [http://dx.doi.org/10.1016/j.annemergmed.2006.11.007] [PMID: 17224203] |
| [23] | McCarthy ML, Zeger SL, Ding R, et al. Crowding delays treatment and lengthens emergency department length of stay, even among high-acuity patients. Ann Emerg Med 2009; 54(4): 492-503.e4. [http://dx.doi.org/10.1016/j.annemergmed.2009.03.006] [PMID: 19423188] |
| [24] | Pines JM, Mutter RL, Zocchi MS. Variation in emergency department admission rates across the United States. Med Care Res Rev 2013; 70(2): 218-31. [http://dx.doi.org/10.1177/1077558712470565] [PMID: 23295438] |
| [25] | Abraham G, Byrnes GB, Bain CA. Short-term forecasting of emergency inpatient flow. IEEE Trans Inf Technol Biomed 2009; 13(3): 380-8. [http://dx.doi.org/10.1109/TITB.2009.2014565] [PMID: 19244023] |
| [26] | Card SK, Mackinlay JD, Shneiderman B, Eds. Readings in information visualization: Using vision to think. San Francisco, CA: Morgan Kaufmann 1999. |
| [27] | Hornbæk K, Hertzum M. The notion of overview in information visualization. Int J Hum Comput Stud 2011; 69(7&8): 509-25. [http://dx.doi.org/10.1016/j.ijhcs.2011.02.007] |
| [28] | Rasmussen R. Electronic whiteboards in emergency medicine: A systematic review. In: Luo G, Liu J, Yang CC, Eds. Proceedings of the IHI2012 International Health Informatics Symposium. 483-92. [http://dx.doi.org/10.1145/2110363.2110418] |
| [29] | Nielsen RF, Pérez N, Petersen P, Biering K. Assessing time to treatment and patient inflow in a Danish emergency department: a cohort study using data from electronic emergency screen boards. BMC Res Notes 2014; 7: 690. [http://dx.doi.org/10.1186/1756-0500-7-690] [PMID: 25288356] |
| [30] | Greci LS, Parshalle CE, Calvitti A, Renvall MJ. CrowdED: crowding metrics and data visualization in the emergency department. J Public Health Manag Pract 2011; 17(2): E20-8. [http://dx.doi.org/10.1097/PHH.0b013e3181e8b0e9] [PMID: 21297403] |
| [31] | Boyle J, Jessup M, Crilly J, et al. Predicting emergency department admissions. Emerg Med J 2012; 29(5): 358-65. [http://dx.doi.org/10.1136/emj.2010.103531] [PMID: 21705374] |
| [32] | Yoon P, Steiner I, Reinhardt G. Analysis of factors influencing length of stay in the emergency department. CJEM 2003; 5(3): 155-61. [PMID: 17472779] |
| [33] | Biber R, Bail HJ, Sieber C, Weis P, Christ M, Singler K. Correlation between age, emergency department length of stay and hospital admission rate in emergency department patients aged ≥70 years. Gerontology 2013; 59(1): 17-22. [http://dx.doi.org/10.1159/000342202] [PMID: 23128892] |
| [34] | Jessup M, Wallis M, Boyle J, et al. Implementing an emergency department patient admission predictive tool: insights from practice. J Health Organ Manag 2010; 24(3): 306-18. [http://dx.doi.org/10.1108/14777261011054635] [PMID: 20698405] |
| [35] | Chen Y. Documenting transitional information in EMR. In: Proceedings of the CHI2010 Conference on Human Factors in Computing Systems. New York: ACM Press 2010; pp. 1787-96. [http://dx.doi.org/10.1145/1753326.1753594] |
| [36] | Box GE, Jenkins GM, Reinsel GC. Time series analysis: Forecasting and control. 4th ed. New York: Wiley 2008. [http://dx.doi.org/10.1002/9781118619193] |