- Home
- About Journals
-
Information for Authors/ReviewersEditorial Policies
Publication Fee
Publication Cycle - Process Flowchart
Online Manuscript Submission and Tracking System
Publishing Ethics and Rectitude
Authorship
Author Benefits
Reviewer Guidelines
Guest Editor Guidelines
Peer Review Workflow
Quick Track Option
Copyediting Services
Bentham Open Membership
Bentham Open Advisory Board
Archiving Policies
Fabricating and Stating False Information
Post Publication Discussions and Corrections
Editorial Management
Advertise With Us
Funding Agencies
Rate List
Kudos
General FAQs
Special Fee Waivers and Discounts
- Contact
- Help
- About Us
- Search


The Open Ornithology Journal
(Discontinued)
ISSN: 1874-4532 ― Volume 13, 2020
Evidence for a Relationship Between the Movements of the Common Redpoll (Acanthis flammea) and the American Goldfinch (Spinus tristis)
Paul J. Dougherty*, W. Herbert Wilson, Jr.
Abstract
Background:
Many bird species that breed at high latitudes exhibit irregular southward incursions in response to spatial and temporal variation in winter food availability.
Methods:
We analyzed Christmas Bird Count records to compare the migratory behavior of the Common Redpoll (Acanthis flammea), an Arctic breeder known to invade southern latitudes every other winter, with that of the American Goldfinch (Spinus tristis), a closely related finch species that breeds broadly in temperate latitudes in North America.
Results and Discussion:
Historic data indicate that east of the Rocky Mountains, both species overwinter in relatively even numbers across latitudes. In contrast, we found few significant positive correlations between the winter records of each species in different areas along the same longitude. We attribute these patterns to the fact that resource levels and environmental conditions tend to be similar across latitudes. While previous studies of historic data have identified a biennial pattern in the migration of the Common Redpoll, we found evidence that populations of American Goldfinches breeding in the northern parts of the species’ range similarly display significant southward movements every other year. Because these two species breed at different latitudes and show large-scale southward movements during the same years, areas across southern Canada and the northern United States alternate between having high winter abundances of Common Redpolls and American Goldfinches. We propose that these alternations are caused by a shared response to cyclical seed crop failure across the northern regions of North America.
Article Information

Identifiers and Pagination:
Year: 2018Volume: 11
First Page: 1
Last Page: 26
Publisher Id: TOOENIJ-11-1
DOI: 10.2174/1874453201811010001
Article History:
Received Date: 07/12/2017Revision Received Date: 26/12/2017
Acceptance Date: 01/01/2018
Electronic publication date: 31/01/2018
Collection year: 2018
open-access license: This is an open access article distributed under the terms of the Creative Commons Attribution 4.0 International Public License (CC-BY 4.0), a copy of which is available at: (https://creativecommons.org/licenses/by/4.0/legalcode). This license permits unrestricted use, distribution, and reproduction in any medium, provided the original author and source are credited.
* Address correspondence to this author at the Department of Biology, Colby College, 5739 Mayflower Hill Drive, Waterville, ME 04901, USA; Tel: 508-479-1910; E-mails: pdoughel@uwyo.edu, whwilson@colby.edu
| Open Peer Review Details | |||
|---|---|---|---|
| Manuscript submitted on 07-12-2017 |
Original Manuscript | Evidence for a Relationship Between the Movements of the Common Redpoll (Acanthis flammea) and the American Goldfinch (Spinus tristis) | |
1. INTRODUCTION
Seasonal migration has been observed in around 20% of all known bird species [1La Sorte FA, Fink D, Hochachka WM, Kelling S. La Sorte FA, Fink D, Hochachka WM, Kelling S. Convergence of broad scale migration strategies in terrestrial birds. Proc R Soc 2016;
283(1823): p. 9.
[http://dx.doi.org/10.1098/rspb.2015.2588] ]. All of these birds move between distinct areas or habitats in response to factors such as food availability, competition, and climate [2Ramenofsky MJ, Wingfield JC. Regulation of migration. Bioscience 2007; 57: 135-43.
[http://dx.doi.org/10.1641/B570208] ]. Typically, migratory birds travel to the same breeding and nonbreeding grounds with similar timing each year [3Wilson WH Jr. Variability of arrival dates of Maine migratory breeding birds: Implications for detecting climate change. Northeast Nat (Steuben) 2009; 16: 443-54.
[http://dx.doi.org/10.1656/045.016.n311] , 4Newton I. Obligate and facultative migration in birds: Ecological aspects. J Ornithol 2012; 153: 171-80.
[http://dx.doi.org/10.1007/s10336-011-0765-3] ]. However, some species are much less predictable in their movements. For these birds, the locations of adequate resources change from year to year, driving great variation in the distance and timing of yearly migration events [4Newton I. Obligate and facultative migration in birds: Ecological aspects. J Ornithol 2012; 153: 171-80.
[http://dx.doi.org/10.1007/s10336-011-0765-3] ].
Many northern hemisphere seed-eating species exhibit variation in migratory behavior. Although these birds encompass a range of families, some of the most well-studied examples are finches in the family Fringillidae. Species that breed in the subarctic and boreal latitudes move predominantly in response to the synchronized masting cycles of
key food-producing tree species that cause the availability of adequate wintertime food to change geographically from year to year [5Smith KG. Winter population dynamics of three species of mast-eating birds in the eastern United States. Wilson Bull 1986; 98: 407-18.]. Many of these finches are capable of surviving the winter months in or near their typical breeding grounds when sufficient food remains available year-round. In winters when seed and fruit crop failures occur throughout the northern latitudes, entire populations can move south and irrupt into localities with sufficient food [6Bock CE, Lepthien LW. Synchronous eruptions of boreal seed-eating birds. Am Nat 1976; 110: 559-71.[http://dx.doi.org/10.1086/283091] ].
Although large-scale southern irruptions often seem to be isolated events, many studies have identified consistent patterns in fringillid movements by analyzing historic records. Extensive databases of citizen-reported data allow for the investigation of these patterns. Among the most useful has been the Christmas Bird Count (CBC), an annual birding census dating back to 1900 overseen by the National Audubon Society. The purpose of the program is to observe changes in winter bird populations over time by collecting observations from the same areas throughout North America each year [7National Audubon Society [homepage on the internet]. Audubon: Christmas Bird Count 2017. Available from: http://www.audubon.org/ 2017. [updated 2017 April 6, cited 2017 April 7]].
Analyses of CBC data and other sources, such as band reencounter data, have greatly improved our understanding of irruptive movements [6Bock CE, Lepthien LW. Synchronous eruptions of boreal seed-eating birds. Am Nat 1976; 110: 559-71.
[http://dx.doi.org/10.1086/283091] , 8Kennard JH. Biennial rhythm in Purple Finch migration. Bird Band 1977; 46: 55-73.
[http://dx.doi.org/10.2307/4512096] -11Prescott DR. Winter distribution of age and sex classes in an irruptive migrant, the Evening Grosbeak (Coccothraustes vespertinus). Condor 1991; 93: 694-700.
[http://dx.doi.org/10.2307/1368201] ]. However, most existing studies are limited in spatial or temporal scale. Although multiple studies indicate that irruptive species tend to invade southwards in large numbers every other year, it is unclear how the strength of this biennial pattern varies among regions and between northern-breeding and southern-breeding species. Additionally, while previous studies of band reencounter data suggest that fringillid populations move predominantly on a north-south basis without significant east-west movements, it is uncertain if populations that breed at different longitudes move concurrently [10Wilson WH Jr, Brown B. Fidelity and interseason movements of Purple Finches (Carpodacus purpureus): Analysis of band re-encounter data. Open Ornithol J 2012; 5: 61-72.
[http://dx.doi.org/10.2174/1874453201205010061] ].
Most existing studies of winter irruptions are usually focused on a single species [8Kennard JH. Biennial rhythm in Purple Finch migration. Bird Band 1977; 46: 55-73.
[http://dx.doi.org/10.2307/4512096] -12Hochachka WM, Wells JV, Rosenberg KV, Tessaglia-Hymes DL, Dhondt AA. Irruptive migration of common Redpolls. Condor 1999; 101: 195-204.
[http://dx.doi.org/10.2307/1369983] ]. Studies that compare the movements of multiple species at once usually analyze records for only boreal-breeding species [6Bock CE, Lepthien LW. Synchronous eruptions of boreal seed-eating birds. Am Nat 1976; 110: 559-71.
[http://dx.doi.org/10.1086/283091] , 13Wilson WH Jr. Bird feeding and irruptions of northern finches: Are migrations short-stopped? N Am Bird Bander 1999; 24: 113-21.-16Wilson WH Jr. Winter movements of Common Redpolls and Pine Siskins within and between winters. N Am Bird Bander 2008; 33: 169-73.]. In this paper, we analyze CBC data to compare the winter movements of the Common Redpoll, a primarily boreal fringillid, with the movements of the American Goldfinch, a species that breeds much farther south.
In North America, the Common Redpoll (Acanthis flammea) breeds across northern Canada and Alaska. Previous studies have identified a biennial pattern in the migration of this species, with large numbers moving southward every other winter [6Bock CE, Lepthien LW. Synchronous eruptions of boreal seed-eating birds. Am Nat 1976; 110: 559-71.
[http://dx.doi.org/10.1086/283091] ]. During invasion years, most redpolls overwinter across southern Canada and the northern United States [12Hochachka WM, Wells JV, Rosenberg KV, Tessaglia-Hymes DL, Dhondt AA. Irruptive migration of common Redpolls. Condor 1999; 101: 195-204.
[http://dx.doi.org/10.2307/1369983] ]. In contrast, the American Goldfinch (Spinus tristis) breeds in open habitats across southern Canada south through the central United States. Although the winter movements of this species are not as dramatic as those of the Common Redpoll, the American Goldfinch also makes irregular southward movements from its breeding areas. Despite the striking latitudinal difference between the breeding ranges of these two species, the Common Redpoll and the American Goldfinch breed in the same longitudes in North America, have roughly the same body size, and both feed on small seeds [17Knox AG, Lowther PE. Common Redpoll (Acanthis flammea), Cornell Lab of Ornithol; Retrieved from: the Birds of North America Online 2000; http://bna.birds.cornell.edu/bna/species/543. 2000., 18McGraw KJ, Middleton AL. American Goldfinch (Spinus tristis), The birds of north America Cornell Lab of ornithology; Retrieved from: 2009; https://birdsna.org/SpeciesAccount/bna/species/amegfi.doi:10.2173/bna.80 2009.].
In this study, we first use CBC records to investigate the movement patterns of the Common Redpoll and the American Goldfinch for the entire continental United States and all of Canada over the past 55 years. For each species, we compare patterns in yearly winter abundance between different areas within four latitudinal tiers and four longitudinal tiers. This comprehensive approach provides greater understanding of each species’ movements on a large scale. After identifying patterns in the winter movements of each species, we then compare trends in winter abundance between the Common Redpoll and the American Goldfinch within the same four latitudinal tiers and four longitudinal tiers. While several studies have identified synchronicity in the movements of many boreal breeding fringillids due to shared food sources, the relationship between the movements of fringillids with latitudinally disparate breeding ranges remains unclear. Comparing the migration patterns of these two finches increases our understanding of facultative migration in irruptive species.
2. METHODS
2.1. Area Comparisons
To examine patterns in irruptions across latitudes and longitudes, we subdivided the North American continent into eight tiers (Table 1 and Fig. 1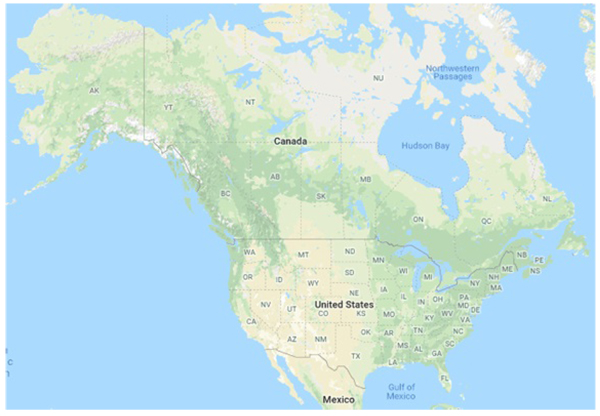 ):
):
- Latitudinal Tier 1 (Southern Canada): Prince Edward Island, Nova Scotia, New Brunswick, Newfoundland and Labrador, Quebec, Ontario, Manitoba, Saskatchewan, Alberta, British Columbia.
- Latitudinal Tier 2 (Northern United States): Maine, New Hampshire, Vermont, New York, Ontario, Michigan, Wisconsin, Minnesota, North Dakota, Montana, Idaho, Washington.
- Latitudinal Tier 3 (Mid United States): Rhode Island, Connecticut, New Jersey, Pennsylvania, Ohio, Indiana, Illinois, Iowa, Nebraska, Wyoming, Idaho, Oregon.
- Latitudinal Tier 4 (Southern United States): North Carolina, Tennessee, Arkansas, Oklahoma, Texas, New Mexico, Arizona, California.
- Longitudinal Tier 1 (East Coast): Newfoundland and Labrador, Quebec, Maine, New Hampshire, Massachusetts, Rhode Island, Connecticut, New Jersey, Maryland, Virginia, North Carolina, South Carolina, Georgia.
- Longitudinal Tier 2 (Midwest): Manitoba, Minnesota, Iowa, Missouri, Arkansas, Louisiana.
- Longitudinal Tier 3 (Rocky Mountains): Northwest Territories, Saskatchewan, Montana, Wyoming, Colorado, New Mexico, Texas.
- Longitudinal Tier 4 (West Coast): Alaska, Yukon Territory, British Columbia, Washington, Oregon, California.
2.2. Christmas Bird Count Data
We acquired state and province-level CBC records from the open-source Christmas Bird Count online database. Although this program began in 1900, it had comparatively limited participation in the first half of the twentieth century. Therefore, we excluded all records before the year 1960 from our analyses.
 |
Fig. (1) Political map of the continental United States and Canada with two-letter abbreviations for each US state and Canadian province. Map data: Google, INEGI. |
2.3. Statistical Analyses
To control differences in effort among Christmas Count circles, abundance is recorded as the number of birds seen per party-hour. For both the Common Redpoll and the American Goldfinch, we created line graphs representing the yearly number seen by party-hour over time in the states and provinces within each of our latitudinal and longitudinal tiers. We used Pearson correlation analyses on these abundance patterns to look for correlations in abundance between tiers. Finally, we compared the historic abundance trends of the Common Redpoll and the American Goldfinch in each tier by plotting the average number of each species seen by party hour in all the areas in each tier over time. We tested for correlations between abundance records of the two species in each tier.
All exploratory and statistical analyses were done with the programming language R, using the interactive development environment RStudio. Graphs were developed with the ggplot 2 package and correlation plots were developed with the corrplot package. Raw data were organized with the tidyverse packages.
3. RESULTS
3.1. Common Redpoll
Across the northernmost latitudinal tier, Christmas Bird Count records show rises and falls in Common Redpoll abundance that are mostly synchronous in different provinces. With the exception of Newfoundland and Labrador and New Brunswick, historic abundance trends in all provinces show significant positive correlations with trends in most other provinces (Fig. 2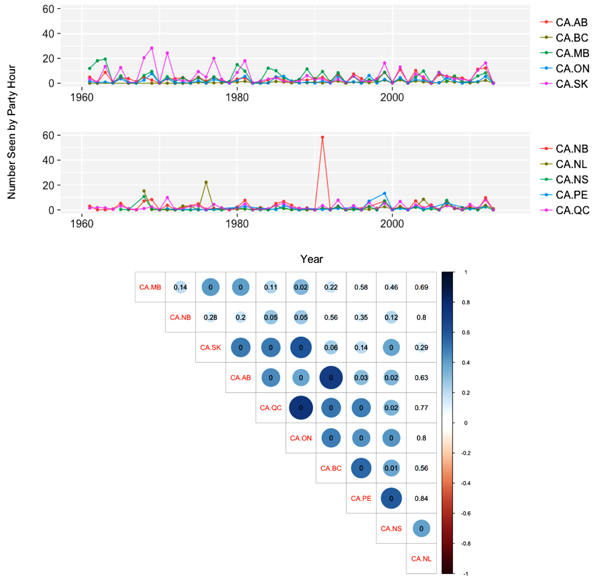 ).
).
 |
Fig. (2) Common Redpoll abundance trends and area correlations across northern (Canadian) latitudinal tier, Christmas Bird Count data. |
Blue circles indicate positive correlations, while red circles indicate negative correlations. The p-value for each correlation is given.
Similarly, areas in the second latitudinal tier show concurrent spikes in Common Redpoll abundance over the study period. Records from all states except for Montana, Idaho, and Washington show significant positive correlations with each other (Fig. 3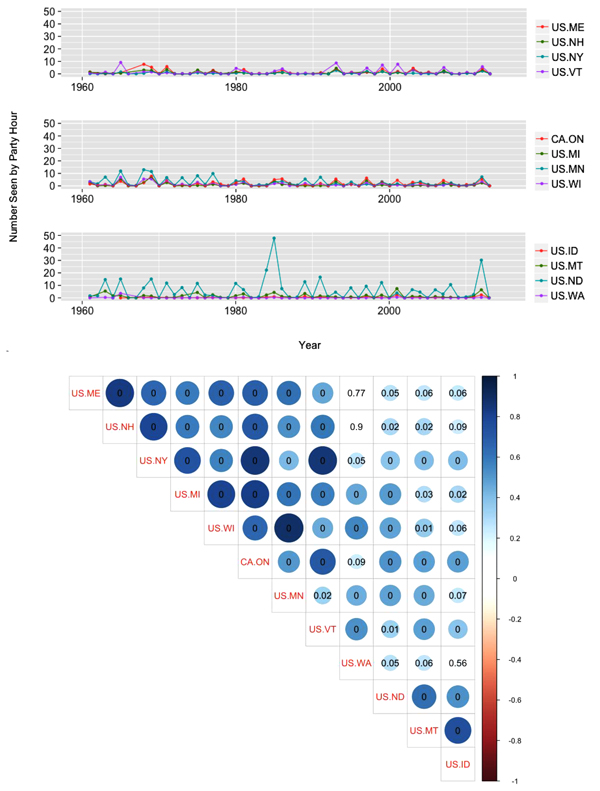 ).
).
 |
Fig. (3) Common Redpoll abundance trends and area correlations across 2nd (northern US) latitudinal tier, Christmas Bird Count data. |
Blue circles indicate positive correlations, while red circles indicate negative correlations. The p-value for each correlation is given.
The Christmas Bird Count has recorded comparatively few Common Redpolls in the third latitudinal tier. There are occasional abundance spikes sometimes shared by states across the tier. Records from states that are close together show significant positive correlations with each other (Fig. 4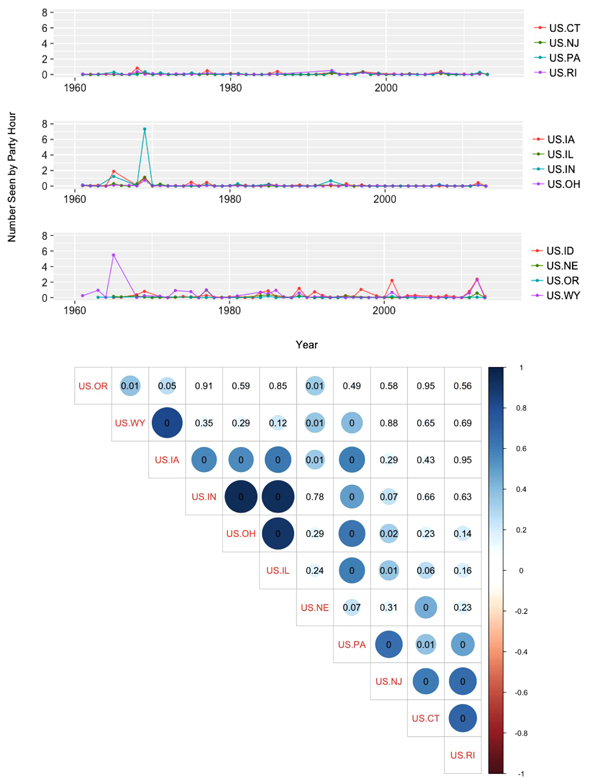 ).
).
 |
Fig. (4) Common Redpoll abundance trends and area correlations across 3rd (mid US) latitudinal tier, Christmas Bird Count data. |
Blue circles indicate positive correlations, while red circles indicate negative correlations. The p-value for each correlation is given.
We could not compare winter abundance trends for the Common Redpoll in the designated fourth latitude due to the paucity of CBC records for this species in states in this tier.
In the easternmost longitude, CBC records show large spikes in Common Redpoll abundance in several of the provinces and states in the north part of the tier. Many of these abundance spikes occur in the same years across multiple areas. There are few records of Common Redpolls in the southern US states in this tier. CBC records show significant positive correlations between states in the middle of the tier where small numbers of Common Redpolls are regularly recorded, and between the southernmost states in the tier where there are hardly any records of Common Redpolls during the study period (Fig. 5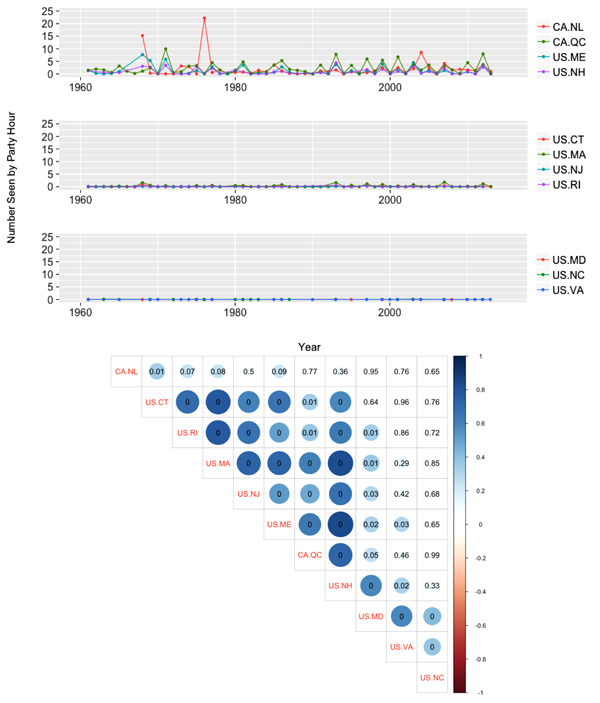 ).
).
 |
Fig. (5) Common Redpoll abundance trends and area correlations across 1st (Atlantic) longitudinal tier, Christmas Bird Count data. |
Blue circles indicate positive correlations, while red circles indicate negative correlations. The p-value for each correlation is given.
Down the second longitudinal tier, CBC records for the Common Redpoll in northern areas show synchronous but consistently differently sized abundance spikes during the study period. The records for these areas show significant positive correlations with each other. There are also significant positive correlations between southern areas that have few records of Common Redpolls. Records for Minnesota show significant positive correlations with records from all other areas in the tier (Fig. 6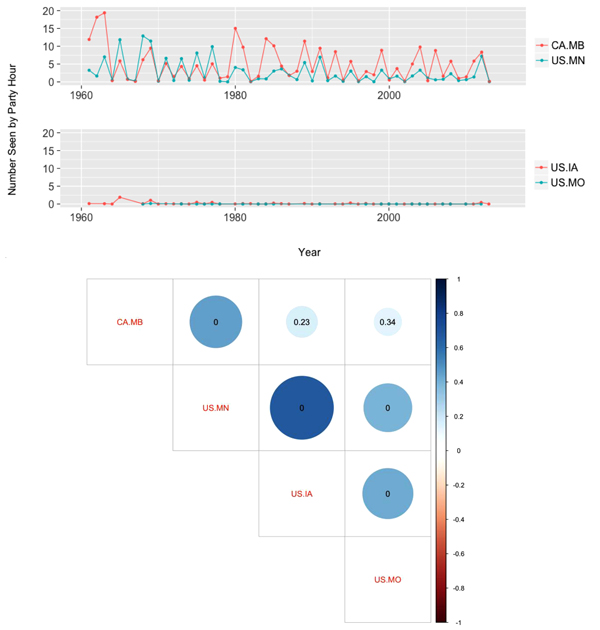 ).
).
 |
Fig. (6) Common Redpoll abundance trends and area correlations across 2nd (midwest) longitudinal tier, Christmas Bird Count data. |
Blue circles indicate positive correlations, while red circles indicate negative correlations. The p-value for each correlation is given.
Down the third longitudinal tier, CBC records show significant positive correlations between nearly all areas. Abundance spikes are synchronous but consistently different in magnitude in different areas across the study period. Records from the Northwest Territories do not show any significant correlations with records from any other areas from the tier, but this result is likely due to the sparseness of data in this area. There are few records of this species in the southernmost two states in the tier (Fig. 7 ).
).
 |
Fig. (7) Common Redpoll abundance trends and area correlations across 3rd (Rocky Mountains) longitudinal tier, Christmas Bird Count data. |
Blue circles indicate positive correlations, while red circles indicate negative correlations. The p-value for each correlation is given.
In the fourth longitudinal tier, CBC records show comparatively few significant correlations between different areas. Although many large spikes in abundance have been recorded for this species in the northernmost three areas in the tier, they are only sometimes concurrent. In many cases, large abundance spikes alternate between different areas (Fig. 8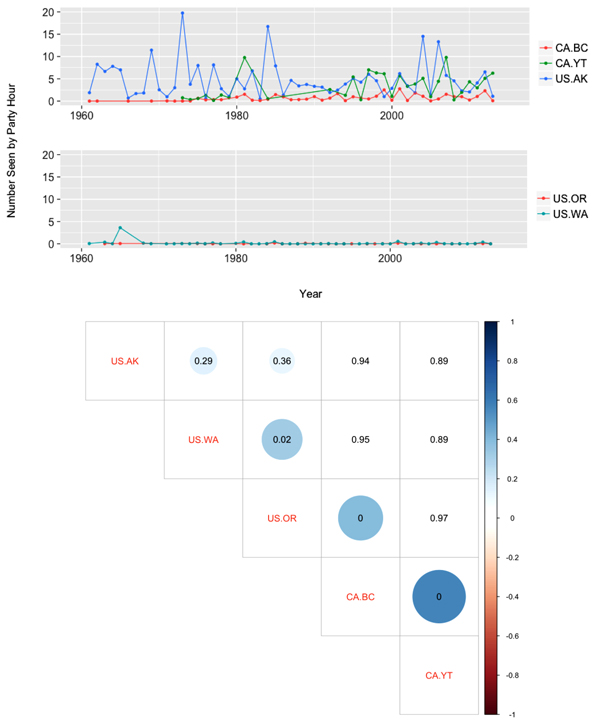 ).
).
 |
Fig. (8) Common Redpoll abundance trends and area correlations across 4th (Pacific) longitudinal tier, Christmas Bird Count data. |
Blue circles indicate positive correlations, while red circles indicate negative correlations. The p-value for each correlation is given.
3.2. American Goldfinch
CBC data show that in the northernmost latitudinal tier, rises and falls in American Goldfinch winter abundance are usually similarly timed in different provinces. Eastern provinces show consistently higher numbers of American Goldfinches with more dramatic fluctuations in the latter half of the study period. Despite these dramatic fluctuations, most eastern provinces show an overall increase in American Goldfinch winter abundance over time. Western provinces show comparatively low numbers of the species throughout the period. There are significant positive correlations between the records for most provinces (Fig. 9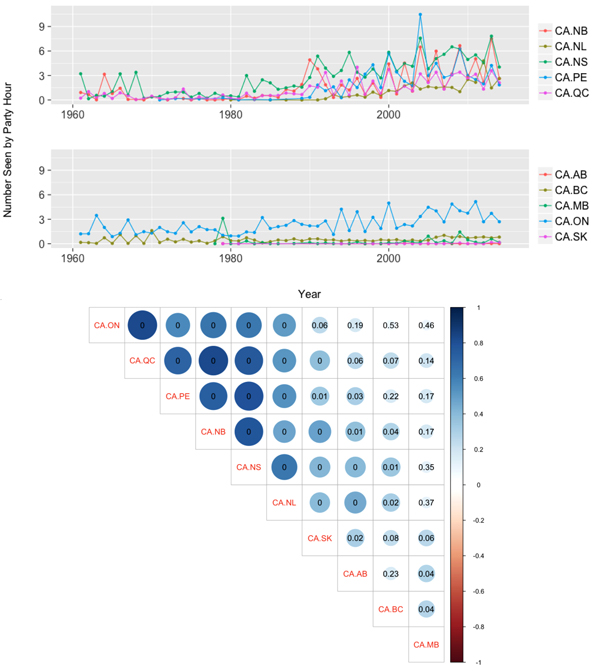 ).
).
 |
Fig. (9) American Goldfinch abundance trends and area correlations across 1st (Canadian) latitudinal tier, Christmas Bird Count data. |
Blue circles indicate positive correlations, while red circles indicate negative correlations. The p-value for each correlation is given.
CBC data show that in the second latitudinal tier, rises and falls in American Goldfinch winter abundance are mostly similarly timed in different areas. The three westernmost states in the tier show comparatively small changes in abundance over time. With the exceptions of Idaho and Montana, records from most areas show significant positive correlations with each other (Fig. 10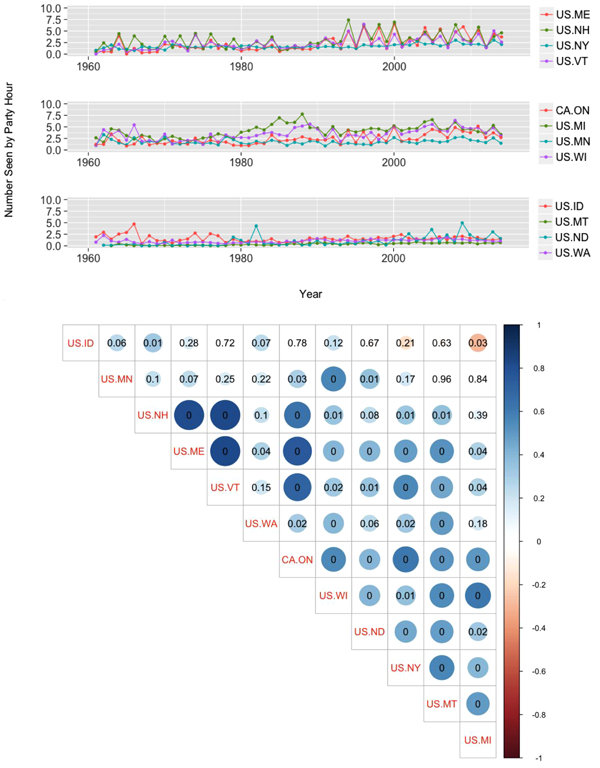 ).
).
 |
Fig. (10) American Goldfinch abundance trends and area correlations across 2nd (northern US) latitudinal tier, Christmas Bird Count data. |
Blue circles indicate positive correlations, while red circles indicate negative correlations. The p-value for each correlation is given.
In the third latitudinal tier, CBC records overall show less dramatic fluctuations in American Goldfinch winter abundance than in the first and second latitudinal tiers. In the third tier, rises and falls in abundance are not synchronous among different states. There are significant positive correlations between the records of some states that are near to each other, while some state pairings show significant negative correlations (Fig. 11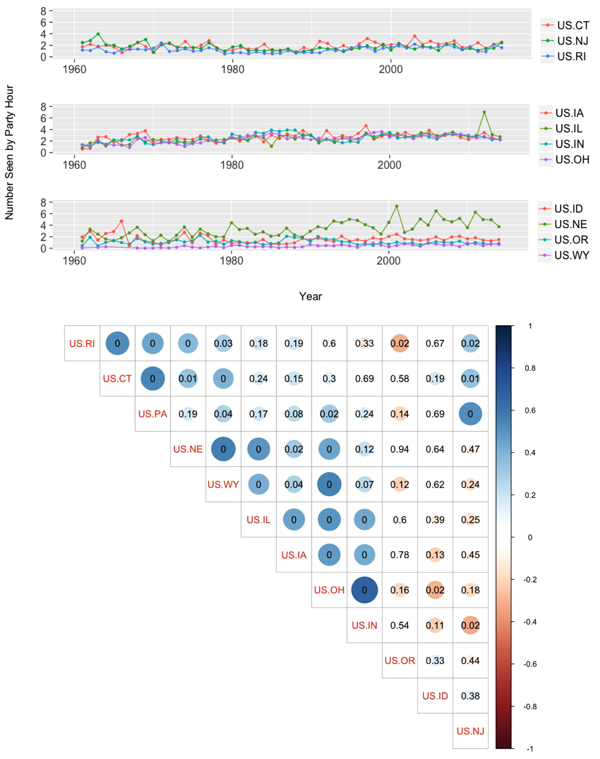 ).
).
 |
Fig. (11) American Goldfinch abundance trends and area correlations across 3rd (mid US) latitudinal tier, Christmas Bird Count data. |
Blue circles indicate positive correlations, while red circles indicate negative correlations. The p-value for each correlation is given.
Similarly, CBC data from the southernmost latitudinal tier overall show comparatively small changes in American Goldfinch winter abundance over time. However, existing spikes in abundance are mostly synchronous across states. There are significant positive correlations between the records of states that are near to each other (Fig. 12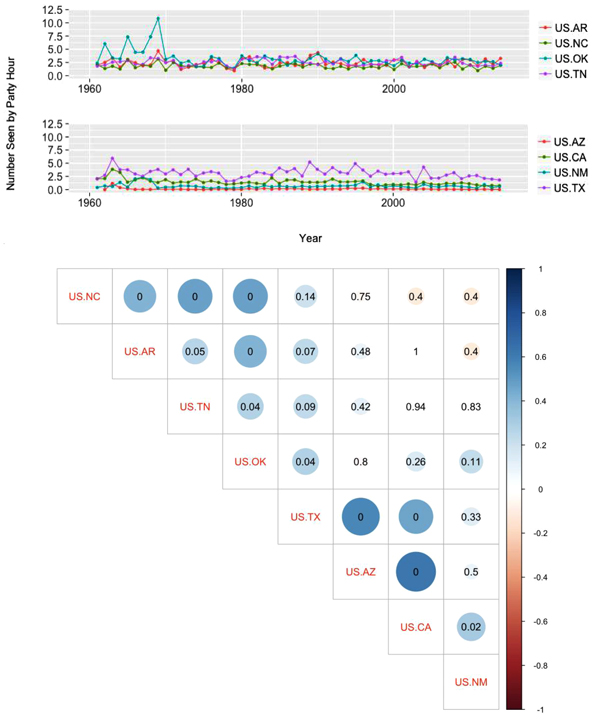 ).
).
 |
Fig. (12) American Goldfinch abundance trends and area correlations across 4th (southern US) latitudinal tier, Christmas Bird Count data. |
Blue circles indicate positive correlations, while red circles indicate negative correlations. The p-value for each correlation is given.
CBC data show that in the easternmost longitudinal tier, northern areas show the most variation in American Goldfinch winter abundance, and often alternate in having high abundance with southern areas. This is reflected by how there are significant positive correlations between the records in areas in the northern half of the tier, and between the records in states in the southern half of the tier, while there are significant negative correlations between the northern areas and southern areas (Fig. 13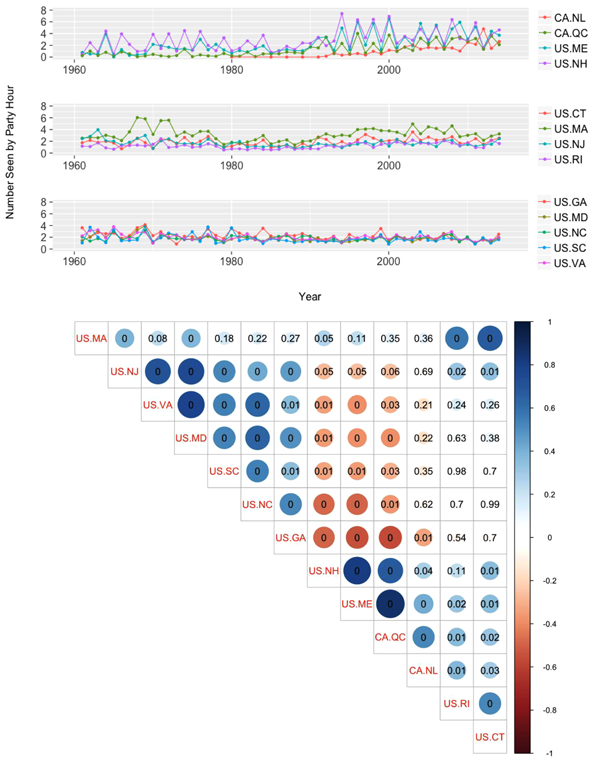 ).
).
 |
Fig. (13) American Goldfinch abundance trends and area correlations across 1st (Atlantic) longitudinal tier, Christmas Bird Count data. |
Blue circles indicate positive correlations, while red circles indicate negative correlations. The p-value for each correlation is given.
CBC data show that in the second longitude, different areas sometimes show synchronized spikes in the winter abundance of American Goldfinch. Few significant correlations between the records occur in different areas (Fig. 14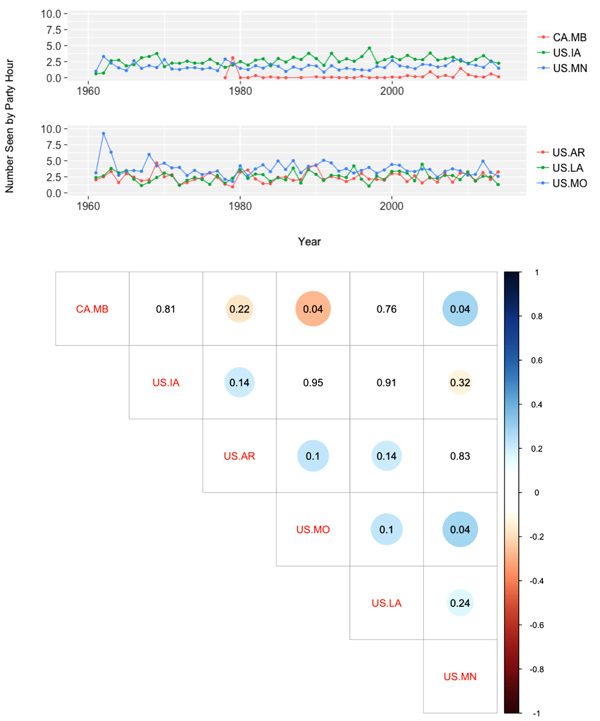 ).
).
 |
Fig. (14) American Goldfinch abundance trends and area correlations across 2nd (midwest) longitudinal tier, Christmas Bird Count data. |
Blue circles indicate positive correlations, while red circles indicate negative correlations. The p-value for each correlation is given.
CBC data show that in the third longitudinal tier, most areas show little variation in the winter abundance of the American Goldfinch over time. The highest numbers and the greatest variation are reported in the southernmost area in the tier. There are significant positive correlations between areas that are close together, and a significant negative correlation between the records from Saskatchewan and Texas, although this is likely due only to the paucity of records from Saskatchewan. Due to lack of CBC records, we excluded data from the Northwest Territories from our analyses (Fig. 15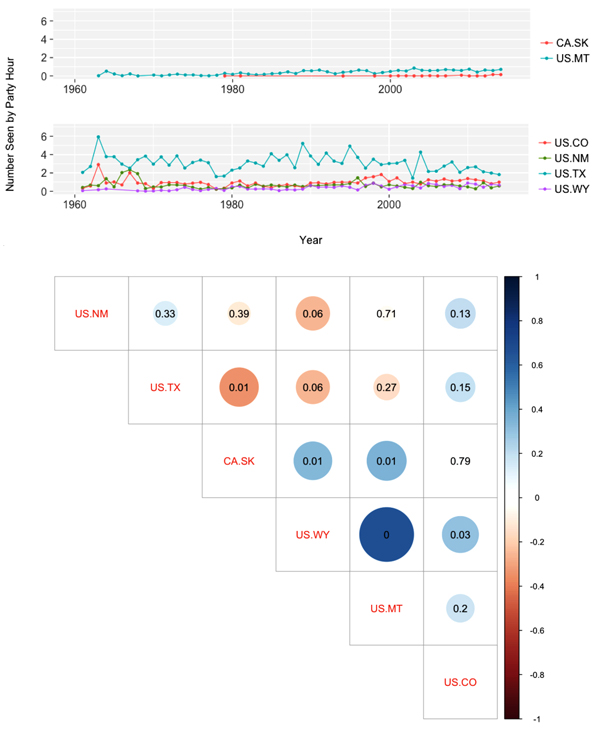 ).
).
 |
Fig. (15) American Goldfinch abundance trends and area correlations across 3rd (Rocky Mountains) longitudinal tier, Christmas Bird Count data. |
Blue circles indicate positive correlations, while red circles indicate negative correlations. The p-value for each correlation is given.
CBC data show that in the westernmost longitudinal tier, the greatest variation in American Goldfinch winter abundance in all areas occurs at the start of the study period. California, the southernmost area in the tier, shows a decrease in abundance over time while British Columbia, the northernmost area, shows an increase. There are no significant correlations between the records of any areas in this tier. Due to lack of CBC data, we excluded data from Alaska and British Columbia from our analyses (Fig. 16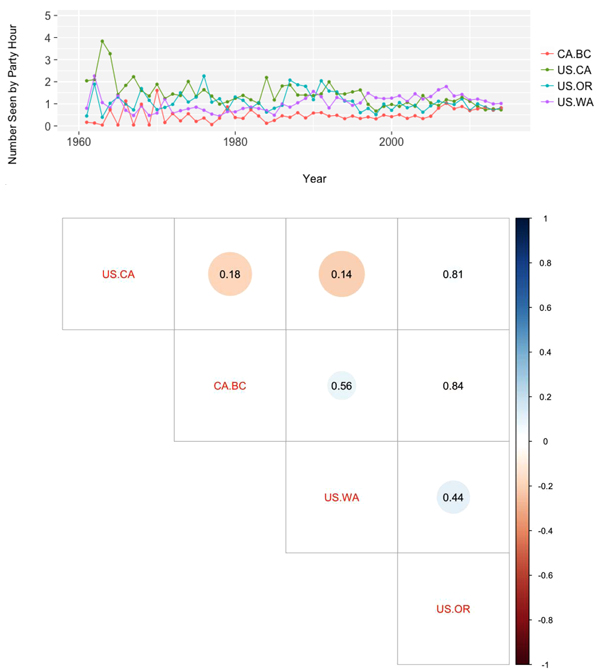 ).
).
 |
Fig. (16) American Goldfinch abundance trends and area correlations across 4th (Pacific) longitudinal tier, Christmas Bird Count data. |
Blue circles indicate positive correlations, while red circles indicate negative correlations. The p-value for each correlation is given.
3.3. Interspecies Comparisons
Along the northernmost latitudinal tier, CBC data show many more dramatic spikes in abundance for the Common Redpoll than for the American Goldfinch. Abundance spikes mostly alternate between the two species over the study period. As a result, there is a significant negative correlation between the records of the two species in this tier (correlation coefficient = -0.14, p-value = 0.00) (Fig. 17 ).
).
 |
Fig. 17) Variability in abundance of American Goldfinches (AMGO) and Common Redpolls (CORE) across 1st (Canadian) latitudinal tier, Christmas Bird Count data. |
Again, in the second latitudinal tier, CBC records for the Common Redpoll show much greater variation than records for the American Goldfinch. The records for the two species in this tier also show alternating rises and falls in abundance. There is a significant negative correlation between the records of the two species (correlation coefficient = -0.22, p-value = 0.00) (Fig. 18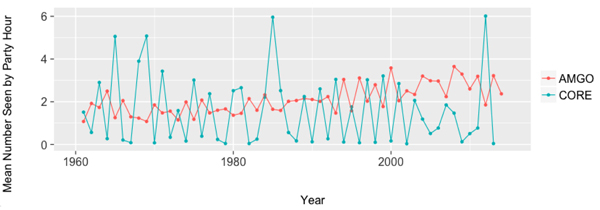 ).
).
 |
Fig. (18) Variability in abundance of American Goldfinches (AMGO) and Common Redpolls (CORE) across 2nd (Northern US) latitudinal tier, Christmas Bird Count data. |
Along the third latitudinal tier, CBC data show much greater numbers of American Goldfinches than Common Redpolls throughout the study period. This tier shows an overall increase in American Goldfinch winter abundance over time. Unlike the previous two tiers, CBC records from the third tier show abundance spikes in both species that are often similarly timed. However, the records for the two species show a significant negative correlation with each other (correlation coefficient = -0.09, p-value= 0.03) (Fig. 19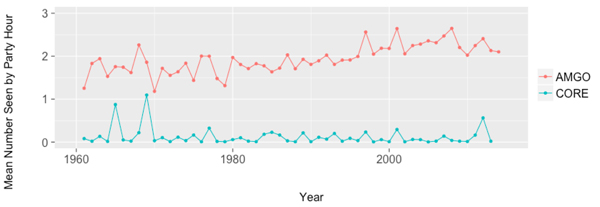 ).
).
 |
Fig. (19) Variability in abundance of American Goldfinches (AMGO) and Common Redpolls (CORE) across 3rd (Mid US) latitudinal tier, Christmas Bird Count data. |
We could not compare winter abundance trends of the two species in the designated fourth latitudinal tier due to lack of records for the Common Redpoll.
Along the easternmost longitudinal tier, CBC data show rises and falls in the winter abundances of the Common Redpoll and the American Goldfinch that mostly alternate with each other in the latter half of the study period. Again, the Common Redpoll shows much greater variation in winter abundance. There is an insignificant negative correlation between the records for the two species in this tier (correlation coefficient= -0.03, p-value = 0.46) (Fig. 20 ).
).
 |
Fig. (20) Variability in abundance of American Goldfinches (AMGO) and Common Redpolls (CORE) across 1st (Atlantic) longitudinal tier, Christmas Bird Count data. |
Along the second longitudinal tier, CBC data show much higher variation in the winter abundance of the Common Redpoll than the American Goldfinch. Abundance spikes mostly alternate between the two species during the study period. There is a significant negative correlation between the records for the two species (correlation coefficient = -0.5, p-value = 0.00) (Fig. 21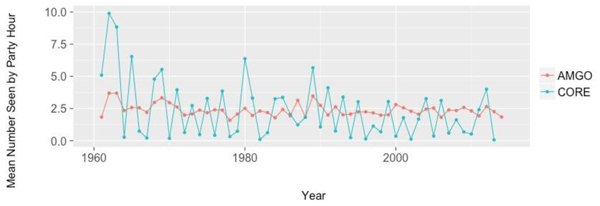 ).
).
CBC records from the third longitudinal tier also show high variation in the winter abundance of Common Redpoll with more consistent numbers of American Goldfinches. There is a significant negative correlation between the records of the two species (correlation coefficient = -0.25, p-value = 0.00) (Fig. 22 ).
).
 |
Fig. (21) Variability in abundance of American Goldfinches (AMGO) and Common Redpolls (CORE) across 2nd (Midwest) longitudinal tier, Christmas Bird Count data. |
 |
Fig. (22) Variability in abundance of American Goldfinches (AMGO) and Common Redpolls (CORE) across 3rd (Rocky Mountain) longitudinal tier, Christmas Bird Count data. |
In the westernmost longitudinal tier, CBC records also show dramatically higher variation in the winter abundance of the Common Redpoll than of the American Goldfinch. Again, there is a significant negative correlation between the records of the two species (correlation coefficient = -0.47, p-value = 0.00) (Fig. 23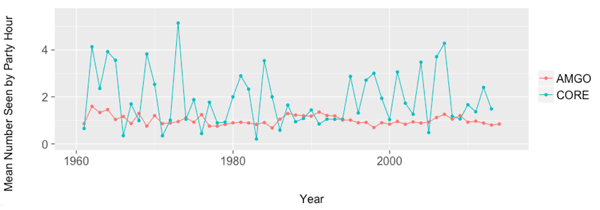 ).
).
 |
Fig. (23) Variability in abundance of American Goldfinches (AMGO) and Common Redpolls (CORE) across 4th (Pacific) longitudinal tier, Christmas Bird Count data. |
4. DISCUSSION
Christmas Bird Count data indicate that the Common Redpoll and the American Goldfinch are represented relatively evenly across latitudes during the winter months in North America. Records for both species show rises and falls in abundance that are for the most part concurrent and similarly sized in different areas across a latitudinal tier. As a result, historic abundance records for both species in US states and Canadian provinces that fall along the same latitudes tend to show positive correlations with each other Figs. (2, 3, 8, 10, 11). Due to the environmental effects of increased elevation [19Stevens GC. The elevational gradient in altitudinal range: An extension of Rapoport’s latitudinal rule to altitude. Am Nat 1992; 140(6): 893-911.
[http://dx.doi.org/10.1086/285447] [PMID: 19426029] ], this pattern is most pronounced east of the Rocky Mountains, particularly in the American Goldfinch. The finding that irruptive species invade in similar numbers across latitudes, combined with the observation of Hochachka et al. [11Prescott DR. Winter distribution of age and sex classes in an irruptive migrant, the Evening Grosbeak (Coccothraustes vespertinus). Condor 1991; 93: 694-700.
[http://dx.doi.org/10.2307/1368201] ] that different populations of Common Redpolls move south independently of one another, suggests that there are consistencies in the ways facultative migrants respond to food shortages in different years and in different areas. While there are some records from band recaptures of individuals moving great distances east or west [20Speirs JM. Birds of Ontario 1985; 986.], as a whole the irruptive fringillids appear to invade in similar numbers across latitudes as different populations move south with relatively similar timing.
Abundance records for both species in areas along the same longitudinal tier are generally more variable each year and show positive correlations only between areas that are geographically close to each other Figs. (5-8, 13, 14). Records for the Common Redpoll from states in the south of our longitudinal tiers often show strong positive correlations with each other because they consistently show very low numbers of this species Figs. (5-8). Spikes in the winter abundance of this species that do occur in areas in the same longitudinal tier are mostly concurrent but consistently differently sized Figs. (5-7). This phenomenon is due to the fact that these abundance spikes represent winters when southward invasions occur, with redpolls wintering in variable densities across a longitude. In many years during the study period, the species is essentially absent from all latitudinal and longitudinal tiers (Figs. 2-8 ). In reality, populations are wintering in areas north of CBC monitoring efforts. Only our westernmost longitudinal tier shows high numbers of wintering Common Redpolls each year because there are count circles farther north in this tier than in the other three (Fig. 8). While the Christmas Bird Count seeks to provide accurate records of bird abundances throughout North America, few counts occur in the northernmost reaches of the continent where redpolls overwinter when they remain in or near their breeding grounds all year. The Common Redpoll regularly occurs in CBC circles only during irruption years [6Bock CE, Lepthien LW. Synchronous eruptions of boreal seed-eating birds. Am Nat 1976; 110: 559-71.
[http://dx.doi.org/10.1086/283091] ].
While the CBC dataset does not completely represent the historic abundance trends of the Common Redpoll and most other irruptive North American species, it encompasses the regular year-round distributions of fringillids that breed farther south. As a result, CBC records for the American Goldfinch show a biennial pattern of high winter abundance between areas in the north and areas in the south at least to the extent in all of our designated longitudinal tiers Figs. (13-16). The pattern is most apparent in the easternmost longitudinal tier, which consistently has high numbers of wintering American Goldfinches Fig. (13). These results indicate that this species, possibly along with other temperate-breeding fringillids, is also a facultative migrant. While analyses of banding data have identified differences in the migratory behavior of different sexes and age classes within this species [21Prescott DR, Middleton AL. Age and sex differences in winter distribution of American Goldfinches in eastern North America. Ornis Scand 1990; 21: 99-104.
[http://dx.doi.org/10.2307/3676804] ], CBC records indicate that overall, significant southward movements of American Goldfinch populations occur every other winter.
Both the Common Redpoll and the American Goldfinch appear to primarily move on a north-south basis and show a biennial pattern in their migration. However, CBC data show significant negative correlations in historic abundance trends between the Common Redpoll and the American Goldfinch in all but one of the tiers that we tested. In years when Common Redpolls irrupt southward into latitudes regularly monitored by the Christmas Bird Count, American Goldfinches occur in these areas in lower densities than in winters when Common Redpolls are absent Figs. (17, 18). Although the physiological capabilities of the Common Redpoll have not yet been studied, the winter distribution of the American Goldfinch is thought to be at least partly governed by temperature and inhibitory effects of snow accumulation on foraging opportunities [22Root TR. Atlas of wintering North American birds: An analysis of Christmas Bird Count data 1988. b]. Fringillid species that breed in southern latitudes are less cold-tolerant than their northern breeding relatives, and co-occurrence of species from these two groups could be limited by the fact that southern species are driven southward by cold weather when northern species visit their typical breeding ranges [18McGraw KJ, Middleton AL. American Goldfinch (Spinus tristis), The birds of north America Cornell Lab of ornithology; Retrieved from: 2009; https://birdsna.org/SpeciesAccount/bna/species/amegfi.doi:10.2173/bna.80 2009.]. However, this explanation would require that winters alternate between high and low temperatures every other year in southern Canada and the northern United States.
Instead, we believe that consistent patterns in food availability are the most likely cause for the negative correlations between Christmas Bird Count records of the Common Redpoll and the American Goldfinch. It is possible that influxes of Common Redpolls in southern Canada and the northern United States could reduce food supplies for American Goldfinches through interspecific competition. Indeed, both species feed on small seeds, and intraspecific competition has been observed to impact the behavior of American Goldfinches at winter feeding stations [23Popp JW. Risk and effectiveness in the use of agonistic displays by American Goldfinches. Behaviour 1987; 103: 141-56. e
[http://dx.doi.org/10.1163/156853987X00314] ]. However, aside from studies of introduced House Finches lowering the abundance of Purple Finches in eastern North America [24Wootton JT. Interspecific competition between introduced house finch populations and two associated passerine species. Oecologia 1987; 71(3): 325-31.
[http://dx.doi.org/10.1007/BF00378703] [PMID: 28312977] ], no research describes adverse effects of interspecific competition among populations of gregarious North American fringillid species. If interspecific competition is not the cause of alternation in Common Redpoll and American Goldfinch abundance spikes, perhaps goldfinches breeding in southern Canada and the northern United States move in response to the same force that drives southern invasions of Common Redpolls. Previous studies of facultative migration in fringillids have noted migratory responses to the synchronized masting cycles of high latitude trees in only species that breed in higher latitudes [6Bock CE, Lepthien LW. Synchronous eruptions of boreal seed-eating birds. Am Nat 1976; 110: 559-71.
[http://dx.doi.org/10.1086/283091] , 8Kennard JH. Biennial rhythm in Purple Finch migration. Bird Band 1977; 46: 55-73.
[http://dx.doi.org/10.2307/4512096] , 5Smith KG. Winter population dynamics of three species of mast-eating birds in the eastern United States. Wilson Bull 1986; 98: 407-18., 12Hochachka WM, Wells JV, Rosenberg KV, Tessaglia-Hymes DL, Dhondt AA. Irruptive migration of common Redpolls. Condor 1999; 101: 195-204.
[http://dx.doi.org/10.2307/1369983] , 25Koenig WD, Knops JM. Seed-crop size and eruptions of North American boreal seed-eating birds. J Anim Ecol 2001; 70: 609-20.
[http://dx.doi.org/10.1046/j.1365-2656.2001.00516.x] ]. The fact that large numbers of American Goldfinches migrate south in the same winters that Common Redpoll invasions occur suggests that both species may be moving in response to the same food shortages, and the effects of this phenomenon extend farther south than previously understood. However, the less dramatic changes in goldfinch abundance across our first and second latitudinal tiers suggest that the effects of synchronized masting cycles in high latitude trees are not as pronounced south of the boreal zone, and are possibly mitigated by the presence of different food sources in temperate latitudes.
CONCLUSION
Both the Common Redpoll and the American Goldfinch have evolved to breed in environments with food supplies that are highly variable between years. However, the regular patterns in food availability create patterns in space and time in the seemingly random movements of both species. To test if a previously undocumented competitive interaction exists between these two fringillids, one could examine records of the daily movements of both species to determine if large numbers of goldfinches move south following the arrival of redpolls in southern Canada and the northern United States. eBird data would be useful for this research. If the biennial southward movements of both species are driven by the synchronized masting cycles of high latitude tree species, then our findings indicate that the ecological impacts of these cycles extend much farther south than previously understood.

ETHICS APPROVAL AND CONSENT TO PARTICIPATE
None declared.
HUMAN AND ANIMAL RIGHTS
No human or animal were used in this study.
CONSENT FOR PUBLICATION
Not applicable
CONFLICT OF INTEREST
The authors declare no conflict of interest, financial or otherwise.
ACKNOWLEDGEMENTS
We would like to thank the Colby College Biology Department for providing the resources and opportunities for making this study possible. Specifically, Cathy Bevier and Cathy Collins provided critical comments and suggestions on the manuscript. We would also like to thank all compilers and participants in the Christmas Bird Count, as well as the National Audubon Society for making the data available online.
REFERENCES
| [1] | La Sorte FA, Fink D, Hochachka WM, Kelling S. La Sorte FA, Fink D, Hochachka WM, Kelling S. Convergence of broad scale migration strategies in terrestrial birds. Proc R Soc 2016;
283(1823): p. 9. [http://dx.doi.org/10.1098/rspb.2015.2588] |
| [2] | Ramenofsky MJ, Wingfield JC. Regulation of migration. Bioscience 2007; 57: 135-43. [http://dx.doi.org/10.1641/B570208] |
| [3] | Wilson WH Jr. Variability of arrival dates of Maine migratory breeding birds: Implications for detecting climate change. Northeast Nat (Steuben) 2009; 16: 443-54. [http://dx.doi.org/10.1656/045.016.n311] |
| [4] | Newton I. Obligate and facultative migration in birds: Ecological aspects. J Ornithol 2012; 153: 171-80. [http://dx.doi.org/10.1007/s10336-011-0765-3] |
| [5] | Smith KG. Winter population dynamics of three species of mast-eating birds in the eastern United States. Wilson Bull 1986; 98: 407-18. |
| [6] | Bock CE, Lepthien LW. Synchronous eruptions of boreal seed-eating birds. Am Nat 1976; 110: 559-71. [http://dx.doi.org/10.1086/283091] |
| [7] | National Audubon Society [homepage on the internet]. Audubon: Christmas Bird Count 2017. Available from: http://www.audubon.org/ 2017. [updated 2017 April 6, cited 2017 April 7] |
| [8] | Kennard JH. Biennial rhythm in Purple Finch migration. Bird Band 1977; 46: 55-73. [http://dx.doi.org/10.2307/4512096] |
| [9] | Troy DM. Recaptures of Redpolls: Movements of an irruptive species. J Field Ornithol 1983; 54: 146-51. |
| [10] | Wilson WH Jr, Brown B. Fidelity and interseason movements of Purple Finches (Carpodacus purpureus): Analysis of band re-encounter data. Open Ornithol J 2012; 5: 61-72. [http://dx.doi.org/10.2174/1874453201205010061] |
| [11] | Prescott DR. Winter distribution of age and sex classes in an irruptive migrant, the Evening Grosbeak (Coccothraustes vespertinus). Condor 1991; 93: 694-700. [http://dx.doi.org/10.2307/1368201] |
| [12] | Hochachka WM, Wells JV, Rosenberg KV, Tessaglia-Hymes DL, Dhondt AA. Irruptive migration of common Redpolls. Condor 1999; 101: 195-204. [http://dx.doi.org/10.2307/1369983] |
| [13] | Wilson WH Jr. Bird feeding and irruptions of northern finches: Are migrations short-stopped? N Am Bird Bander 1999; 24: 113-21. |
| [14] | LeBaron GS. Invasions, irruptions, and trends: The Christmas Birdcount database. N Am Birds 1999; 53: 217-9. |
| [15] | Wilson WH Jr. Evidence of flock fidelity in common Redpolls and Pine Siskins. N Am Bird Bander 2006; 31: 105-9. |
| [16] | Wilson WH Jr. Winter movements of Common Redpolls and Pine Siskins within and between winters. N Am Bird Bander 2008; 33: 169-73. |
| [17] | Knox AG, Lowther PE. Common Redpoll (Acanthis flammea), Cornell Lab of Ornithol; Retrieved from: the Birds of North America Online 2000; http://bna.birds.cornell.edu/bna/species/543. 2000. |
| [18] | McGraw KJ, Middleton AL. American Goldfinch (Spinus tristis), The birds of north America Cornell Lab of ornithology; Retrieved from: 2009; https://birdsna.org/SpeciesAccount/bna/species/amegfi.doi:10.2173/bna.80 2009. |
| [19] | Stevens GC. The elevational gradient in altitudinal range: An extension of Rapoport’s latitudinal rule to altitude. Am Nat 1992; 140(6): 893-911. [http://dx.doi.org/10.1086/285447] [PMID: 19426029] |
| [20] | Speirs JM. Birds of Ontario 1985; 986. |
| [21] | Prescott DR, Middleton AL. Age and sex differences in winter distribution of American Goldfinches in eastern North America. Ornis Scand 1990; 21: 99-104. [http://dx.doi.org/10.2307/3676804] |
| [22] | Root TR. Atlas of wintering North American birds: An analysis of Christmas Bird Count data 1988. b |
| [23] | Popp JW. Risk and effectiveness in the use of agonistic displays by American Goldfinches. Behaviour 1987; 103: 141-56. e [http://dx.doi.org/10.1163/156853987X00314] |
| [24] | Wootton JT. Interspecific competition between introduced house finch populations and two associated passerine species. Oecologia 1987; 71(3): 325-31. [http://dx.doi.org/10.1007/BF00378703] [PMID: 28312977] |
| [25] | Koenig WD, Knops JM. Seed-crop size and eruptions of North American boreal seed-eating birds. J Anim Ecol 2001; 70: 609-20. [http://dx.doi.org/10.1046/j.1365-2656.2001.00516.x] |
Endorsements
Browse Contents
Table of Contents
- INTRODUCTION key food-producing tree species that cause the availability of adequate wintertime food to change geographically from year to year [5]. Many of these finches are capable of surviving the winter months in or near their typical breeding grounds when sufficient food remains available year-round. In winters when seed and fruit crop failures occur throughout the northern latitudes, entire populations can move south and irrupt into localities with sufficient food [6].
- METHODS
- RESULTS
- DISCUSSION
- CONCLUSION
- APPENDIX