- Home
- About Journals
-
Information for Authors/ReviewersEditorial Policies
Publication Fee
Publication Cycle - Process Flowchart
Online Manuscript Submission and Tracking System
Publishing Ethics and Rectitude
Authorship
Author Benefits
Reviewer Guidelines
Guest Editor Guidelines
Peer Review Workflow
Quick Track Option
Copyediting Services
Bentham Open Membership
Bentham Open Advisory Board
Archiving Policies
Fabricating and Stating False Information
Post Publication Discussions and Corrections
Editorial Management
Advertise With Us
Funding Agencies
Rate List
Kudos
General FAQs
Special Fee Waivers and Discounts
- Contact
- Help
- About Us
- Search


The Open Mathematics, Statistics and Probability Journal
The Open Statistics & Probability Journal
(Discontinued)
ISSN: 2666-1489 ― Volume 10, 2020
Comparing Measures of Association in 2×2 Probability Tables
Dirk Hasenclever1, *, Markus Scholz1, 2
Abstract
Measures of association play a role in selecting 2×2 tables exhibiting strong dependence in high-dimensional
binary data. Several measures are in use differing on specific tables and in their dependence on the margins.
We study a 2-dimensional group of margin transformations on the 3-dimensional manifold
 of all
2×2 probability tables. The margin transformations allow introducing natural coordinates that identify
with the real 3-space such that the x-axis corresponds to
of all
2×2 probability tables. The margin transformations allow introducing natural coordinates that identify
with the real 3-space such that the x-axis corresponds to
 and margins vary on
planes x =const. We use these coordinates to visualise and compare measures of association with respect
to their dependence on the margins given the odds-ratio, their limit behaviour when cells approach zero
and their weighting properties. We propose a novel measure of association in which tables with single
small entries are up-weighted but those with skewed margins are down-weighted according to the relative
entropy among the tables of the same odds-ratio.
and margins vary on
planes x =const. We use these coordinates to visualise and compare measures of association with respect
to their dependence on the margins given the odds-ratio, their limit behaviour when cells approach zero
and their weighting properties. We propose a novel measure of association in which tables with single
small entries are up-weighted but those with skewed margins are down-weighted according to the relative
entropy among the tables of the same odds-ratio.
Article Information

Identifiers and Pagination:
Year: 2016Volume: 7
First Page: 20
Last Page: 35
Publisher Id: TOSPJ-7-20
DOI: 10.2174/1876527001607010020
Article History:
Received Date: 23/03/2015Revision Received Date: 25/04/2016
Acceptance Date: 02/05/2016
Electronic publication date: 23/08/2016
Collection year: 2016
open-access license: This is an open access article licensed under the terms of the Creative Commons Attribution-Non-Commercial 4.0 International Public License (CC BY-NC 4.0) (https://creativecommons.org/licenses/by-nc/4.0/legalcode), which permits unrestricted, non-commercial use, distribution and reproduction in any medium, provided the work is properly cited.
* Address correspondence to this author at the Institute for Medical Informatics, Statistics and Epidemiology, University of Leipzig, Haertelstrasse 16-18 04107, Leipzig, Germany; Tel: +49 341 97 16121; Fax: +49 341 97 16109; E-mail: dirk.hasenclever@imise.uni-leipzig.de
| Open Peer Review Details | |||
|---|---|---|---|
| Manuscript submitted on 23-03-2015 |
Original Manuscript | Comparing Measures of Association in 2×2 Probability Tables | |
INTRODUCTION
2×2 tables of binary markers with random margins are intriguing in several respects: First, there is a confusing plethora of measures of association in 2×2 tables with random margins that are used in statistical practice. Their relative merit is unclear. Some of them were developed for 2×2 tables with fixed margins and then extended to the case considered here. Measures typically agree in the ordering by strength of association on 2×2 tables that have diagonal symmetry and in case of independence. But they differ markedly in asymmetric tables or in tables which are ”far from independence”. We develop a unified framework to analyse, visualise and compare measures of association in 2×2 probability tables especially with respect to their dependence on the margins.
Second, 2×2 tables ”far from independence” may approximate logical forms like logical equivalence (one diagonal is zero) or implication (one entry zero). The task of selecting particularly interesting and informative tables among a large number of tables is often encountered in the analysis of data consisting of high dimensional binary patterns (e.g. linkage disequilibrium of SNPs, patterns of aberration at various DNA loci, patterns of protein expression etc.). We suggest a principled approach for picking tables which approximate logical relations. This approach relies on an entropy-based weighting of tables and aims to improve existing measures often used in Genetical Statistics.
Defining and justifying measures and estimating them from empirical data are radically different tasks. We have investigated methods of estimating measures of association in a separate paper [1M Scholz, and D Hasenclever, "Comparison of estimators for measures of linkage disequilibrium", The International Journal of Biostatistics, vol. 6, no. 1, 2010. Article 1.
[http://dx.doi.org/10.2202/1557-4679.1162] ]. Here we deal exclusively with abstract 2×2 probability models and their mathematical structure.
RESULTS
Mathematical Structure of 2×2 Probability Models
2×2 tables of binary markers with random margins can be considered as tetranomial distributions with a symmetry structure. Symmetry of 2×2 tables can be described by the dihedral group D4 generated by the transposition of the binary markers (matrix transposition) and transposition of their values (transposition of columns or rows).
We consider the manifold
of all non-degenerate tetranominal probability models which we write in two by two lay-out:
consists of all two by two matrices t with entries pij

 , (i, j
{0, 1}) subject to the constraints pij > 0, Σi,jpij = 1. The pij denote the probabilities of the corresponding combination of the states of two binary markers i and j. In the following, we abbreviate Σ1i = 0 Σ1j = 0 = Σi,j , pi. = pio + pi1 and p.j = poj + p1j . The margins pi. and p.j give the marginal distributions of the marker i and j respectively.
, (i, j
{0, 1}) subject to the constraints pij > 0, Σi,jpij = 1. The pij denote the probabilities of the corresponding combination of the states of two binary markers i and j. In the following, we abbreviate Σ1i = 0 Σ1j = 0 = Σi,j , pi. = pio + pi1 and p.j = poj + p1j . The margins pi. and p.j give the marginal distributions of the marker i and j respectively.
In
we have several relevant submanifolds. There is a marked point m0 , namely the midpoint
 . There is the 1-dimensional submanifold
 of all tables with diagonal symmetry of the form
 . And there is the 2-dimensional submanifold
 of independent tables with pij = pi. • p.j
 i, j.
i, j.
By
 we denote the closure of
. The border ∂
=
‒
consists of tables with at least one zero: four two dimensional sides {pij = 0} for any i, j, six one dimensional edges of vanishing rows {p.j = 0}, vanishing columns {pi = 0} and two vanishing diagonals {p00 = p11 = 0}, {p01 = p10 = 0} as well as four triple zero vertices {pij = 1}.
we denote the closure of
. The border ∂
=
‒
consists of tables with at least one zero: four two dimensional sides {pij = 0} for any i, j, six one dimensional edges of vanishing rows {p.j = 0}, vanishing columns {pi = 0} and two vanishing diagonals {p00 = p11 = 0}, {p01 = p10 = 0} as well as four triple zero vertices {pij = 1}.
Manipulating the margins defines an additional structure on
. We can multiply rows or columns with positive numbers and renormalise: Formally, consider the group G = (
+ ×
+, •) with component-wise multiplication.
For every (µ, ν)
+ ×
+ we define a map: g(µ, ν) :
→
 |
(1) |
Since g(µ, ν) ◦ g(µ', ν') = g(µ · µ', ν · ν') and g(1, 1) = Id
this defines a G-group action on
.
Lying in the same group orbit defines an equivalence relation on
: We say two elements t1, t2
are equivalentt1 ~ t2 if and only if there are (µ, ν)
+ ×
+ with g(µ, ν)(t1) = t2. G-Orbits are diffeomorph to
+ ×
+.
A real function η :
→
is G-invariant if η(t) = η(g(µ, ν)(t)) for all (µ, ν)
+ ×
+.
Proposition 1 (odds-ratio):
a) The odds-ratio
 is G-invariant.
b) The odds-ratio classifies the G-orbits. Let
 be the quotient space of
by the equivalence relation induced by G. λ induces a bijective map λ̃ :
→
+.
be the quotient space of
by the equivalence relation induced by G. λ induces a bijective map λ̃ :
→
+.
c) The inverse mapping λ̃-1 :
+ →
can be described by

d) Every G-invariant function η :
→
can be written as a function of λ, namely η = (η̃ ◦ λ̃-1) ◦ λ.
Proof: a) is easily verified. b) Every equivalence class [t] in
has a representant with margins ½ , namely
 which has the form given in c). d) is trivial.
We next define new coordinates on
to make use of this insight.
Proposition 2 (Margin transformation coordinates on T highlighting the G-action and its invariant):
The map Θ :
→
3
 |
(2) |
is a diffeomorphism.
The inverse Ψ = Θ‒1 :
3 →
is given by
 |
In these new coordinates, x corresponds to the logarithmized odds-ratio [2A.W. Edwards, "The measure of association in a 2x2 table", Journal of the Royal Statistical Society [Series A], vol. 126, pp. 108-114, 1963.
[http://dx.doi.org/10.2307/2982448] ], while y and z determine the G-transformation that maps the table to diagonal symmetry. In addition, the midpoint m0 corresponds to the origin (0, 0, 0). G-orbits (odds-ratio = constant) correspond to planes {a} ×
2. In particular, the submanifold of independent tables
maps to {0} ×
2. The tables with diagonal symmetry
form the line R×{0}×{0}. Transposing rows and columns of a table is equivalent to transformations y → ‒y and z → ‒z, while matrix transposition is equivalent to the transformation y ↔ z.
Let
 :=
:=
 {‒∞, +∞} be the two point compactification of
.
{‒∞, +∞} be the two point compactification of
.
 is a compactification of
3 as a cube. We use a short hand notation to describe the boundaries abbreviating +∞ as ”+”, ‒∞ as ”‒” and any finite real number as ”*”. The eight vertices V = {(± ± ±)} split into two sets of four: Vg = {(+ + +), (+ ‒ ‒), (‒ + ‒), (‒ ‒ +)} and Vb = {(‒ ‒ ‒), (‒ + +), (+ ‒ +), (+ + ‒)}.
is a compactification of
3 as a cube. We use a short hand notation to describe the boundaries abbreviating +∞ as ”+”, ‒∞ as ”‒” and any finite real number as ”*”. The eight vertices V = {(± ± ±)} split into two sets of four: Vg = {(+ + +), (+ ‒ ‒), (‒ + ‒), (‒ ‒ +)} and Vb = {(‒ ‒ ‒), (‒ + +), (+ ‒ +), (+ + ‒)}.
Proposition 3 (Extension to the borders): Ψ and Θ considered as set valued functions can be extended to
respectively
. They remain inverse to each other. The mappings of the borders can be characterized as follows:
- The vertices Vg together with their respective adjacent edges map to the vertices in
.
- The faces of
correspond to the vertices Vb.
- The faces (± * *) of the cube map to the diagonal edges p00 = p11 = 0 and p01 = p10 = 0 in
.
- The faces (* ± *), (* * ±) correspond to tables with vanishing rows {p.j = 0} or vanishing columns {pi. = 0} in
respectively.
This behaviour is illustrated in Fig. (1 ). These different compactifications will later be used to characterise the limit behaviour of association measures. It will turn out that the limit behaviour can be easier described using the margin transformation coordinates.
Measures of Association
We will now investigate various measures of associations between two binary markers. First we define the objects of interest.
Definition (Measures of association): A measure of association between binary markers is a continuous function η :
→
with the following properties:
a) η is zero on independent tables.
b) η is a strictly increasing function of the odds-ratio when restricted to tables with fixed margins.
c) η respects the symmetry group D4, namely:
c1) η is symmetric in the markers, i.e. invariant to matrix transposition.
c2) η changes sign when states of a marker are transposed (row or column transposition).
d) The range of the function is restricted to (−1, 1).
The first two conditions are equivalent to basic properties proposed by Piatetsky-Shapiro [3G. Piatetsky-Shapiro, "Discovery, analysis and presentation of strong rules", In: G. Piatetsky-Shapiro, and W. Frawley, Eds., Knowledge Discovery in Databases., MIT Press: Cambridge, MA, 1991, pp. 229-248.]. Condition c) is added to acknowledge that associations between interchangeable markers are of interest here. Finally, condition d) is added to define a unique scale for all measures of association which is often referred as standardization.
 |
Fig. (1) Illustration of the maps θ and Ψ on the boundaries of and
: ”~” represents
positive numbers adding up to 1. |
Measures Based on the Odds-Ratio
The odds-ratio Odds-ratio λ:
 |
can be used to define measures of association. As λ is G-invariant, monotone transformations automatically fulfill condition b) of the definition.
Measures of association derived from the odds-ratio include Yule’s Q [4G.U. Yule, "On the association of attributes in statistics", Philosophical transactions of the Royal Society of London A, vol. 194, pp. 269-274, 1900.
[http://dx.doi.org/10.1098/rsta.1900.0019] ]:
 |
and Yule’s Y [4G.U. Yule, "On the association of attributes in statistics", Philosophical transactions of the Royal Society of London A, vol. 194, pp. 269-274, 1900.
[http://dx.doi.org/10.1098/rsta.1900.0019] ]:
 |
Obviously, both Q and Y are measures of association in our sense. Similar to the odds-ratio, both are extremal if one of the pij tends to zero.
Measures Based on Additive Deviations from Independence Given the Margins
Fixing margins results is a one dimensional submanifold of tables that can be additively parametrised by a parameter D.
All such tables have the form:
 |
D = p00p11 ‒ p01p10 = p00 ‒ p0 .p.0 describes the additive deviation from the independent table with the given margins. This measure is zero in case of independence of the markers but extremal values depend on the margins.
Lewontin’s D′ [5R.C. Lewontin, "The interaction of selection and linkage. I. general considerations; heterotic models", Genetics, vol. 49, no. 1, pp. 49-67, 1964.
[PMID: 17248194] ]: The measure D′ is a standardisation of the original measure D:
 |
Lewontin’s D′ ranges from −1 to 1 and tends to these values if at least one of the pij tends to zero.
D′ is widely used in genetics to measure linkage disequilibrium. When a new SNP emerges in a population by a single mutation event, the new allele is exclusively found in conjunction with only one of the two alleles of already existing SNPs. As long as no recombination events occurs, the new SNP remains in complete linkage disequilibrium with the other SNPs. The corresponding 2×2 tables feature a single zero cell. Thus in this context a measure is needed that is extremal whenever a single entry tends to zero.
Since Dmax is constant for tables with fixed margins and D increases with increasing odds-ratio, D′ is a monotone function of the odds-ratio for constant margins. Symmetry is obvious. Hence, D′ is a measure of association in our sense.
Correlation coefficient r [6W.G. Hill, and A. Robertson, "Linkage disequilibrium in finite populations", Theoretical and Applied Genetics, vol. 38, no. 6, pp. 226-231, 1968.
[http://dx.doi.org/10.1007/BF01245622] [PMID: 24442307] ]: The correlation coefficient applied to binary data has similar popularity in genetics as D′. It ranges also from −1 to 1, but, in contrast to D′, the absolute value 1 is obtained when a diagonal of t tends to zero:
 |
With reasoning similar as for D′, r is a measure of association.
Proposition 4 (Equality of r, D′ and Y on diagonal tables): The measures r, D′ and Y coincide on the set of diagonal tables, i.e. tables with pair-wise equal diagonal elements.
Proof: This follows directly after calculating these measures for the tables
 .
.
Measures Based on Information Theory
The mutual information [7W. Weaver, and C.E. Shannon, The Mathematical Theory of Communication., University of Illinois Press: Urbana, IL, 1963.] is defined as the difference between the information of the given table and the independent table with the same margins.
 |
MutInf takes values only in (0, 1). In order to make it a measure of association according to our definition, we define a signed version:
 |
Proposition 5: sMutInf is a measure of association.
Proof: The symmetry of this measure is clear. To show that sMutInf is a monotone function of the odds-ratio, we consider the tables
 for a sufficiently small ε > 0. These tables have the same margins as the table
 but higher odds-ratios. Assume that λ > 1, we see that
 sMutInf (tε ) = log2 λ > 0. Hence sMutInf is monotone, and thus, a measure of association.
MutInf approaches 1 only if tables approach
 ; while r approaches 1 if tables approach the form
 .
.
Counter Example
Kappa coefficient [8J. Cohen, "A coefficient of agreement for nominal scales", Educational and Psychological Measurement, vol. 20, pp. 37-46, 1960.
[http://dx.doi.org/10.1177/001316446002000104] ]: The Kappa coefficient which is useful in quantifying the agreement between two raters is defined as:
 |
Kappa is not a measure of association in our sense. Although it fulfils the condition of monotonicity, it is not symmetric.
Comparing Measures of Association
We use the coordinates introduced in Proposition 2 in order to describe and visualise how measures of association depend on the margins. In particular we study measures of association η restricted to x=const i.e. for fixed odds-ratios. The restricted functions will be denoted ηx and called margin weighting functions. We characterise the shape of the margin weighting functions and study their limiting behaviours and extensibility to the compactification
in comparison to
.
The association measure r expressed in margin transformation coordinates reads:
 |
(3) |
The margin weighting function of r for odds-ratio λ = 40 is shown in Fig. (2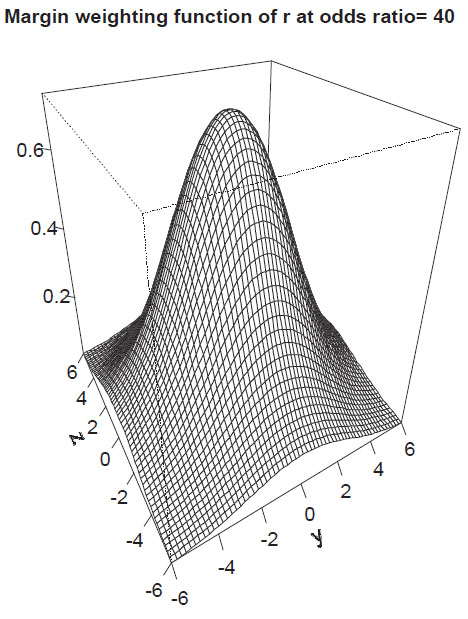 ).
).
 |
Fig. (2) Margin-weighting function of r. |
Proposition 6 (Margin weighting function for r): For all x
\ {0}:
a) rx has exactly one extremum at the origin (y, z) = (0, 0), corresponding to the diagonal symmetric table with the fixed odds-ratio.
b) lim‖(y,z)‖→∞rx = 0.
c) limx→±∞rx = ±1
d) r can be extended to
except for the lines (±,±, *) and (±, *,±) and the vertices V.
e) r can be extended to
except for the vertices.
Proof: see Supplement Material.
The measure r down-weights tables with skewed margins.
The association measure D' expressed in margin transformation coordinates reads:
 |
(4) |
The margin weighting function of D′ for odds-ratio λ = 40 is shown in Fig. (3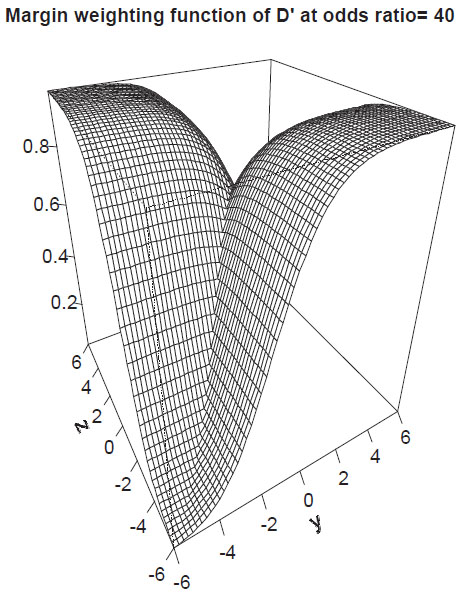 ).
).
 |
Fig. (3) Margin-weighting function of D′. |
Proposition 7 (Margin weighting function for D′): For all x
{0}:
a) Dx′ has a non-differentiable edge along the diagonal y = zfor D′ > 0 and along the diagonal y = −zfor D′ < 0. There is a non-smooth saddle point in the origin.
b)
 |
Thus, limit functions have a range of (0, 1 ‒ e‒2x) for x > 0 and (e2x ‒ 1, 0) for x < 0, where 0 is obtained for y → ±∞, z → ±∞, x > 0 and y →
 ∞, z → ±∞, x < 0.
c) limx→±∞Dx′ = ±1
d) D′ can be extended to
except for the vertices Vg.
e) D′ can be extended to
except for the edges and vertices.
Proof: see Supplement Material.
D′ gives higher weights to certain tables without diagonal symmetry. The measure up-weights or down-weights tables with skewed margins depending on the position of zeros which occur in the limiting tables (see Fig. 3). Comparing d) and e) one recognizes that the introduction of the odds-ratio as coordinate allows extending D′ to limit tables with vanishing colums or rows.
The association measure sMutInf can also be written in margin transformation coordinates but this is skipped due to the lengthy formula. The margin weighting function of sMutInf for odds-ratio λ = 40 is shown in Fig. (4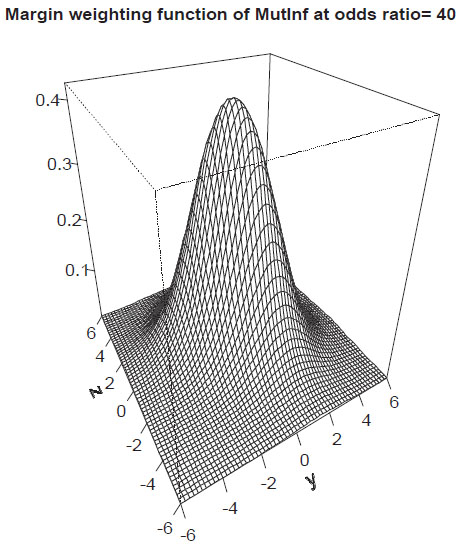 ).
).
 |
Fig. (4) Margin-weighting function of sMutInf. |
Proposition 8 (Margin weighting function for sMutInf): For all x
\ {0}:
a) sMutInfxhas exactly one maximum at the origin (y, z) = (0, 0).
b) lim‖(y,z)‖→∞ sMutInfx = 0.
c) limx→±∞ sMutInfx =

Thus sMutInfx → ±1 for y =
zand x→ ±∞ respectively.
d) sMutInf can be extended to
except for the vertices Vb.
e) sMutInf can be extended completely to
.
Proof: see Supplement Material.
Thus, similarly to r, sMutInf down-weights tables with skewed margins (see Fig. 4).
The association measure Y in margin transformation coordinates can be simply written as:
 |
(5) |
Proposition 9 (Margin weighting function for Y ): For all x
:
a) Yx is constant.
b) lim‖(y,z)‖→∞Yx = tanh

c) limx→±∞Yx = ±1
d) Y can be extended completely to
.
e) Y can be extended to
except for edges and vertices corresponding to vanishing rows or columns.
Proof: is trivial.
Entropy
Among tables of a fixed odds-ratio, we look for a principled approach to prefer interesting tables and down-weight obscure ”junk” tables. As a candidate we study the table entropy on
. The entropy function H :
→
is defined as the negative expectation of the loglikelihood of the tables:
 |
Why is entropy a candidate to select among tables? It can be characterised in multiple ways: For general finite discrete distributions the entropy was introduced by Shannon (1948) [9CE Shannon, "A mathematical theory of communication", Bell System Technical Journal, vol. 27, pp. 379-423, 1948. 623-656]. Shannon characterised H by a set of postulates to measure the uncertainty in a discrete distribution:
Shannon’s Characterisation of Entropy: If functions Hn(p1, ..., pn) with pi ≥ 0, ∑pi = 1, n ≥ 2 satisfy the conditions
a) H2(p, 1 − p) is a continuous positive function of p.
b) Hn(p1, ..., pn) is symmetric, i.e. invariant under permutations of the p1, ..., pn for all n.
c) Hn(p1, ..., pn) = Hn‒ 1 (p1 + p2, p3, ..., pn) + (p1 + p2)·

then Hn(p1, ..., pn) = ‒ K ·Σ pi log2 (pi) for some K > 0.
Tables with high entropy are interesting as they have high uncertainty and ”surprise value”.
Jaynes [10E.T. Jaynes, Probability Theory: The Logic of Science., Cambridge University Press: Cambridge, 2003.
[http://dx.doi.org/10.1017/CBO9780511790423] ] gives an independent combinatorial characterisation: When we sample sequentially from a table t
we obtain a vector of observations of length N , which we summarise as a frequency table
 . Each frequency table
 is characterised by the number
 of sequences which realise
. Intuitively, tables that can be realised in multiple ways are more plausible than those that can be realised only by few sequences. We can use Stirlings formula for n! to approximate W (
). In the limit N → ∞,
→ t in probability and 1/N · log(W(tN)) → H(t). Thus the entropy describes the combinatorial plausibility of a table.
of sequences which realise
. Intuitively, tables that can be realised in multiple ways are more plausible than those that can be realised only by few sequences. We can use Stirlings formula for n! to approximate W (
). In the limit N → ∞,
→ t in probability and 1/N · log(W(tN)) → H(t). Thus the entropy describes the combinatorial plausibility of a table.
Given a set of distributions fulfilling certain constraints, Jaynes [10E.T. Jaynes, Probability Theory: The Logic of Science., Cambridge University Press: Cambridge, 2003.
[http://dx.doi.org/10.1017/CBO9780511790423] ] proposes to pick the corresponding maximum entropy distribution as the most uncommitted and prototypical distribution. Looking at the margin weighting function of the entropy leads to a surprise (see Fig. 5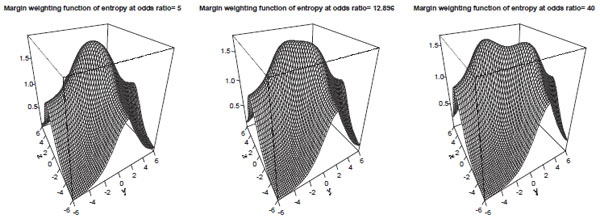 ):
):
Recall that Lambert’s W-function is defined as the inverse function to x exp x. W is a multi-branch function since y = x exp(x) has two solutions for y
(−1/e, 0). We can prove the following:

Theorem 1 (magic odds-ratio): Define the ”magic odds-ratio” by Lmagic = W (1/e)−2 ≈ 12.89. Let L > 1. The entropy H restricted to the submanifold of constant odds-ratio L in
- has a single maximum at the diagonal table of odds-ratio L if 1 < L ≤ Lmagic.
- has a saddle point at the diagonal table of odds-ratio L and two ”L-shaped” tables as maxima which transpose with matrix transposition if Lmagic < L.
”L-shaped” means that for L → ∞ one of the maxima approaches the table
 . For the case L < 1 a similar result can be derived by transposing principal and secondary diagonals.
Proof: There are two constraints to be considered, one of them not linear in pij :
 |
(6) |
 |
(7) |
Using Langrange multipliers, critical tables of H restricted to odds-ratio equals L can be expressed in terms of Lambert’s W function. The bifurcation occurs for Lmagic < L because Lambert’s W is multibranched. See supplement material for details.
This theorem suggests that the ”magic odds-ratio” is a natural cutpoint between weak and strong association. For weak association L < Lmagic, interesting tables are those near
. For strong association Lmagic < L, particularly interesting tables are those that approach ”L-shape”, i.e. those in which one cell differs in magnitude from the three others.
An Entropy-Based Measure of Association
Using these insights on the entropy of a table, in this section we aim to define a measure of association with similar properties to D′, Y but better limit behaviour, i.e. the measure should down-weight tables with almost vanishing rows or columns or single entries. These tables are denoted as junk tables in the following. We have seen in the last sections that D′ and Y could be large for these tables.
We also like to recall that both, D′ and Y become extremal if the table features a single entry equals zero while r, sMutInf require a vanishing diagonal. We like to retain this property for a new measure to be defined. Another feature to be retained is the agreement of measures for diagonal tables which holds for Y , D′ and r.
According to our definition, an important property of a measure of association is that it is a monotone function of the odds-ratio when the margins are kept fixed. For the entropy, one can prove the following lemma:
Lemma 1 (Monotony of the entropy difference): Let H be the entropy of t and Hdiag be the entropy of the corresponding diagonal table of the same odds-ratio λ. Then, Hdiag − H is monotonically decreasing for increasing λ > 1 and constant margins.
Proof: see supplement material.
As a direct consequence of this lemma, it is easy to see that:
Corollary:
 |
(8) |
is a measure of association for arbitrary n ≥ 0.
This newly defined measure fulfils all above mentioned properties: It coincides with Y , D′, r at diagonal tables, is extremal for tables with a single zero, up-weights L-shaped tables for large odds-ratios in the sense that HSn > Y and down-weights junk-tables in the sense that HSn < Y at the margins (proof see below). However, the down-weighting is imperfect as HSn > 0 for junk-tables.
The parameter n can be chosen in order to define the degree of up- and down-weighting. According to our observations, n = 4 is a reasonable choice resulting in a satisfactory down-weighting of junk tables (see later).
The measure HSn can be written in margin transformation coordinates using
 |
At Fig. (6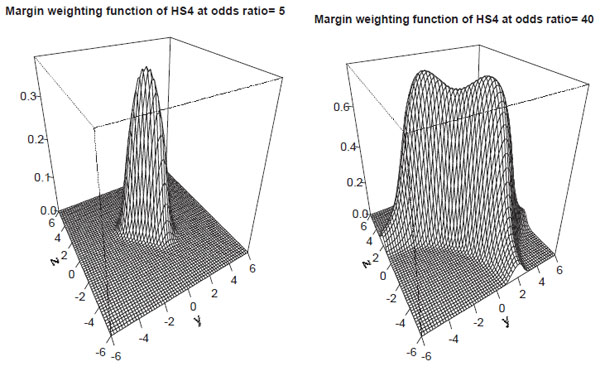 ) we present the margin weighting functions of HSn for λ = 5 and λ = 40. These functions can be easily characterised using the results of the previous section:
Proposition 10 (Margin weighting function for HSn): For all x
\ {0}:
a) For x
(−1 − W(1/e) , 1 +W (1/e)), HSnxhas exactly one maximum at the origin (y, z) = (0, 0). If x < −1 − W (1/e) or x > 1 + W (1/e), HSnx has a saddle-point at the origin and two extrema elsewhere. At these extrema, the elements of one diagonal are equal while at the other diagonal there is one (small) element.
b) HSnx has the following limit functions
 |
where p = (1 + ex±z )−1 for y → ±∞ or p = (1 + ex±y)−1 for z → ±∞ respectively. Thus, the limit functions have an extremum at p = 0.5 that is z =
x for y → ±∞ and y =
x for z → ±∞ respectively.
c) limx→±∞ HSnx = ±1
d) HSnx < Yx at the margins, i.e. HSn down-weights junk-tables.
e) HSn can be extended completely to
.
f) HSn can be extended to
except for edges and vertices corresponding to vanishing rows or columns.
g) For all x
, HSn coincides with Y , D′, r at diagonal tables.
Proof: a) follows from Theorem 1. b) is easy to see taking the limit of the tables first. c) is clear since limx→±∞ tanh x/2 = ±1 and the exponent is finite. d) holds since Hdiag > 1 and H ≤ 1 at the margins of finite x. e) and f) are consequences of b) and c). g) is obvious.
 |
Fig. (6) Margin-weighting function of HS4. |
Examples of Tables and Corresponding Association Measures
We now study the behaviour of the measures Y , r, D′ and the newly proposed measure HS4 for a variety of selected tables (see Table 1). For this purpose, we study the odds-ratios λ
{1, 2, 5, 10, 20, 50, 100} and consider the following tables for x = ln

- The diagonal table (y = z = 0).
- An L-shaped table, characterized by y = x, z = ‒x.
- A junk table with y = 10, z = −y corresponding to p01 ≈ 1.
- A junk table with y = 10, z = −x corresponding to p00 ≈ p01 ≈ 0.5.
- A junk table with y = 10, z = y corresponding to p00 ≈ 1.
We also like to remark that the table with three equal entries has maximum entropy if λ → ∞.
Per definition of a measure, for λ = 1 all measures equals zero independent of the concrete realization of the table. Since Y is based on the odds-ratio, Y is constant for all tables of the same odds-ratio. Y , r, D′ and HS4 always coincide at diagonal tables. r is maximal at diagonal tables and becomes small for all kinds of junk tables. D′ is always greater for L-shaped tables than for diagonal tables. D′ is close to zero in case of p00 ≈ 1 but could become large for p01 ≈ 1 which is highly counter-intuitive. HS4 also becomes larger for L-shaped tables compared to diagonal tables if λ is large. In contrast to D′, HS4 is close to zero for both junk configurations p00 ≈ 1 and p01 ≈ 1 respectively. The limit tables have a maximum of the entropy at p00 = p01 = 0.5. This induces a maximum of HS4 for limit tables which increases with λ (see Table 1, fourth rows of each odds-ratio).

(Measures of association for selected tables): All values are rounded to three decimals. To allow discrimination between hard zeros and small values, all values within (0, 0.0005) are presented as ”< 0.001”. Entries of 2x2 tables are presented in columns 1 to 4. The fifth columns presents the odds-ratio of the tables. For each odds-ratio, we studied five tables: the diagonal table (first row of the corresponding odds-ratio), a table with three equal entries (second row), a table for which it holds that p01 ≈ 1 or p00 ≈ 1 (third and fifth row respectively) and a table for which p00 ≈ p01 ≈ 0.5 (fourth row). The last four columns contain the corresponding measures of association rounded to three decimals.
DISCUSSION
In this paper we studied measures of association of 2×2 contingency tables. We defined our measures of interest by four conditions: The first two of them (zero in case of independence, monotonicity with odds-ratio in case of fixed margins) are basic properties according to Piatetsky-Shapiro [3G. Piatetsky-Shapiro, "Discovery, analysis and presentation of strong rules", In: G. Piatetsky-Shapiro, and W. Frawley, Eds., Knowledge Discovery in Databases., MIT Press: Cambridge, MA, 1991, pp. 229-248.]. There is an ongoing debate regarding desired properties of association measures [11MJ Warrens, "On association coefficients for 2x2 tables and properties that do not depend on the marginal distributions", Psychometrika, vol. 73, no. 4, pp. 777-789, 2008.]. Here, we additionally postulate a standardization and symmetry under matrix transposition, i.e. interchangeability of markers to be associated. In contrast to traditional independence analysis, we asked for the selection of tables which are far away from independence. This objective was motivated by the analysis of high-dimensional molecular genetic data such as SNP array data in which a high number of 2×2 tables occur from which one would like to select cases of high dependence called linkage disequilibrium.
In contrast to detecting a (moderate) deviation from independence, quantifying the strength of association is multiform as pointed out for example by Tan et al. [12P.N. Tan, V. Kumar, and J. Srivastava, "Selecting the right objective measure for association analysis", Information Systems, vol. 29, pp. 293-313, 2004.
[http://dx.doi.org/10.1016/S0306-4379(03)00072-3] ]. A large number of possible measures were proposed in the literature. Those fulfilling our conditions are shortly reviewed. Most of these measures (r, D′, Y ) agree at diagonal tables. Some of them become extremal for a vanishing diagonal (r, sMutInf) while for others it suffices that a single cell becomes zero (D′, odds-ratio based measures). The measures also markedly differ in cases were one of the rows or columns of the table becomes small. Since in practice, it can hardly be decided for these tables whether the dependence is strong or not, these tables are not really of interest and are considered as junk tables here. Nevertheless, the measure D′ can become large in these cases which is undesirable to our opinion. D′ also varies markedly in a small neighbourhood of the vertices of
.
To study the properties of measures of association, we introduced coordinates on the manifold
of all tables mapping it to 3-dimensional space such that the x-axis corresponds to the logarithmized square root of the odds-ratio. We study the measures on the hyperplanes of constant odds-ratio, looking at the so called margin weighting functions. These functions are constant for all measures based on the odds-ratio which is known to be independent of the margins of the table. For other measures, these functions describe the dependence of the measure on the margins for tables with constant odds-ratio. Hence, our construction acknowledges the fact that the odds-ratio completely captures the information of the joint distribution of the two markers except for those contained in the margins [13G Osius, "The association between two random elements: A complete characterization and odds ratio models", Metrika, vol. 60, pp. 261-277, 2004.
[http://dx.doi.org/10.1007/s001840300309] ]. Our margin weighting functions illustrate major properties of the association measures considered. It also helps designing new measures with desired properties, which we demonstrated in the second part of the paper.
The mathematical properties of the margin weighting functions were derived for three measures of association, namely r, sMutInf and D′. It revealed that r and sMutInf behave very similarly by up-weighting diagonal tables but down-weighting tables with small rows or columns. In contrast, D′ is not maximal for diagonal tables. Furthermore, it expresses a strange weighting behaviour for tables with small rows and columns, up-weighting or down-weighting these tables in dependence on the position of the structural zeros. Such tables occur frequently e.g. in SNP data. This property also explains, why the estimation problem for D′ is not well behaved [1M Scholz, and D Hasenclever, "Comparison of estimators for measures of linkage disequilibrium", The International Journal of Biostatistics, vol. 6, no. 1, 2010. Article 1.
[http://dx.doi.org/10.2202/1557-4679.1162] ]. On the other hand, D′ as well as odds-ratio based measures are constructed to up-weight tables which feature a single small entry. These tables represent a prototype of a logical table for which one can conclude the state of the column for one row but not for the other row. These kinds of tables are interesting in genetical statistics since they correspond to situations at which no recombinations occurred between two SNPs, i.e. only three of the four theoretically possible haplotypes are observed. Therefore, we aimed to define an alternative measure also highlighting L-shaped tables but with a better behaviour at the margins than D′ or odds-ratio based measures.
For this purpose, the entropy [9CE Shannon, "A mathematical theory of communication", Bell System Technical Journal, vol. 27, pp. 379-423, 1948. 623-656] as another canonical structure at 2×2 tables was studied. We proved that the margin weighting function of this quantity is maximal at the diagonal for odds-ratios within a critical range, namely (W (1/e)2, W (1/e)‒2). Outside this range, there are two maxima at L-shaped tables, i.e. tables with a single small cell while the others are (almost) equal. More precisely, the elements of the opposite diagonal are equal for the maxima.
The difference between the entropy of a non-diagonal table and the corresponding diagonal table of the same odds-ratio is a monotone function of the odds-ratio for fixed margins. A new measure of association called HSn is defined, which is essentially Yule's Y weighted by the exponential of this entropy difference. This quantity fulfils all requirements of an association measure, i.e. ranges between -1 and 1, is zero in case of independence, is symmetric and a monotone function of the odds-ratio for fixed margins. In addition, it agrees with Y , D′ and r at diagonal tables, up-weights tables with an L-shape and large odds-ratio and is extremal in case of a single zero in the table. Hence, the measure has similar properties than D′ except for a better limit behaviour. Since the entropy difference of tables with vanishing row or column is smaller than the entropy of the corresponding diagonal table, degenerated tables are markedly down-weighted relative to the diagonal table. The free constant n allows tuning the degree of this down-weighting. For practical issues we recommend using n = 4 which yields satisfactory results to our experiences. However, our procedure of down-weighting junk tables is neither unique nor perfect in the sense that the junk tables are down-weighted to zero. The latter one is not possible within the framework of weighting by entropy without loosing other desired properties of the measure, because the minimum of the absolute differences between the diagonal table and the degenerated tables of the same odds-ratio approaches zero if the odds-ratio tends to 0 or ∞.
We recommend using HS4 instead of D′ when interested in selecting L-shaped tables from a large set of tables mostly far away from independence and when tables with small marginal frequencies are common. When HS4 is estimated from count data, we recommend using Bayesian plug-in estimators of the frequencies of single cells showing a good compromise between accuracy and computational burden [1M Scholz, and D Hasenclever, "Comparison of estimators for measures of linkage disequilibrium", The International Journal of Biostatistics, vol. 6, no. 1, 2010. Article 1.
[http://dx.doi.org/10.2202/1557-4679.1162] ].
SUPPLEMENTARY MATERIAL
Supplementary material is available on the publishers Website along with the published article.
CONFLICT OF INTEREST
The author confirms that this article content has no conflict of interest.
ACKNOWLEDGEMENTS
This research was funded by the Leipzig Interdisciplinary Research Cluster of Genetic Factors, Clinical Phenotypes, and Environment (LIFE Center, University of Leipzig). LIFE is funded by means of the European Union, by the European Regional Development Fund (ERDF), the European Social Fund (ESF), and by means of the Free State of Saxony within the framework of its excellence initiative.
REFERENCES
| [1] | M Scholz, and D Hasenclever, "Comparison of estimators for measures of linkage disequilibrium", The International Journal of Biostatistics, vol. 6, no. 1, 2010. Article 1. [http://dx.doi.org/10.2202/1557-4679.1162] |
| [2] | A.W. Edwards, "The measure of association in a 2x2 table", Journal of the Royal Statistical Society [Series A], vol. 126, pp. 108-114, 1963. [http://dx.doi.org/10.2307/2982448] |
| [3] | G. Piatetsky-Shapiro, "Discovery, analysis and presentation of strong rules", In: G. Piatetsky-Shapiro, and W. Frawley, Eds., Knowledge Discovery in Databases., MIT Press: Cambridge, MA, 1991, pp. 229-248. |
| [4] | G.U. Yule, "On the association of attributes in statistics", Philosophical transactions of the Royal Society of London A, vol. 194, pp. 269-274, 1900. [http://dx.doi.org/10.1098/rsta.1900.0019] |
| [5] | R.C. Lewontin, "The interaction of selection and linkage. I. general considerations; heterotic models", Genetics, vol. 49, no. 1, pp. 49-67, 1964. [PMID: 17248194] |
| [6] | W.G. Hill, and A. Robertson, "Linkage disequilibrium in finite populations", Theoretical and Applied Genetics, vol. 38, no. 6, pp. 226-231, 1968. [http://dx.doi.org/10.1007/BF01245622] [PMID: 24442307] |
| [7] | W. Weaver, and C.E. Shannon, The Mathematical Theory of Communication., University of Illinois Press: Urbana, IL, 1963. |
| [8] | J. Cohen, "A coefficient of agreement for nominal scales", Educational and Psychological Measurement, vol. 20, pp. 37-46, 1960. [http://dx.doi.org/10.1177/001316446002000104] |
| [9] | CE Shannon, "A mathematical theory of communication", Bell System Technical Journal, vol. 27, pp. 379-423, 1948. 623-656 |
| [10] | E.T. Jaynes, Probability Theory: The Logic of Science., Cambridge University Press: Cambridge, 2003. [http://dx.doi.org/10.1017/CBO9780511790423] |
| [11] | MJ Warrens, "On association coefficients for 2x2 tables and properties that do not depend on the marginal distributions", Psychometrika, vol. 73, no. 4, pp. 777-789, 2008. |
| [12] | P.N. Tan, V. Kumar, and J. Srivastava, "Selecting the right objective measure for association analysis", Information Systems, vol. 29, pp. 293-313, 2004. [http://dx.doi.org/10.1016/S0306-4379(03)00072-3] |
| [13] | G Osius, "The association between two random elements: A complete characterization and odds ratio models", Metrika, vol. 60, pp. 261-277, 2004. [http://dx.doi.org/10.1007/s001840300309] |