- Home
- About Journals
-
Information for Authors/ReviewersEditorial Policies
Publication Fee
Publication Cycle - Process Flowchart
Online Manuscript Submission and Tracking System
Publishing Ethics and Rectitude
Authorship
Author Benefits
Reviewer Guidelines
Guest Editor Guidelines
Peer Review Workflow
Quick Track Option
Copyediting Services
Bentham Open Membership
Bentham Open Advisory Board
Archiving Policies
Fabricating and Stating False Information
Post Publication Discussions and Corrections
Editorial Management
Advertise With Us
Funding Agencies
Rate List
Kudos
General FAQs
Special Fee Waivers and Discounts
- Contact
- Help
- About Us
- Search


The Open Medical Informatics Journal
(Discontinued)
ISSN: 1874-4311 ― Volume 13, 2019
Model-Based Prediction of the Patient-Specific Response to Adrenaline
J. Geoffrey Chase1, Christina Starfinger1, Christopher E Hann*, 1, James A Revie1, Dave Stevenson1, Geoffrey M Shaw2, Thomas Desaive3
Abstract
A model for the cardiovascular and circulatory systems has previously been validated in simulated cardiac and circulatory disease states. It has also been shown to accurately capture the main hemodynamic trends in porcine models of pulmonary embolism and PEEP (positive end-expiratory pressure) titrations at different volemic levels. In this research, the existing model and parameter identification process are used to study the effect of different adrenaline doses in healthy and critically ill patient populations, and to develop a means of predicting the hemodynamic response to adrenaline. The hemodynamic effects on arterial blood pressures and stroke volume (cardiac index) are simulated in the model and adrenaline-specific parameters are identified. The dose dependent changes in these parameters are then related to adrenaline dose using data from studies published in the literature. These relationships are then used to predict the future, patient-specific response to a change in dose or over time periods from 1-12 hours. The results are compared to data from 3 published adrenaline dosing studies comprising a total of 37 data sets. Absolute percentage errors for the identified model are within 10% when re-simulated and compared to clinical data for all cases. All identified parameter trends match clinically expected changes. Absolute percentage errors for the predicted hemodynamic responses (N=15) are also within 10% when re-simulated and compared to clinical data. Clinically accurate prediction of the effect of inotropic circulatory support drugs, such as adrenaline, offers significant potential for this type of model-based application. Overall, this work represents a further clinical, proof of concept, of the underlying fundamental mathematical model, methods and approach, as well as providing a template for using the model in clinical titration of adrenaline in a decision support role in critical care. They are thus a further justification in support of upcoming human clinical trials to validate this model.
Article Information
Identifiers and Pagination:
Year: 2010Volume: 4
First Page: 149
Last Page: 163
Publisher Id: TOMINFOJ-4-149
DOI: 10.2174/1874431101004010149
Article History:
Received Date: 18/09/2009Revision Received Date: 02/02/2010
Acceptance Date: 03/05/2010
Electronic publication date: 29/07/2010
Collection year: 2010
open-access license: This is an open access article licensed under the terms of the Creative Commons Attribution Non-Commercial License (http://creativecommons.org/licenses/by-nc/3.0/) which permits unrestricted, non-commercial use, distribution and reproduction in any medium, provided the work is properly cited.
* Address correspondence to this author at the University of Canterbury, Private Bag 4800, Christchurch, New Zealand; Tel: 64 3 3642987, Ext. 7348; E-mail: chris.hann@canterbury.ac.nz
| Open Peer Review Details | |||
|---|---|---|---|
| Manuscript submitted on 18-09-2009 |
Original Manuscript | Model-Based Prediction of the Patient-Specific Response to Adrenaline | |
1. INTRODUCTION
Drugs for supporting the cardiovascular system are selected to either improve heart rate (chronotropic effects), myocardial contractility (inotropic effects), arterial blood pressure (vasoconstrictive effects), a reduction in afterload (vasodilator effects), or a multiple combination of these effects. Many of these drugs also increase electrical conduction (dromotropy) within the heart and augment relaxation (lusitropy). However, most of these drugs are non selective and may also increase or decrease heart rate and afterload. These added changes carry the potential risk of causing cardiac arrhythmias and increasing myocardial ischemia by creating a mismatch between myocardial oxygen demand and supply [1American heart association guidelines for cardiopulmonary resuscitation and emergencycardiovascular care, part 7.4: Monitoring and medications Circulation 2005; 112: IV78-83.]. Additionally, some agents also have metabolic effects that increase blood glucose, lactate and metabolic rate, and these effects should also be taken into account when prescribing such drugs.
1.1. Drugs in Heart Failure and Cardiogenic Shock
The main problem in heart failure and hypotension (as caused by an acute heart failure) is a loss of cardiac contractile function with a subsequently reduced organ perfusion and hypotension. Drugs used in this case aim to improve cardiac output, as it will lead to improved organ perfusion and normalization of arterial blood pressure. Cardiac function and output can be improved by reducing afterload. Similarly, cardiac function and output can also be improved by increasing preload by increasing fluid volume (for example in hypovolemic and circulatory shock), and enhancing contractility of the heart.
1.2. Drugs in Circulatory Shock
This form of hypotensive shock is usually caused by an inadequate blood volume as might be caused by hemorrhage. It can also be due to a loss of vascular tone caused by infection and inflammation, as in septic shock for example. The main goal in this case is to improve arterial blood pressure and vasoconstrictor drugs are thus typically administered, often in the combination with fluid administration.
1.3. Drug Dosing and Infusion Rates
Specific drug infusion rates are typically not recommended in critically ill patients, mostly due to inter-patient variations in pharmacokinetics (drug dose - concentration relation) and pharmacodynamics (drug concentration - effect relation) [2Zaritsky AL. The Pharmacologic Approach to the Critically Ill Patient, chapter Cat-25 echolamines, inotropic medications, and vasopressor agents. Baltimore: Williams & Wilkins 1994; pp. 387-404., 3Kellum JA, Pinsky MR. Use of vasopressor agents in critically ill patients Curr Opin Crit Care 2002; 8(3): 236-41.]. Such drugs are thus dosed based on an initial dose within a known therapeutic range. This dose is then varied (titrated) at the bedside to achieve the desired effect on cardiac function, while limiting side effects.
There are a number of broad guidelines available for the appropriate use of these drug therapies in critical care. However, sometimes it is not possible to implement these algorithms because of patient-specific conditions, resident learning curves, and individual physician medication preferences [4Bobek MB, Hoffman-Hogg L, Blair N, Slomka J, Mion LC, and Arroliga AC. Utilization patterns, relative costs, and length of stay following adaptation of micu sedation guidelines Formulary 2001; 36(9): 664-73.]. Hence, dosing regimes depend mainly on the intuition and experience of the clinical staff and it cannot necessarily be guaranteed that the optimal dose for each individual patient is chosen or maintained as patient condition evolves.
Therefore, a clinically validated computerized cardiovascular system (CVS) model that provides accurate and patient-specific simulations of the cardiovascular and circulatory system in response to various doses would offer the opportunity for effective use in monitoring and decision support roles. A patient-specific model can be used to forward simulate the likely response towards a change in dose by modifying parameters specific to that drug’s physiological affect using either patient-specific data from prior changes or generic population estimates from clinical studies. More specifically, noting the response to initial doses, a patient-specific drug sensitivity could be determined to further optimize dosing. Overall, model-based estimation of drug effect and its patient sensitivity to enable dose optimization would create unique clinical opportunity and advantages.
1.4. Adrenaline (Epinephrine)
Adrenaline (European Pharmacopoeia and BAN) or Epinephrine (INN) functions as a hormone in the bloodstream and as a neurotransmitter when released across a neuronal synapse. Adrenaline is released by the adrenal medulla upon activation of preganglionic sympathetic nerves innervating this tissue. This activation occurs during times of stress, such as during exercise, heart failure, hemorrhage, excitement or pain. Circulating adrenaline causes [5Klabunde RE. Cardiovascular physiology concepts. Lippincott Williams and Wilkins 2004.]:
- Increased heart rate and inotropy (–1 -adrenoceptor mediated)
- Vasoconstriction in most systemic arteries and veins (postjunctional –1 -and –2 -adrenoceptors mediated)
- Vasodilation in muscle and liver vasculatures at low concentrations (–2 -adrenoceptor mediated)
- Vasoconstriction at high concentrations (–1 -adrenoceptor mediated)
1.4.1. Adrenaline Usage in Critically Ill Patients
An observational study, which enrolled 84 patients in an ICU between February and March 2005, showed that between 35% and 45% of patients were treated with inotropes [6Biswal S, Mishra P, Malhotra S, Puri GD, Pandhi P. Drug utilization pattern in the intensive care unit of a tertiary care hospital J Clin Pharmacol 2006; 46(8 ): 945-51.]. Adrenaline is used in patients who are in cardiac arrest or who require inotropic or vasopressor support. Adrenaline may additionally be used in cases of anaphylaxis associated with hemodynamic instability or respiratory distress [1American heart association guidelines for cardiopulmonary resuscitation and emergencycardiovascular care, part 7.4: Monitoring and medications Circulation 2005; 112: IV78-83., 7Ellis AK, Day JH. Diagnosis and management of anaphylaxis Can Med Assoc J 2003; 169(4): 307-11.]. Furthermore, it improves myocardial and cerebral hemodynamics during cardiopulmonary resuscitation (CPR).
1.5. Goals for this Research
The goals for this research are twofold. The first aim is to test the CVS model in drug therapy scenarios and by doing so to provide a basis for future clinical trials. Ultimately, the goal is to use the CVS model and methods developed to predict the patient’s response towards different drugs and doses over time to individualize and customize this aspect of patient care.
Pharmaceuticals represent 4% to 7% of the yearly operating expense of most hospitals [8Pierpaoli PG. The rising cost of pharmaceuticals: a director of pharmacy’s perspective Am J Hosp Pharm 1993; 50(8)(Suppl 4): S6-8.] and in ICUs this value ranges from 32.6% to 41.5% of a hospital’s total drug costs [9Weber RJ, Kane SL, Oriolo VA, Saul M, Skledar SJ, Dasta JF. Impact of intensive care unit (icu) drug use on hospital costs: a descriptive analysis, with recommendations for optimizing icu pharmacotherapy Crit Care Med 2003; 3(1)(Suppl): S17-24.]. Hence, there is a growing financial demand for optimizing the amount of drugs prescribed and avoiding unnecessary prescriptions. Use of this CVS model, or similar, could help reduce these costs by allowing the appropriate patient-specific dose to be found more efficiently, as well as by identifying patient-specific conditions when dosing is necessary (or unnecessary).
It should be pointed out that this CVS model so far has only been clinically validated using data from porcine experiments [10Starfinger C, Hann CE, Chase JG, Desaive T, Ghuysen A, Shaw GM. Modelbased cardiac diagnosis of pulmonary embolism Comput Methods Programs Biomed 2007; 87(1): 46-60.-14Starfinger C, Chase JG, Hann CE, et al. Model-based identification and diagnosis of a porcine model of induced endotoxic shock with hemofiltration Math Biosci 2008; 216(2): 132-9.] within a very controlled environment. In these cases, desired effects are induced purposefully and usually not treated. However, data obtained from clinical trials on critically ill patients, adds the challenge of a multivariate environment, where a variety of therapeutic treatments are performed and drugs are administered combined with different ventilatory support options and fluid administration. Therefore, it is important to know the effect each individual treatment option is likely to have and how the parameters in the CVS model may need to be adjusted to correctly represent these changes.
This study uses human clinical data from 3 adrenaline (epinephrine) dose response studies found in the clinical literature [15White M, Leenen FHH. Effects of age on cardiovascular responses to adrenaline in man Br J Clin Pharmacol 1997; 43: 407-14.-17Levy B, Bollaert PE, Charpentier C, et al. Comparison of norepinephrine and dobutamine to epinephrine for hemody-namics, lactate metabolism, and gastric tonometric variables in septic shock: a prospective, randomized study Intensive Care Med 1997; 23(3): 282-7.]. Adrenaline is a low cost drug, so in this case the motivation for optimizing the dose is not purely on the specific costs of this drug, although it demonstrates the concept and could be applied to other drugs. More importantly, better dosing of adrenaline can reduce general health care costs [18Fenwick E, Wilson J, Sculpher MJ, Claxton K. Pre-operative optimisation employing dopexamine or adrenaline for patients undergoing major elective surgery: a costeffectiveness analysis Intensive Care Med 2002; 28(5): 599-608.] and may avoid the use of other more expensive drugs like dobutamine [19Butterworth JF, Prielipp RC, Royster RL, et al. Dobutamine increases heart rate more than epinephrine in patients recovering from aortocoronary bypass surgery J Cardiothorac Vasc Anesth 1992; 6(5): 535-41.]. The adrenaline studies investigated in this paper present hemodynamic data, such as arterial pressures and the cardiac index, at the level of detail needed for the model identification process, and over periods from one to several hours. Thus, this research demonstrates the ability of the CVS model and methods to develop clinical protocols based on data from human trials and studies.
The goal is to be able to identify the underlying patient-specific parameters that allow the representation of the patient’s hemodynamic status and adrenaline dose response within this CVS model. Note that the model is not in a unified form that is directly applicable in the general case. Rather, it is treated as a broad structure, which is adapted to each individual situation and provides a starting point for aggregating a diverse range of data sets into a more physiological and simpler form for clinicians. More specifically, the CVS model is identified for each data set and therefore represents the unique hemodynamic condition of that patient, expressed in the different parameter values and trends over time. These patient-specific parameter values and trends are then used to develop a general relationship to predict a patient’s response over time to a change in adrenaline dose. Hence, any correlations between hemodynamic measurements for example interdependencies between time histories of the arterial pressure are implicitly accounted for in the model. These predictions are then compared to the clinical data from these studies [15White M, Leenen FHH. Effects of age on cardiovascular responses to adrenaline in man Br J Clin Pharmacol 1997; 43: 407-14.-17Levy B, Bollaert PE, Charpentier C, et al. Comparison of norepinephrine and dobutamine to epinephrine for hemody-namics, lactate metabolism, and gastric tonometric variables in septic shock: a prospective, randomized study Intensive Care Med 1997; 23(3): 282-7.]. Results are presented in form of absolute percentage errors between predicted and clinically observed data.
2. METHODS
2.1. CVS Model
The CVS model is a simple, yet clinically validated model for the heart and circulation [10Starfinger C, Hann CE, Chase JG, Desaive T, Ghuysen A, Shaw GM. Modelbased cardiac diagnosis of pulmonary embolism Comput Methods Programs Biomed 2007; 87(1): 46-60.-13Desaive T, Ghuysen A, Lambermont B, et al. Study of ventricular interaction during pulmonary embolism using clinical identification in a minimum cardiovascular system model 1 In: Conf Proc IEEE Eng Med Biol So; 2007; pp. : 2976-9., 20Smith BW, Chase JG, Nokes RI, Shaw GM, Wake G. Minimal haemodynamic system model including ventricular interaction and valve dynamics Med Eng Phys 2004; 26(2): 131-39.-22Shaw GM, Chase JG, Starfinger C, et al. Modelling the cardiovascular system Crit Care Resusc 2007; 9(3): 264-69.]. This model comprises a series of connected pressure-volume chambers with greater detail for the active ventricular portions of the heart and their interaction. More specifically, the left/right ventricle, aorta, pulmonary artery/vein, vena cava are captured as explicit physiological regions with independent fundamental circulatory (PV) dynamics. Fig. (1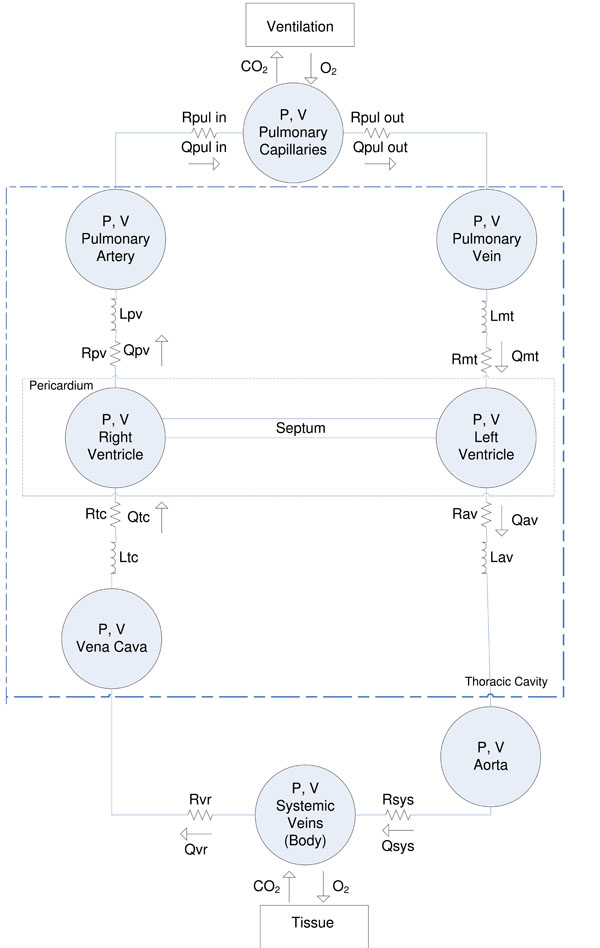 ) gives an overview of the CVS model and a more detailed description of the model can be found in [11Starfinger C, Chase JG, Hann CE, et al. Model-based identification of peep titrations during different volemic levels Comput Methods Programs Biomed 2008; 91(2): 135-44.-13Desaive T, Ghuysen A, Lambermont B, et al. Study of ventricular interaction during pulmonary embolism using clinical identification in a minimum cardiovascular system model 1 In: Conf Proc IEEE Eng Med Biol So; 2007; pp. : 2976-9.].
 |
Fig. (1) Overview of the CVS model used in this research. |
2.2. Integral-Based Parameter Identification
The parameter identification method used in this research has previously been shown to rapidly and accurately identify most of the parameter set in the presence of significant measurement noise [10Starfinger C, Hann CE, Chase JG, Desaive T, Ghuysen A, Shaw GM. Modelbased cardiac diagnosis of pulmonary embolism Comput Methods Programs Biomed 2007; 87(1): 46-60., 23Hann CE, Chase JG, Shaw GM. Integral-based identification of patient specific parameters for a minimal cardiac model Comput Methods Programs Biomed 2006; 81(2): 181-92.]. As the identification process has been extensively described [11Starfinger C, Chase JG, Hann CE, et al. Model-based identification of peep titrations during different volemic levels Comput Methods Programs Biomed 2008; 91(2): 135-44.-13Desaive T, Ghuysen A, Lambermont B, et al. Study of ventricular interaction during pulmonary embolism using clinical identification in a minimum cardiovascular system model 1 In: Conf Proc IEEE Eng Med Biol So; 2007; pp. : 2976-9.], only a brief summary of the individual steps is provided here.
2.3. Summary of the Identification Process
Fig. (2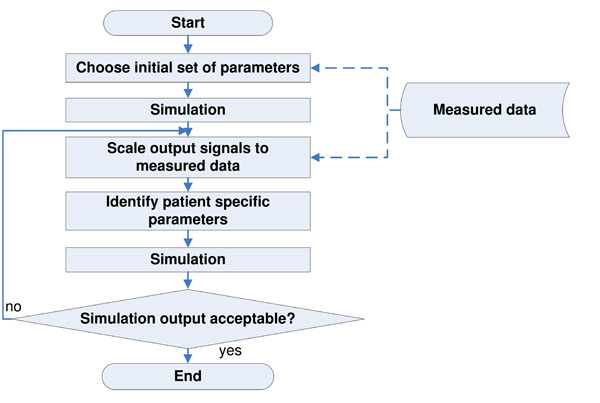 ) gives an overview of the identification process based on previous work [10Starfinger C, Hann CE, Chase JG, Desaive T, Ghuysen A, Shaw GM. Modelbased cardiac diagnosis of pulmonary embolism Comput Methods Programs Biomed 2007; 87(1): 46-60.-12Starfinger C, Chase JG, Hann CE, et al. Prediction of hemodynamic changes towards peep titrations at different volemic levels using a minimal cardiovascular model Comput Methods Programs Biomed 2008; 91(2): 128-34.,23Hann CE, Chase JG, Shaw GM. Integral-based identification of patient specific parameters for a minimal cardiac model Comput Methods Programs Biomed 2006; 81(2): 181-92.]. The following steps are performed:
 |
Fig. (2) Flowchart of the identification process, performed to calculate the optimal set of CVS model parameters that best represent the clinical data. |
- Obtain clinical measurements and signals
- Use volume calculations to estimate the initial volume conditions for the CVS model (see [11Starfinger C, Chase JG, Hann CE, et al. Model-based identification of peep titrations during different volemic levels Comput Methods Programs Biomed 2008; 91(2): 135-44.])
- Use initial set of parameters to obtain first simulation output (see [10Starfinger C, Hann CE, Chase JG, Desaive T, Ghuysen A, Shaw GM. Modelbased cardiac diagnosis of pulmonary embolism Comput Methods Programs Biomed 2007; 87(1): 46-60.-12Starfinger C, Chase JG, Hann CE, et al. Prediction of hemodynamic changes towards peep titrations at different volemic levels using a minimal cardiovascular model Comput Methods Programs Biomed 2008; 91(2): 128-34.])
- Scale simulation output signals (Ppa, Pao, Vlv, Vrv ) to match the clinical data (see [10Starfinger C, Hann CE, Chase JG, Desaive T, Ghuysen A, Shaw GM. Modelbased cardiac diagnosis of pulmonary embolism Comput Methods Programs Biomed 2007; 87(1): 46-60.-12Starfinger C, Chase JG, Hann CE, et al. Prediction of hemodynamic changes towards peep titrations at different volemic levels using a minimal cardiovascular model Comput Methods Programs Biomed 2008; 91(2): 128-34.])
- Identify the patient-specific parameters for the scaled signals using the integral-based methods based on [23Hann CE, Chase JG, Shaw GM. Integral-based identification of patient specific parameters for a minimal cardiac model Comput Methods Programs Biomed 2006; 81(2): 181-92.]
- Re-scale the simulation output signals to better match the clinical data
- Repeat steps 4 to 6, and stop the iterative process when a set error tolerance is reached
2.4. Experimental Protocols
Three clinical studies reported in the literature were used in this research [15White M, Leenen FHH. Effects of age on cardiovascular responses to adrenaline in man Br J Clin Pharmacol 1997; 43: 407-14.-17Levy B, Bollaert PE, Charpentier C, et al. Comparison of norepinephrine and dobutamine to epinephrine for hemody-namics, lactate metabolism, and gastric tonometric variables in septic shock: a prospective, randomized study Intensive Care Med 1997; 23(3): 282-7.]. Results from each are employed here to identify the CVS model. Hence, the clinical data is thus not the work of the authors and only the available published results are used here.
2.4.1. Study 1: Effects of Age on Cardiovascular Responses to Adrenaline in Man
In this study [15White M, Leenen FHH. Effects of age on cardiovascular responses to adrenaline in man Br J Clin Pharmacol 1997; 43: 407-14.], Adrenaline was administered to 14 young normotensive subjects (age 21-40 years, mean 30± 2 years; 8 male, 6 female) and 18 older normotensive subjects (age 50-73 years, mean 60± 2 years; 6 male, 12 female). All subjects had weight within 20% of the ideal body weight. They all had normal history, physical examination and biochemistry. The subjects were instructed to refrain from caffeine and alcohol 24 hours prior to each study morning and they did not take any other medication for the duration of the study. The study was approved by the Human Ethics Committee of the University of Ottawa and written informed consent was obtained.
Arterial blood pressure (ABP) was measured using a blood pressure cuff applied to the arm that was not used for the infusion. Blood pressure was recorded using a Roche Arteriosonde (Roche Medical Electronics Inc., Cranbury, NJ, USA). ECG electrodes were applied to measure heart rate (HR) by a Tektronic 414 monitor (Tektronic Inc., Beaverton, OR, USA). On the study morning, following a rest period of at least 60 minutes, adrenaline was started at 20 ng/kg/min and increased to 40, 80, 120 and 160 ng/kg/min or until the heart rate had increased by 20-25 beats/min or the diastolic blood pressure decreased by 15 mmHg. Each dose was infused for 8 mins. Heart rate and blood pressure were measured every 2 mins for 10 minute periods prior to the start of an infusion and twice during the last 2-3 mins at each infusion rate. Mean and standard deviation are used for analysis.
Table 1 summarizes the data obtained from this study for the different adrenaline doses and populations (young/older and male/female). The following measurements are used for the parameter identification process:


- heart rate (HR)
- systolic and diastolic arterial pressures (SAP, DAP)
- left ventricular end-systolic and end-diastolic volume indexes (LVESVI, LVEDVI)
- left ventricular stroke volume (LVSV, as calculated from LVEDVI and LVESVI)
Overall, this study provides 24 unique data sets that may be used.
2.4.2. Study 2: The Metabolic and Renal Effects of Adrenaline and Milrinone in Patients with Myocardial Dysfunction After Coronary Artery Bypass Grafting
In this study [16Heringlake M, Wernerus M, Grunefeld J, et al. The metabolic and renal effects of adrenaline and milrinone in patients with myocardial dysfunction after coronary artery bypass grafting Crit Care 2007; 11(2): R51.], 251 patients were screened over 18 months for low cardiac output (CO) upon ICU admission after coronary artery bypass grafting (CABG) surgery. Approval of the local Ethics Committee and preoperative written consent was obtained. Patients having a cardiac index (CI) of less than 2.2 l / min / m2 upon ICU admission (despite adequate arterial and filling pressures) were randomly assigned to 14-hour treatment with adrenaline (n=7) or milrinone (n=11) to achieve a CI of greater then 3 l / min / m2.
Drugs were given by continuous infusion without a bolus. Treatment in the ICU and the care provided to the patients was at the discretion of the clinical staff in charge. With the exception of the hemodynamic goals given above and the prohibition of using diuretics or hydroxyethylstarch preparations during the treatment duration, no specific therapeutic instructions were given.
All patients had a radial arterial line, a central venous catheter and a pulmonary artery catheter for continuous measurement of mixed venous oxygen saturation (SvO2) and CI (Vigilance, Edwards Lifesciences LLC, Irvine, CA, USA). Hemodynamics were recorded every two hours for a 14 hour treatment period after ICU admission. The hemodynamic variables recorded include: mean arterial pressure (MAP), central venous pressure (CVP), mean pulmonary artery pressure (MPAP), HR and CI. The following subset of available measurement data are used for the parameter identification process:
- heart rate (HR)
- mean arterial and mean pulmonary artery pressures (MAP, MPAP)
- cardiac index (CI)
- central venous pressure (CVP)
Overall, this data from [16Heringlake M, Wernerus M, Grunefeld J, et al. The metabolic and renal effects of adrenaline and milrinone in patients with myocardial dysfunction after coronary artery bypass grafting Crit Care 2007; 11(2): R51.] provided 8 data sets for use.
2.4.3. 2.4.3. Study 3: Comparison of Norepinephrine and Dobutamine to Epinephrine for Hemodynamics, Lactate Metabolism, and Gastric Tonometric Variables in Septic Shock: A Prospective, Randomized Study
This study [17Levy B, Bollaert PE, Charpentier C, et al. Comparison of norepinephrine and dobutamine to epinephrine for hemody-namics, lactate metabolism, and gastric tonometric variables in septic shock: a prospective, randomized study Intensive Care Med 1997; 23(3): 282-7.] included 30 patients with hyperdynamic septic shock and was approved by the local Ethics Committee and written informed consent was obtained from the patient’s closest relative. To be included in the study after volume resuscitation and treatment with dopamine up to a dose of 20μg/kg/min, the patients had to have the following baseline condition:
- MAP ≤60mmHg
- signs of altered perfusion (oliguria, <30ml/hr) or increased lactate level (>2.5mml/l)
- CI > 3.5l / min / m2
Heart rate was monitored continuously and the routine clinical monitoring included a thermodilution pulmonary artery catheter, with continuous monitoring of mixed venous oxygen saturation (SvO2) and a radial and femoral artery catheter. Measurements of MAP, CVP, MPAP were taken and CO was measured by thermodilution. Each patient received either epinephrine or norepinephrine + dobutamine. Epinephrine infusions were started at 0.3 μg/kg/min. The infusion rate was titrated on MAP at 5-min intervals to obtain a MAP > 80mmHg, with a stable or increased CI.
Table 2 summarizes the adrenaline titration given. The following measurements are used for the parameter identification process:
- heart rate (HR)
- mean arterial and mean pulmonary artery pressures (MAP, MPAP)
- cardiac index (CI)
- central venous pressure (CVP)
Overall, 5 data sets were available for use in this study.
2.5. Estimations and Prediction Process
Depending on the data available for each study, different assumptions about the rest of the data had to be made. Generally, the prediction process uses some measure of past information on how the patient responded towards a change in adrenaline dose to predict how the patient is likely to respond towards a future change in dose. Hence, the adrenaline responses from other patients are not required to make a prediction, so population model evaluation methods like cross-validation, are not appropriate in this case.
The set of parameters chosen to primarily govern prediction are highly dependent on the patient condition, the time periods involved and the therapy chosen. The technique presented in this paper is to first identify the main parameters that physiologically should change based on previous data and knowledge in the literature. The next step is to predict forward in time on data that has not been fitted to. If predictions are within a reasonable error, the parameters can be said to adequately describe the impact of the therapy under consideration. If not the parameter set or the model needs to be expanded to allow more dynamics. Clinical trials are required to put precise magnitudes on how accurate a prediction needs to be to provide a measurable patient outcome.
Depending on the data available, the prediction process is adjusted for each of the 3 studies as described below. The error metrics chosen are always the median and a range estimate. The reason for this choice is that clinical errors and data are very rarely normally distributed [24Micceri T. The unicorn, the normal curve, and other improbable creatures Psychol Bull 1989; 105(1): 156-66.] so that metrics based on the mean are not as robust. Hence a range metric (IQR) is chosen since it is independent of the distribution.
2.5.1. Adrenaline-Specific Parameters
As discussed before, the effects of adrenaline can be summarized as an increase in HR and contractility, vasoconstriction in most systemic arteries and veins and an increase in the central blood volume. These effects in turn lead to an increase in SV and systemic arterial pressure (SAP). Diastolic arterial pressure (DAP) is decreasing, and thus a relatively constant mean arterial pressure (MAP) results, but with a largely increased pulse pressure (PP). Consequently, from these physiologically expected effects the model parameters (see Fig. 1) that should be most influenced by adrenaline, are:
- left and right ventricular end-systolic elastances (Eeslvf, Eesrvf); also representing the contractility
- arterial and pulmonary elastances Eao and Epa; as affected by the change in pulse pressure
- systemic arterial resistance Rsys; as affected by vasoconstriction
- systemic elastance Esys (1/compliance); affected by increases in Vsys
As the most pronounced changes are expected in Eeslvf, Eesrvf, Eao and Epa, these parameters are termed the adrenaline-specific parameters. Changes in these parameter values are therefore used for predicting the future response towards a change in dose of adrenaline or over time. However, for studies 2 and 3 [16Heringlake M, Wernerus M, Grunefeld J, et al. The metabolic and renal effects of adrenaline and milrinone in patients with myocardial dysfunction after coronary artery bypass grafting Crit Care 2007; 11(2): R51.,17Levy B, Bollaert PE, Charpentier C, et al. Comparison of norepinephrine and dobutamine to epinephrine for hemody-namics, lactate metabolism, and gastric tonometric variables in septic shock: a prospective, randomized study Intensive Care Med 1997; 23(3): 282-7.], changes in Rsys and Esys were also included in the prediction rules. This difference can be explained by the overall much longer time periods for these 2 studies, where the hemodynamic status of the patients is more likely to have changed, for example due to vasoconstriction and/or a change in blood volume over that time period.
2.5.2. Study 1
This study provided the best data for the identification process, with very detailed data reported over a variety of subjects and conditions. As this study was a planned interventional clinical trial study, it took place in a very controlled environment and adrenaline was administered into each participant following a strict protocol. It is thus safe to assume it was administered in exactly the same way, with the same dose, and over the same time, for each participant.
Hence, this part of the study presented concentrates on demonstrating the ability of the CVS model to simulate the different effects of adrenaline, identifying general relationships between adrenaline dose and model parameters, and testing the model’s shorter term predictive ability in response to changes in dose.
All 16 individual data sets obtained from the study (6 data sets per dose for Y and O group plus one additional set for the YM, YF and OM, OF groups at baseline, see also Table 1) were identified using the methods described in [10Starfinger C, Hann CE, Chase JG, Desaive T, Ghuysen A, Shaw GM. Modelbased cardiac diagnosis of pulmonary embolism Comput Methods Programs Biomed 2007; 87(1): 46-60.-12Starfinger C, Chase JG, Hann CE, et al. Prediction of hemodynamic changes towards peep titrations at different volemic levels using a minimal cardiovascular model Comput Methods Programs Biomed 2008; 91(2): 128-34.]. The changes in the adrenaline-specific parameters (Eeslvf , Eesrvf , Eao and Epa) in the Y group were observed and a linear fit was obtained for the 5 dose changes from baseline to 160 ng/kg/min. This trend is used for prediction.
Predictions are performed for the (independent) O group and then the (independent) YM, YF, OM andOF data sets. The first prediction in each data set uses the baseline parameters identified for each of these groups (O, OM, OF, YM, YF), as it is necessary to have a baseline solution vector of model parameters to begin. The adrenaline-specific parameters (Eeslvf , Eesrvf , Eao and Epa) are then modified to account for a change in dose from the baseline, using the linear prediction rule obtained from the linear fit in the Y group. With these modified adrenaline-specific parameters, the model is run and the predicted hemodynamic output signals for SAP, DAP, MAP, LVEDVI, LVESVI and SV are compared to the clinical data from [15White M, Leenen FHH. Effects of age on cardiovascular responses to adrenaline in man Br J Clin Pharmacol 1997; 43: 407-14.]. Median absolute percentage errors and the inter-quartile range (IQR) are calculated.
A second type of prediction is also performed. In this case, the previous model parameter value vector identified from the previous change in dose is used, rather than those from the baseline parameter vector. This effectively shortens the interval or dose over which the adrenaline-specific parameter changes are employed. The adrenaline-specific parameters (Eeslvf , Eesrvf , Eao and Epa) are then modified based on the linear prediction rule as before and the model is then forward simulated again to obtain a prediction of the hemodynamic outcome to the change in dose. Finally, the resulting predicted output signals for SAP, DAP, MAP, LVEDVI, LVESVI and SV are compared to the clinical data. Median absolute percentage errors and the inter-quartile range (IQR) are calculated.
In this study, the pulmonary artery pressure is not given and has to be estimated. The pulmonary artery pressure is estimated as a constant pressure over all dosages and participant groups with a systolic value of 25 mmHg and a diastolic value of 12 mmHg. Note, that this estimation is physiologically incorrect, as the pulmonary artery pressure is expected to change with different doses of adrenaline. However, by keeping this pressure fixed for all identifications, it can be guaranteed that only a constant error is added to the identification process. This error can be much better managed if it is similar for all identified segments. Naturally, information about the pulmonary circulation is lost and the value of Epa will also not necessarily represent a true value in this case.
2.5.3. Studies 2 and 3
These 2 studies are used as further tests. In particular, they test the potential to correctly identify patient-specific parameters in the absence of diastolic and systolic pressure measurements, given only the mean arterial pressures MAP and MPAP. In addition, these 2 studies do not provide end-systolic or end-diastolic volumes, relying instead on the cardiac index. Finally, the data in these studies covers much longer time periods extending the prediction range.
As noted, these 2 studies measure a very minimal amount of data. Hence, several assumptions have to be made to use the data in this study:
- SV is calculated based on HR and CI with an assumed BSA = 2m2 in all cases
- ESV is assumed as SV+10ml
- EDV is calculated as ESV+SV
- left and right ventricular volumes are assumed to be the same
- systolic and diastolic pressures are estimated based on Fig. (3
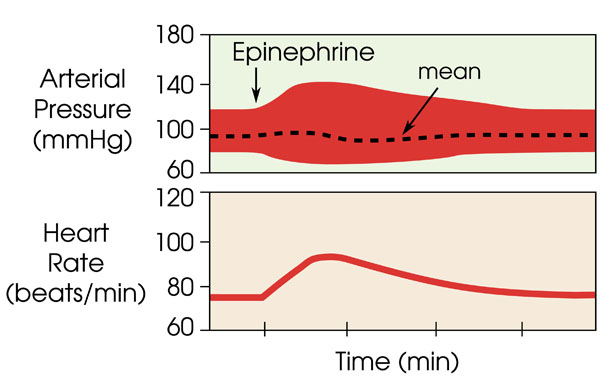 ) as obtained from [5Klabunde RE. Cardiovascular physiology concepts. Lippincott Williams and Wilkins 2004.]
In these 2 studies, there is only a limited amount of data available. In comparison to study 1, this data is very inhomogeneous and was not obtained in a controlled study. Instead, it was taken observationally over time periods of 14 and 24 hours, respectively. Therefore, these data sets were not intended to truly predict the patient’s response towards a change in dose in adrenaline, or over the course of time.
The goal in these data sets is to show the accuracy of the identification process by testing if an overall rule can be found that shows a consistent way of identifying the main adrenaline-specific parameters. If such a simple, linear rule can be found, using all or most of the data points available, then this rule would show that the parameters evolved in a consistent manner. This rule could then be used to predict the patient’s response for a specific point in time. If successful, it would demonstrate the approach of using drug-specific rules and parameter changes to enhance identification and prediction.
For study 2, prediction rules are obtained from the absolute percentage changes in the model parameter values from one point in time to the next, except for the change from baseline to t2. This percentage difference is not included because this change is expected to be much higher, as the effect of adrenaline is expected to be more pronounced compared to the other time points where the adrenaline dose is kept at a more constant level. A total of 6 predictions are performed for study 2 from t4 to t14, using the previous solution as baseline solution in each case. For example, for predicting the response at t4, the parameters from t2 are used plus the re-calculated adrenaline-specific parameters using the overall population rule, as described before. In contrast to study 1, where the adrenaline-specific parameters are Eeslvf , Eesrvf , Eao and Epa, for this data set it was necessary to also re-calculate the systemic and pulmonary arterial resistances Rsys and Rpul and the systemic elastance Esys. These 3 additional parameters changed significantly during the time course of the study and were thus included in the overall population rule.
Similarly to study 2, the prediction rules for study 3 are obtained from the absolute percentage changes in the parameters from one point in time to the next. However, here only the change from h1 to h6 is used. The baseline change was excluded for the same reason as in study 2. For similar reasons the change to h24 was excluded, as this change covers a long time period (12 hours). In addition, while the doses for h1, h6 and h12 are similar, there is a much lower dose at h24. Hence, only 1 prediction is performed for study 3 and this is the prediction for h12, using the data obtained from h1 and h6.
This prediction from study 3 serves as another test of the CVS model and identification process. The goal is to show that all parameters are identified in such a consistent way that h1-h6 adrenaline-parameter specific rules can be found to predict h12. The adrenaline-specific parameters Eeslvf , Eesrvf , Eao and Epa and used with study 1 are augmented for study 3 to include Rsys, which changed considerably during the long time course of this study. Fig. (4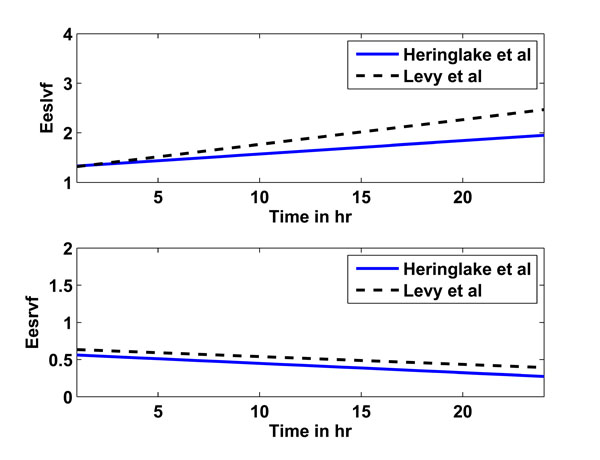 ) shows the prediction rules obtained for studies 2 (solid line) and 3 (dashed line) for Eeslvf and Eesrvf over a time period of 1 to 24 hours, where the similarity over disparate studies indicates a consistent underlying physiological behaviour.
3. RESULTS
3.1. Study 1
3.1.1. Identification Results
Fig. (5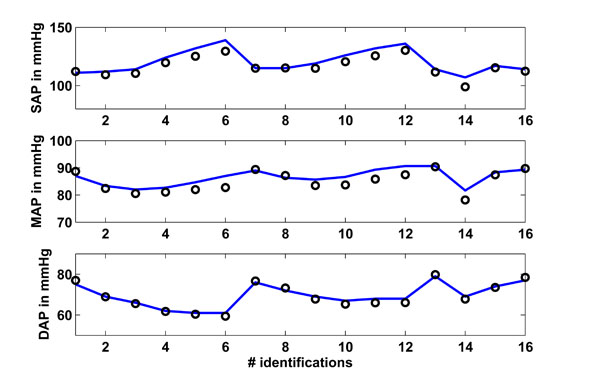 ) shows in the upper panel (solid line) the mean systolic arterial pressure (SAP) over all 16 segments as given in [15White M, Leenen FHH. Effects of age on cardiovascular responses to adrenaline in man Br J Clin Pharmacol 1997; 43: 407-14.]. These 16 segments are the 6 measurements for the young and older groups at baseline, 20, 40, 80, 120 and 160 ng/kg/min adrenaline (segments 1-6 young, 7-12 older), plus 4 measurements, which are obtained by separating the young and older groups for male and female, respectively. The circles are the simulated CVS model outputs obtained when the CVS model is re-run with the identified patient-specific parameters.
 |
Fig. (3) Change in diastolic and systolic blood pressure in comparison to a relatively constant mean arterial pressure with administration of epinephrine (adrenaline) over time, as obtained from [5Klabunde RE. Cardiovascular physiology concepts. Lippincott Williams and Wilkins 2004.]. |
 |
Fig. (4) Linear prediction rules for Eeslvf (upper panel) and Eesrvf (lower panel) for studies 2 (Heringlake et al., solid line) and 3 (Levy et al., dashed line). |
 |
Fig. (5) Study 1: Clinical mean systolic (SAP), diastolic (DAP) and mean (MAP) arterial pressure as obtained from [15White M, Leenen FHH. Effects of age on cardiovascular responses to adrenaline in man Br J Clin Pharmacol 1997; 43: 407-14.] vs simulated pressures. Solid lines represent the clinical data and circles represent the CVS model simulation output using identified patient-specific parameters. |
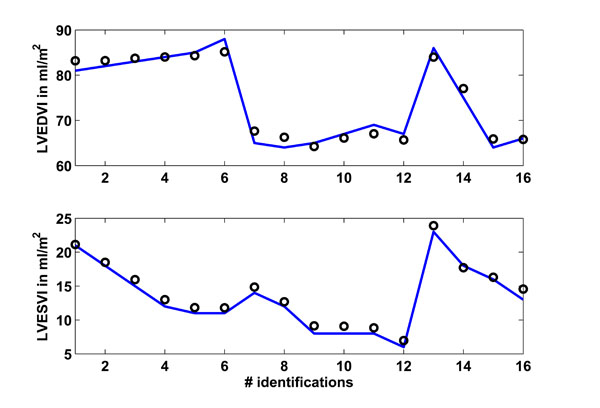 |
Fig. (6) Study 1: Clinical mean left ventricular end-diastolic (LVEDVI) and end-systolic (LVESVI) volume index as obtained from [15White M, Leenen FHH. Effects of age on cardiovascular responses to adrenaline in man Br J Clin Pharmacol 1997; 43: 407-14.] vs simulated volume indexes. Solid lines represent the clinical data and circles represent the CVS model simulation output using identified patient-specific parameters. |
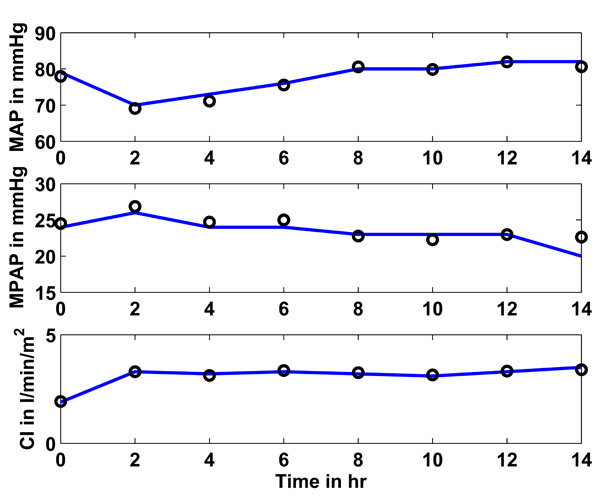 |
Fig. (7) Study 2: Clinical mean arterial (MAP), mean pulmonary artery (MPAP) pressure and cardiac index (CI) as obtained from [16Heringlake M, Wernerus M, Grunefeld J, et al. The metabolic and renal effects of adrenaline and milrinone in patients with myocardial dysfunction after coronary artery bypass grafting Crit Care 2007; 11(2): R51.] vs simulated pressures and CI. Solid lines represent the clinical data and circles represent the CVS model simulation output using identified patient-specific parameters. |
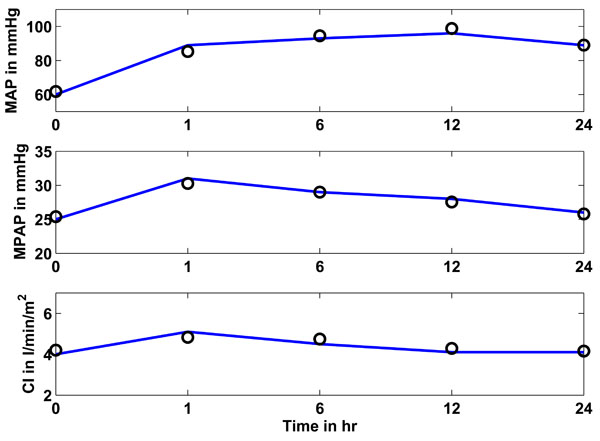 |
Fig. (8) Study 3: Clinical mean arterial (MAP), mean pulmonary artery (MPAP) pressure and cardiac index (CI) as obtained from [17Levy B, Bollaert PE, Charpentier C, et al. Comparison of norepinephrine and dobutamine to epinephrine for hemody-namics, lactate metabolism, and gastric tonometric variables in septic shock: a prospective, randomized study Intensive Care Med 1997; 23(3): 282-7.] vs simulated pressures and CI. Solid lines represent the clinical data and circles represent the CVS model simulation output using identified patient-specific parameters. |
The middle panel shows as a solid line the mean arterial pressure (MAP) as available in [15White M, Leenen FHH. Effects of age on cardiovascular responses to adrenaline in man Br J Clin Pharmacol 1997; 43: 407-14.] for all 16 segments. The circles depict the CVS model output data when re-run using patient-specific parameters. The lower panel shows the same results for the diastolic arterial pressure (DAP).
Fig. (6 ) shows in the upper panel the left ventricular end-diastolic index (LVEDVI) as given in [15White M, Leenen FHH. Effects of age on cardiovascular responses to adrenaline in man Br J Clin Pharmacol 1997; 43: 407-14.], whereas the lower panel shows the left ventricular end-systolic index (LVESVI). A total of 16 identifications were performed, with 6 identifications each in the young and older group plus another 4 identifications separated for male and female, as described previously. The circles represent the CVS model output signals.
Table 3 gives an overview of how well the CVS model output data matches the data given in [15White M, Leenen FHH. Effects of age on cardiovascular responses to adrenaline in man Br J Clin Pharmacol 1997; 43: 407-14.]. The absolute median percentage error is given as well as the inter-quartile range (IQR). These two values are calculated over all 16 identified segments.
3.1.2. Prediction Results
Table 4 gives the median absolute percentage errors and IQR for prediction 1 in study 1. This prediction uses a population-specific rule obtained only from the young population to describe the changes in the main adrenaline-specific model parameters caused by an increase in the adrenaline dose from baseline and 20 ng/min/kg to 160 ng/min/kg. Note that the baseline solution vector was used as initial solution for each time step and only the adrenaline-specific parameters were updated according to the population-specific rule.
Table 5 gives the median absolute percentage errors and IQR for prediction 2 in study 1. This second prediction uses the same population-specific rules as were used in prediction 1. However, in contrast to prediction 1, the previous solution is used as initial solution, rather than the baseline solution. Thus, for example, for predicting and calculating the parameters for a dose of 120 ng/min/kg, the identified parameters for a dose of 80 ng/min/kg are used.
3.2. Study 2
3.2.1. Identification Results
Fig. (7 ) shows in the upper panel (solid line) the mean arterial pressure (MAP) over 14 hours as given in [16Heringlake M, Wernerus M, Grunefeld J, et al. The metabolic and renal effects of adrenaline and milrinone in patients with myocardial dysfunction after coronary artery bypass grafting Crit Care 2007; 11(2): R51.]. The circles represent the CVS model outputs obtained when the CVS model is re-run with the identified patient-specific parameters. The middle panel shows as a solid line the mean pulmonary artery pressure (MPAP) as obtained from [16Heringlake M, Wernerus M, Grunefeld J, et al. The metabolic and renal effects of adrenaline and milrinone in patients with myocardial dysfunction after coronary artery bypass grafting Crit Care 2007; 11(2): R51.] over the 14 hour study period. The circles depict the CVS model output data when re-run using the identified parameters. The lower panel shows the same results for the cardiac index (CI).
Table 6 gives an overview of how well the CVS model output data matches the data given in [16Heringlake M, Wernerus M, Grunefeld J, et al. The metabolic and renal effects of adrenaline and milrinone in patients with myocardial dysfunction after coronary artery bypass grafting Crit Care 2007; 11(2): R51.] in terms of median and inter-quartile range (IQR). These values are provided over all 8 identified segments for the total 14-hour study period.
3.2.2. Prediction Results
Table 7 gives the median absolute percentage errors and IQR for predicting the hemodynamic responses in MAP, MPAP and CI based on the time in the study. Note, that the rules for the adrenaline-specific parameters were obtained from the middle time segments at 2 to 12 hours. The hemodynamic responses are predicted for 6 different time segments at 4, 6, 8, 10, 12 and 14 hours. The previous parameter solution vector was used as the initial solution for each predicted segment.
3.3. Study 3
3.3.1. Identification Results
Fig. (8 ) shows in the upper panel (solid line) the mean arterial pressure (MAP) over 24 hours as given in [17Levy B, Bollaert PE, Charpentier C, et al. Comparison of norepinephrine and dobutamine to epinephrine for hemody-namics, lactate metabolism, and gastric tonometric variables in septic shock: a prospective, randomized study Intensive Care Med 1997; 23(3): 282-7.]. The circles represent the simulated CVS model outputs obtained when the CVS model is re-run with the identified patient-specific parameters. The middle panel shows as a solid line the mean pulmonary artery pressure (MPAP) as obtained from [17Levy B, Bollaert PE, Charpentier C, et al. Comparison of norepinephrine and dobutamine to epinephrine for hemody-namics, lactate metabolism, and gastric tonometric variables in septic shock: a prospective, randomized study Intensive Care Med 1997; 23(3): 282-7.] over the 24 hour study period. The circles represent the CVS model output data when re-run using the identified parameters. The lower panel shows the same results for the cardiac index (CI). It should be noted that the last prediction for MPAP in Fig. (7) is significantly less accurate than all other predictions. This effect could be random but the variation in MPAP is not sufficient enough to properly assess this result, since it is still only 2 mmHg in error, which is clinically small. Further results over a longer time period that have bigger fluctuations in MPAP would be required to fully understand whether or not this effect is a potential modeling error that needs to be addressed.
Table 8 gives an overview of how well the CVS model output data matches the data in [17Levy B, Bollaert PE, Charpentier C, et al. Comparison of norepinephrine and dobutamine to epinephrine for hemody-namics, lactate metabolism, and gastric tonometric variables in septic shock: a prospective, randomized study Intensive Care Med 1997; 23(3): 282-7.]. The median absolute percentage error is shown, as well as the inter-quartile range (IQR). These two values are calculated over all 5 identified segments for the total study period of 24 hours.
3.3.2. Prediction Results
Table 9 gives the median absolute percentage errors and IQR for predicting the hemodynamic responses in MAP, MPAP and CI based on the time in the study. The rules for the adrenaline-specific parameters were obtained from the time segments h1 and h6 to predict a single response at h12. The parameter solution vector at h6 was used as initial solution for the prediction of h12.
4. DISCUSSION
For all 3 studies, the model simulation output signals match the clinical data very well, as can be seen in Figs. (5, 6) for study 1, and Figs. (7, 8) for studies 2 and 3, respectively. The absolute percentage errors (median and IQR) between simulated and clinical data for arterial pressures (SAP, DAP and/or MAP), ventricle volume indexes (LVEDVI and LVESVI), stroke volume (SV) and/or cardiac index (CI) for all 3 studies are given in Tables 3-8. It can clearly be seen, that all median identification percentage errors are less than 9%. An error of 10% is a reasonable estimate of measurement error in hemodynamic monitoring. For example, in continuous cardiac output monitoring, the percentage repeatability coefficient can vary from 6.4-26% and no monitor can have limits of agreement closer than + 0.5 L/min [25Kuper M. Continuous cardiac output Curr Anaesth Crit Care 2004; 15: 367-77.]. Given that a normal cardiac output is 5L/min, a 10% error is a rough guideline in this case. MAP is known to be sensitive to patient position depending on the transducer placement with errors that can vary from 2.9-1.9 mmHg [26McCann UG, Schiller HJ, Carney DE, et al. Invasive arterial bp monitoring in trauma and critical care: Effect of variable transducer level, catheter access, and patient position Chest 2001; 120: 1322-6.]. Given that normal MAP is 80 mmHg these errors correspond to a percentage variation of between 3.6 and 18.6%. There can also be distortions in the arterial pressure waveform which can significantly affect calculations in SAP and DAP [27McGhee BH, Bridges EJ. Monitoring arterial blood pressure: what you may not know Crit Care Nurs 2002; 22: 60-79.]. Thus 10% is chosen to be a reasonably conservative threshold where the model can be considered to adequately capture and predict the measured data. This value is within or near expected measurement errors.
These results show the good overall accuracy of the identification method and parameters found. It also shows the model’s ability to capture these dynamics in physiologically expected ways, as well as the assumptions and estimations made. In particular, such generally good identifications are not likely possible without a fundamentally valid model and approach.
Table 4 shows the median absolute percentage errors and IQR for prediction 1 for study 1. This first prediction used the population-specific rule obtained only from the Y population to describe the changes in the adrenaline-specific model parameters that are caused by an increase in the adrenaline dose from 20 ng/min/kg to 160 ng/min/kg. Predictions were performed for the O, YM, YF, OM and OF groups with absolute percentage errors less than 14% in the pressures and less than 8% for the stroke volume. This low level of prediction error is a very good result, as bigger differences might be expected in the adrenaline dose response between the young (Y) and older (O) group, and also between male (M) and female (F) groups. Nevertheless, reasonably good predictions were obtained, showing the general applicability of the CVS model and methods.
More specifically, MAP in the older (O) group was consistently under-predicted (median absolute percentage error 10%). However this bias is in accordance with the results from [15White M, Leenen FHH. Effects of age on cardiovascular responses to adrenaline in man Br J Clin Pharmacol 1997; 43: 407-14.], where MAP decreases more in the Y group then it does for the O group. Thus, this trend, when calculating the prediction rules from the Y group, is transferred to the predictions in the O group. However, these prediction errors are still within clinically reasonable or acceptable ranges. This result also shows that same cohorts may well require cohort-specific rules, even if the general trends are similar.
Table 5 shows the median absolute percentage errors and IQR for prediction 2 for study 1. This second prediction uses the same population-specific rules as used in prediction 1. However, in contrast to prediction 1, the previous solution is used as initial solution and not the baseline solution. Thus, more information is included in the prediction process, especially for predictions at the end of the study (for higher doses) where it would be expected that the remaining model parameters have also changed slightly over the longer time scale of the study. Hence, better prediction results are obtained with median errors less than 7% for arterial pressures and stroke volume.
Importantly, these 2 predictions in study 1 show how the CVS model might potentially be best used in clinical application. First, a baseline solution for the specific patient needs to be obtained from regular measurements to create a patient-specific model. Next, prediction rules, likely pre-existing, for the adrenaline-specific parameters can then be used to predict the response to a change in the current adrenaline dose. This first prediction might well yield a reasonable result, and different doses can be tested and predicted with the most appropriate dose chosen for the patient.
However, as time progresses and the dose changes, much better predictions can be obtained by using the previous model parameter values obtained from a different or prior dose. For example, if 60 ng/kg/min at time=2hr, is used as initial parameter set for the prediction at 80 ng/kg/min or time=3hr, a better result might occur. Additionally, and importantly, once changes have been made, prior data can be used to create a patient-specific rule or sensitivity to change the adrenaline-specific parameters more accurately. This latter approach would enable the ability to track patient evolution in response, which is a potential clinical datum on its own right.
Tables 7 and 9 show the absolute percentage errors for the predictions performed for studies 2 and 3. The median prediction errors are less than 6% and less than 11% for studies 2 and 3, respectively. These are good results when the very limited data available in these 2 studies is considered. In particular, all the minimum and maximum arterial pressures and volumes had to be estimated creating a substantial level of potential error for a limited result. Nevertheless, reasonably good prediction results are obtained, illustrating the robustness of the estimations and identification process.
Comparisons of the adrenaline-specific prediction rules between the 3 studies are not fully possible. Study 1 is based on a dose change for a short time, where each infusion lasts 8 minutes, in healthy subjects. In contrast, studies 2 and 3 are observational studies in an ICU environment over a much longer time period of 14 and 24 hours with different doses in between. Hence, the different time scales prevent further direct comparison.
However, the linear prediction rules for studies 2 and 3 are, despite the many assumptions that have to be made, relatively similar, as seen in Fig. (4). The upper panel shows the prediction rule for Eeslvf for study 2 (solid line) and 3 (dashed line), the lower panel shows the prediction rule for Eesrvf. In particular, it should be noted how the right ventricular contractility Eesrvf decreases, instead of the expected increase. This result could be due to inaccurate estimations in the right ventricle volume based on the assumptions made and/or due to the underlying cardiac and circulatory dysfunctions present in the critically ill patients for studies 2 (myocardial dysfunction after CABG) and 3 (septic shock). This type of inconclusive result is an expected limitation of using severely restricted data and making compensatory assumptions that may not hold for broader cohorts.
Obviously, a larger number of studies would help to better confirm these initial results. The overall goal remains to develop adrenaline-specific parameter rules or identification methods that can easily be adjusted to the individual patient regarding age, sex, current drug dose and underlying disease state. These could then directly be used in clinical application and only one baseline solution would be necessary to start the process, rather than using a whole set of identification results to create a rule, as was done in this current study. However, despite these and other limitations, this study has demonstrated the potential of this model for therapeutic decision support, particularly for cases where data density is higher as in study 1. Finally, it should be noted that clinically, if data is gathered automatically at the bedside by computer, such data density should be readily expected and available.
5. CONCLUSION
The integral-based optimization method successively identified patient-specific parameters for the minimal cardiac model for 3 studies of adrenaline therapies. This study shows the ability of the model to adequately and realistically capture (with unique values) the impact of pressure-volume changes with adrenaline in healthy subjects as well as in critically ill patients.
Furthermore, the integral-based optimization led to the successful definition of adrenaline-specific parameters for the CVS model. These adrenaline-specific parameter values were used to test the predictive ability of the model. This further demonstration shows the ability of the model to adequately and realistically simulate the impact of pressure-volume changes with adrenaline in healthy subjects and critically ill patients. Moreover, such rules can be similarly derived and used to predict the response towards a variety of interventions, while errors or deviations from can point out developing disease states or hemodynamic instabilities. This research thus increases the confidence in the clinical applicability and validity of this model and its use in clinical diagnostic monitoring and drug dose guidance.
6. CARDIOVASCULAR MODEL EQUATIONS
Ventricle volumes and flows:
Pressures:
Volumes:
Flows:
Ventricular interaction: