- Home
- About Journals
-
Information for Authors/ReviewersEditorial Policies
Publication Fee
Publication Cycle - Process Flowchart
Online Manuscript Submission and Tracking System
Publishing Ethics and Rectitude
Authorship
Author Benefits
Reviewer Guidelines
Guest Editor Guidelines
Peer Review Workflow
Quick Track Option
Copyediting Services
Bentham Open Membership
Bentham Open Advisory Board
Archiving Policies
Fabricating and Stating False Information
Post Publication Discussions and Corrections
Editorial Management
Advertise With Us
Funding Agencies
Rate List
Kudos
General FAQs
Special Fee Waivers and Discounts
- Contact
- Help
- About Us
- Search


The Open Petroleum Engineering Journal
(Discontinued)
ISSN: 1874-8341 ― Volume 12, 2019
Study and Economic Evaluation on the Process of Calorific Value Adjustment in the LNG Receiving Terminal
Shuting Wang1, *, Kun Huang1, 2, Xiaoshang Wang3, Ning Liao1, Wencan Yan3, Quanbin Pei3, Baoding Xia3
Abstract
In recent years, large quantities of LNG sources have occured in international trade, which have also presented themselves with vary compositions and contain more than 10 mol % light hydrocarbons components (such as ethane and propane).This paper takes a certain typical Chinese liquefied natural gas receiving terminal as an example. For the exchange and economic issues caused by high C2+ components in the feedstock of the above mentioned LNG terminal, an adjustion of the calorific value in products by adopting LH recovery, nitrogen gas injection and liquid nitrogen injection is advised. In order to evaluate profits in LNG receiving terminal, three kinds of processes have been simulated by using of the Aspen HYSYS to realize the consumption analysis. Further more, economic benefits of three schemes are analyzed based on energy measurements. It was shown that the after-tax net profit of the receiving terminal which adds liquid nitrogen to adjust calorific value is 6.17% higher than that which extracts C2+ components under the volume measurement system. Under the system of energy measurement, the after-tax net profit of three processes is respectively increased by 8.96%, 12.51% and 12.47% compared to the original measure modes. The results suggest that the proposed liquid nitrogen injection processes is the most effective one which injects at the exit of high-pressure efflux pump, and an economical way to adjust heat value, which has the highest net profit and the lowest consumption cost and capital cost in the current Chinese LNG industry chain and economic situation.
Article Information

Identifiers and Pagination:
Year: 2016Volume: 9
First Page: 226
Last Page: 235
Publisher Id: TOPEJ-9-226
DOI: 10.2174/1874834101609010226
Article History:
Received Date: 02/02/2016Revision Received Date: 08/06/2016
Acceptance Date: 29/06/2016
Electronic publication date: 29/11/2016
Collection year: 2016
open-access license: This is an open access article licensed under the terms of the Creative Commons Attribution-Non-Commercial 4.0 International Public License (CC BY-NC 4.0) (https://creativecommons.org/licenses/by-nc/4.0/legalcode), which permits unrestricted, non-commercial use, distribution and reproduction in any medium, provided the work is properly cited.
* Address correspondence to this author at the School of Petroleum and Nature Gas Engineering of Southwest Petroleum University, Chengdu 610500, Sichuan Province, China; Tel/Fax: +008618328068160; E-mails: wstq m@163.com, 359971021@qq.com
| Open Peer Review Details | |||
|---|---|---|---|
| Manuscript submitted on 02-02-2016 |
Original Manuscript | Study and Economic Evaluation on the Process of Calorific Value Adjustment in the LNG Receiving Terminal | |
1. INTRODUCTION AND BACKGROUND
Natural gas (NG), which contains methane, ethane, propane and other hydrocarbons and nitrogen, carbon dioxide and other non-hydrocarbon components, is a kind of mixed gas. The composition of liquefied natural gas (LNG) from different producing areas may vary slightly [1W. Xinhong, LNG fundamentals., Petroleum Industry Press: Beijing, 2014.]. In some countries’ LNG may have much “heavy hydrocarbons components”. The mole fraction of ethane is up to 9 mol% and C2+ components is up to 12 mol%, such as Australia, Qatar, Algeria and other regions [2Z. Yanyu, LNG Receiving Terminal NGL Recovery Process Research, Southwest Petroleum University: Chengdu, ON, China, 2015.]. Due to the differences in the composition, the energy generated by the same volume of gas is also different. For example, the minimum volume calorific value of American NG (according to the statistics from 26 cities) was 36.1 MJ/m3(s), and the maximum was 45 MJ/m3(s). The difference between them was up to 24.6% [3Y. Xuhui, "Energy measurement system of natural gas", In: 7th Chinese Industrial General and Automation Academic Conference, China, 2006, pp. 179-180.]. The minimum volume calorific value of China's NG was 33.9 MJ/m3(s), and the maximum was 45 MJ/m3(s). The difference between them reached to 31% [4W. Chi, L. Chunhui, W. Jingan, and L. Tao, "The system and method for energy measurement of natural gas", Acta Meteorol. Sin., vol. 29, no. 5, pp. 403-406, 2008.]. The core commercial value of NG is its inclusive caloricity as a gas fuel. While the gas price dispute caused by volume calculating can be eliminated by caloricity promoting.
At present, the general international LNG trade is based on energy measurement, while China's domestic NG and LNG trade is still based on the volume measurement. As imported LNG’s calorific value is much higher than that of the domestic NG the calorific value shoud be changed to reduce the industrial cost and prevent the energy waste. In other words, it is unreasonable for commercial NG to gage volume and the calorific value of gas is not full used in China. Since China has not yet made full and complete research on calorific value adjustment in the process of LNG receiving terminal. Moreover, heat value adjusting device was not industrialized in China’s receiving terminal [5H. Chao, S. Tongqiang, Y. Guangyuan, L. Qingsheng, and H. Meng, "Study on strategies of calorific value adjustment in the LNG terminal", Chemical Engineering of Oil & Gas, vol. 44, no. 4, pp. 50-53, 2015.]. Therefore, this paper takes a certain typical LNG receiving terminal as an example, puts forward three schemes containing the light hydrocarbon (LH) recovery, nitrogen gas injection(NI Plan A) and liquid nitrogen injection (NI Plan B) to adjust gas calorific value. The process’s parameters were ascertained, and economic benefits were also analyzed according to the software simulation results from three kinds of processes. All the work can provide references to the utilization for calorific value adjustment system in LNG receiving terminal.
2. NECESSITY AND METHOD OF CALORIFIC VALUE ADJUSTMENT
The vaporization capacity of one typical LNG receiving terminals is 100×104 t/a. LNG can be supplied through network to downstream users in NG pipelines after being evaporated. Their feedstock of LNG is from Papua New Guinea. Downstream NG in pipeline network mainly comes from the Daniudi Gas Field in Ordos Basin, and through the Ji'nan- Yulin gas pipeline. LNG receiving terminals must complied with strict requirements on send-out gas characteristics, including composition, calorific value, Wobbe index and quality, in order to satisfy the customers’ specific needs [6Y. Cici, and B. Geoffrey, "Maximising the value of surplus ethane and cost effective design to handle rich LNG", In: 15th International Conference and Exhibition on Liquefied Natural Gas, Barcelona, Spain, 2007.]. The typical parameters of NG in LNG receiving terminal and downstream NG pipeline are shown in Tables 1 and 2.

The data in Tables 1 and 2 shows that calorific value and Wobbe index of commercial NG from LNG receiving terminals are both higher than that from downstream NG pipeline network, exceeding 7.19% and 4.98% respectively. Two major problems will be caused, in view of the NG users and cost-effective operation for receiving terminal.
2.1. The Issue of Interchangeability of Gas
Wobbe index is a common method to determine the interchangeability of two kinds of gas in China and other countries. GB/T 13611-2006 “Town Gas Classification and Basic Characteristic” in China indicates that Wobbe index range within ±5% can justify the interchangeability for two kinds of gas. However, Yangjun Zhang and other scholars [7Z. Yangjun, Q. Chaokui, and L. Pengjun, "Discussion on LNG interchangeability and natural gas quality management in China", Chemical Engineering of Oil & Gas, vol. 41, no. 2, pp. 219-222, 2012.] from the Tongji university had tested the interchangeability for two kinds of gas through the experiment and discovered that it is inaccuracy for that “the range within ±5% can satisfy gas interchangeability for two kinds of gas”. Therefore, in order to realize the interchangeability between the commercial gas from LNG terminal station and the NG in downstream pipeline network, rectify the range of calorific value to ±3% in this paper is advised, which requires the Wobbe index range from 49.29 to 52.33 MJ/m3(s).It is obvious that the commercial NG from this LNG receiving terminal does not meet the requirements of interchangeability. And some safety accident will made such as gas unlighted in downstream users.
2.2. Economic Problems
On August 1st, 2009, a new national standard named “Natural Gas Energy Determination” was carried out in China, marked that Chinese current measurement system has gradually been re-structured from the volume to energy method. Meanwhile, large quantities regulations and law systems were established in order to uniform the standard of gas calorific value metering, and create greater economic benefits for countries. For example, supposed that the annual turnover of commercial NG is 1.22×10⁷ m3(s) in this LNG receiving terminal, average gas calorific value is 36.72 MJ/m3(s) in China. The price of commercial NG metered by volume is 2.4 RMB/m3(s), 0.0654 RMB/MJ by energy. As a result, the annual sales for commercial NG metered by volume is 2.93 billion RMB (about $450 million), and 3.41 billion RMB by energy (about $477 million) in this LNG receiving terminal. It is clear that the loss reached to 480 million RMB (about $73 million) per year owing to the unreasonable way of measurement. If the vaporized LNG from receiving terminal flows into the downstream NG network and be sold at the current price to commercial users, it would be obviously unfair for customers who use the calorific value of gas. The commercial NG price changed from volume measurement to energy measurement is shown in Table 3.
Table 3 shows that, after measured by energy, the difference price ratio between receiving terminal and pipeline gas is up to 7.31%. Calculated in accordance with above assumptions, the difference for annual sales between receiving terminal and pipeline gas is up to 180 million RMB (about $27 million).
Therefore, it is significant to study calorific value adjustment process so as to ensure efficient operations for LNG receiving terminal and satisfy the requirements of interchangeability for downstream NG in China.
LNG is similar to the NG on the process of adjusting calorific value. It contains C2+ recovery method and gas mixed method. C2+recovery method is to extract lighter liquid hydrocarbons (ethane and propane) from LNG, and it is generally called light hydrocarbons (LH) recovery in China. The LH fractions can be sold as a refinery feedstock, whereas the heavier hydrocarbons can be sold as the gasoline-blending feedstock [8M. Saeid, A.P. William, and G.S. James, Handbook of Natural Gas Transmission and Processing., Gulf Publication: Burlington, 2006., 9H.P. Jin, M.S. Khan, R. Andika, M. Getu, A. Bahadori, and M. Lee, "Techno-economic evaluation of a novel NGL recovery scheme with nine patented schemes for offshore applications", Journal of Natural Gas Science and Engineering, vol. 27, pp. 2-17, 2015.
[http://dx.doi.org/10.1016/j.jngse.2014.12.023] ]. This provides a strong economic incentive for recovering these components from the LNG prior to vaporization, with the added benefit of making the resulting gas more compatible with existing gas transmission pipelines by reducing its heating value [10T.C. Kyle, M.H. Hank, and D.W. John, "Economical options for recovering NGL/LPG at LNG receiving terminals", In: 86th Annual Convention of the Gas Processors Association, San Antonio, Texas, 2007.]. This method has been widely used in other countries. C.C. Yang once introduced the light hydrocarbons removal process of adjusting calorific value, and analyzed the economic benefit of this method [11C.C. Yang, K. Al, and H. Zupeng, "Cost-effective design reduces C2 and C3 at LNG receiving terminals", Oil & Gas Journal., vol. 10, no. 5, pp. 50-53, 2003.]. Gas mixed method includes blending the low calorific value gas such as air, nitrogen, liquid nitrogen and multiple source gas. In order to decrease the pipe transportation fees, enterprise usually uses nitrogen injection (NI) method to adjust calorific value in China.
This paper uses LH recovery, NI (Plan A) and NI (Plan B) to adjust LNG calorific value in receiving terminal, considering the rationality and applicability of three systems used in Chinese typical LNG receiving terminal.
3. PROCESS SIMULATION FOR CALORIFIC VALUE ADJUSTMENT
In order to get process energy consumptions and make economic assessments, the simulations of the calorific adjustment systems were carried out by using HYSYS simulator and the Peng-Robinson equation of state for the calculation of thermodynamic properties (ASPENHYSYS V7.1). As can be seen from Behnam Tirandazi’s paper [12T. Behnam, M. Mehdi, V. Ali, and S.M. Ali Moosavian, "Exergy analysis of C2+ recovery plants refrigeration cycles", Chemical Engineering Research & Design, vol. 89, no. 6, pp. 676-689, 2011.
[http://dx.doi.org/10.1016/j.cherd.2010.10.006] ], HYSYS simulator can simulate this kind of process with a high accuracy. Tables 1 and 2 list the feed conditions, composition and the thermodynamic property package used in calculation area. The feed gas, which is relatively rich in heavier components (ethane, propane and higher), was used in the simulation for all the calorific adjustment processes and the feed conditions remained the same.
3.1. Light Hydrocarbons Recovery Process
3.1.1. Process and Parameters Determination
The LNG receiving terminal process which uses LH recovery to adjust calorific value is shown in Fig. (1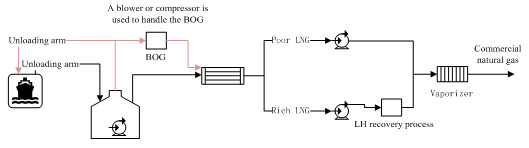 ).
).
 |
Fig. (1) Process chart for LNG receiving terminal which adjusts the calorific value by LH recovery. |
This process has a great improvement based on China’s current measurement system compared to C.C. Yang’s process [11C.C. Yang, K. Al, and H. Zupeng, "Cost-effective design reduces C2 and C3 at LNG receiving terminals", Oil & Gas Journal., vol. 10, no. 5, pp. 50-53, 2003.]. The design uses low-temperature LNG as a cooling intermedia for the demethanizer overhead which ensures an economic separation, and does not require compression devices because it uses LNG as a refrigerant in a direct-contact condenser. LH recovery process can be divided into four parts: feedstock preheating, pre-separation, demethanization and deethanization.
3.1.1.1. Feedstock Preheating
The feed-in LNG(-147.6 °C, 0.8 MPa) from the low-pressure pump in storage tank flows into the LNG booster pump and its pressure reaches 1.85 MPa. Firstly, feed-in LNG transfers heat with methane which is separated by flash tank in the demethanizer flash condenser. Secondly, it transfers heat with methane which is separated by demethanizer in the demethanizer overhead condenser. That leads a increase of LNG temperature and partly gasified gas.
3.1.1.2. LH Pre-separation
After preheated, the LNG flows into flash tank for pre-separation. Methane gas which separated from the top of the flash tank is totally liquefied after being cooled in the flash steam condensate tank and condensate pump. Some of them feed into the demethanizer to take off methane. And the rest feed goes into the overhead condensate tank. The discharge stream from the bottom of flash tank column remains a part of the methane. So it is transported to demethanizer to have further separation through the demethanizer feed pump.
3.1.1.3. Demethanization
LNG feeds into the demethanizer after preliminary separation. In the demethanizer, most methane contents will be separated from the top of the column and flows into the overhead condensate tank after totally liquefied for heat transfer with feed-in LNG. The liquefied methane transported to the LNG high-pressure pump to gather pressure to 6.85 MPa and then flows into the vaporizer. In the vaporizer, the LNG will be gasified by sea water or fuel, and its outer transportation pressure reaches 6 MPa, temperature of which reaches 5 °C. Besides, the liquid component from the bottom of the demethanizer is transported to deethanizer for further separation because it contains ethane, propane and a small amount of C4+ component.
3.1.1.4. Deethanization
The liquid content from the bottom of the demethanizer column flows into the deethanizer by self-pressuring. And the liquid of which component contains more than 90 mol% methane increases pressure to 3.23 MPa through the demethanizer stage reflux pump. Then it is divided into three parts: 54% of which flows into the deethanizer; 4% flows into the demethanizer after heat transfer with the liquid ethane which separated from deethanizer reflux accumulator in the C2 subcooler of deethanizer; the rest of 42% flows into the demethanizer after heat transfer with the liquid ethane which separated from the top of the deethanizer in the overhead condenser of deethanizer.
By means of distillation columns, the high-purified liquid ethane products under ordinary pressure are obtained in the top of the deethanizer. And then feed them into the deethanizer reflux accumulator before heat transfer in the deethanizer overhead condenser. Furthermore, part of them returns to the deethanizer to be used as the liquid back flow through deethanizer reflux pump. Another part of the ethane products flows into C2 storage tank after heat transfer in the C2 subcooler of deethanizer. And their pressure reached to 1.5 MPa. With the temperature to -20 °C. Finally, the liquid containing propane, butane and C3+ hydrocarbon which separated from the bottom of deethanizer is throttled and decompressed to1.5 MPa and -20 °C before flows into the LPG storage tank.
3.1.2. Simulation Results
The LNG process is shown in Fig. (2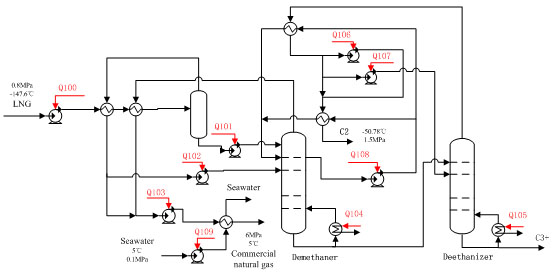 ).
).

According to the simulation results, the Wobbe index of feed-in LNG decreases from 53.34 MJ/m3(s) to 51.86 MJ/m3(s). It can meet the requirements of Wobbe index range of interchangeability. The productivity data of this process is: 1.1365×10⁹ m3(s)/a NG products, 7.6028×10⁴ t/a ethane products,5.5457×104 t/a LPG products. Total energy flux is 7932.14 kW. Gas consumption for devices (the fuel gas comes from the NG products) is 4.626×10⁶ m3(s)/a. The molar composition of commercial NG is: 93.98 mol% C1, 3.93 mol % C2, 1.30 mol % C3, 0.24 mol % i-C4, 0.27 mol % n-C4, 0.03 mol % i-C5, 0.01 mol % n-C5, 0.24 mol % N2. Physical parameters of commercial NG products are shown in Table 4.
3.2. Nitrogen Injection Process
Method of Nitrogen Injection Process to adjust the calorific value is usually concerned as mixing liquid nitrogen and mixing gas nitrogen (medium-pressure nitrogen or high-pressure nitrogen). Mixing liquid nitrogen process requires a self-built cryogenic air separation unit (ASU) in order to produce liquid nitrogen by low-temperature distillation. It is characterized by high requirements of liquid nitrogen production devices and large energy consumption. Mixing medium-pressure nitrogen gas process is to compress the nitrogen and transport it to after-condenser before mixed it with boil off gas (BOG) which is send out by BOG compressor. The mixed gas is condensed in the after-condenser and then be send out to costumers through high-pressure pump and finally goes into vaporizer. The characteristics of this process are high operating pressure for after-condenser, compression devices requirement, high investments and running expenses for receiving terminal. Mixing high pressure nitrogen gas process means that nitrogen is mixed with vaporized LNG after compressed to gas pipeline network pressure. Its advantage is the disuse of the operating pressure and the load of after-condenser. Consequently, this paper uses mixed high pressure nitrogen gas (NI Plan A) and liquid nitrogen (NI Plan B) process to adjust LNG calorific value.
Nitrogen gas and liquid nitrogen injection point can be set in: 1) the entrance of high-pressure efflux pump; 2) the exit of high-pressure efflux pump; 3) the exit of vaporizer. Liquid nitrogen at the injection point 1) (-147.6 °C, 0.8 MPa) and the injection point 2) (-11.96 °C, 6 MPa) are all gaseous. Nitrogen gas injection in these two points might go against the BOG after-condenser and lead to unstable BOG compressor operation. And it is likely to cause efflux pump cavitation. In addition, according to the simulation data, the cost and energy consumption of the nitrogen gas injection point 2) and 3) are approximate, and the required nitrogen gas injection ratio both are about 3.79 t N2/100 t LNG. Therefore, the nitrogen gas injection process which inject nitrogen in point 2) (Plan A) and the liquid nitrogen injection process which inject nitrogen in point 3) (Plan B) was analyzed in this part. Adjusting calorific value processes of LNG by NI method are shown in Figs. (3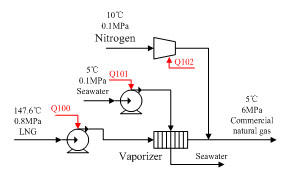 and 4
and 4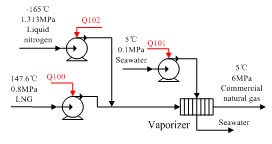 ).
).
 |
Fig. (3) HYSYS simulation chart for NI (plan A) process. Q100~Q102 indicate energy flux of each device. Their values are respectively 561.9 kW, 937.8 kW and 1625 kW. |
 |
Fig. (4) HYSYS simulation chart for NI (plan B) process. Q100~Q102 indicate energy flux of each device. Their values respectively are 21.76 kW, 1041 kW and 561.9 kW. |
According to the simulation results, the Wobbe index of feed-in LNG decreases from 53.34 MJ/m3(s) to 50.81 MJ/m3(s). It can meet the requirements of Wobbe index range of interchangeability either. The productivity data of this process is: 1.2701×10⁹ m3(s)/a NG products; Total energy flux is 3124.7 kW; Gas consumption for devices (the fuel gas comes from NG products) is 2.298×10⁶ m3(s)/a; Nitrogen consumption is 4.85×10⁷ m3(s)/a. The molar composition of commercial NG is: 84.18 mol % C1, 7.77 mol % C2, 2.81 mol % C3, 0.53 mol % i-C4, 0.59 mol % n-C4, 0.07 mol % i-C5, 0.03 mol % n-C5, 3.99 mol % N2 and 0.04 mol % O2. Physical parameters of commercial NG products are shown in Table 5.
According to the simulation results, the change of feed-in LNG Wobbe index of plan B is the same as that of the plan A, and it can also meet the requirements of the Wobbe index range for interchangeability. The productivity data of this process is: 1.2701×10⁹ m3(s)/a NG products; Total energy flux is 1624.66 kW; Gas consumption for devices is 9.669×10⁵ m3(s)/a; Liquid nitrogen consumption is 5.75×10⁷ m3(s)/a; The molar composition of commercial NG of plan B is the same as that of the plan A (Table 5).
4. ECONOMIC BENEFIT ASSESSMENT
Net profit analysis is the major task for economic assessment for calorific value adjustment process. Net profit refers to the remaining income when relevant costs, taxes and fees have been paid. Generally, it is also called as the after-tax profits or net margin. The computational formula of net profit is that net profit is equal to total profit minus profit tax. Net profit is an evaluation index for enterprises. In other words, the higher the net profits are, the better benefit for a company's operation is.
The total profit of calorific value adjustment process in LNG receiving terminal is equally to product sales revenue minus process investment costs. Process investment costs mainly consist of equipment costs, fuel thermal costs and electric energy costs for equipment running, while the fuel thermal is provided by NG products. Consequently, the net profit of LNG receiving terminal which adjusts calorific value respectively by LH recovery, NI Plan A and NI Plan B are shown in Table 6.

Note that the sales price of civil NG product is 2.40RMB/m3(s); The LPG product sales price is 3300 RMB/t. Ethane has a limited market in China and to form an industry chain for ethane has complicated factors, so the paper ignores the sales of ethane products temporarily. Electricity price of great industry in located province is 0.7216 RMB/kW×h; In China, the business tax rate of receiving terminal is 3% and enterprise profit tax rate is 25%. All the data are used during the calculation.
The capital cost for considered processes Table 6 was calculated by estimating the price of major equipment such as heat exchanger, vessel, distillation column, reboiler and condenser. The price estimation was done by considering equipment material, type, and size using the correlations available in the reference [13D.S. Warren, J.D. Seader, and R.L. Daniel, Product and Process Design Principles-synthesis, Analysis, and Evaluation., Wiley: Hoboken, 2010.]. The parameters considered for each equipment are listed below [9H.P. Jin, M.S. Khan, R. Andika, M. Getu, A. Bahadori, and M. Lee, "Techno-economic evaluation of a novel NGL recovery scheme with nine patented schemes for offshore applications", Journal of Natural Gas Science and Engineering, vol. 27, pp. 2-17, 2015.
[http://dx.doi.org/10.1016/j.jngse.2014.12.023] ]:
- Heat exchanger: Shell and tube material, design type, design pressure, heat exchanger area and overall heat transfer coefficient (U).
- Vessel, distillation column, and reactor: Shell material, design pressure, diameter, and height.
- Column tray: Tray type, tray material, tray spacing, diameter, and tray stack height.
- Reboiler: Steam type, output temperature, overall heat transfer coefficient (U), duty, shell and tube material, reboiler type, and design pressure.
- Condenser: Cooler temperature, output temperature, overall heat transfer coefficient (U), duty, shell and tube material, condenser type, and design pressure.
Meanwhile, the capital cost was calculated by considering equipment duty (steam and electricity) [9H.P. Jin, M.S. Khan, R. Andika, M. Getu, A. Bahadori, and M. Lee, "Techno-economic evaluation of a novel NGL recovery scheme with nine patented schemes for offshore applications", Journal of Natural Gas Science and Engineering, vol. 27, pp. 2-17, 2015.
[http://dx.doi.org/10.1016/j.jngse.2014.12.023] ]. In a result, investment costs for LH recovery equipment are about 4.106 million RMB (about $62,450,000), for NI (Plan A) are about 2.721 million RMB (about $41,390,000), and for NI (Plan B) are about 1.937 million RMB (about $29,442,400).
5. RESULTS AND DISCUSSIONS
The data in Table 6 shows that, light hydrocarbons (LH) recovery process is higher than the nitrogen gas injection (NI Plan A) and liquid nitrogen injection (NI Plan B) process on fuel cost and power cost. LH can be extracted by using of feed LNG’s cold energy, which in favor of low heat duty, is reasonable usage for cold energy and comprehensive utilization for gas resources. However, it is nearly two times higher than that of the Plan A and Plan B on total process consumption cost respectively, and LH process has the lowest after-tax profit.
In most countries in Europe and America, the heat value of LNG is regulated by LH recovery method. Its ethane and LPG product can replace naphtha to produce ethylene and have significant economic values derivable from the recovered LPGs. According to above-mentioned analysis, the economic values for proposed LH recovery process related to feed-in LNG’s components and the difference between LPG price and NG price. And current situation of LNG industry and economic situation in China determines these two factors. Counting on China’s LNG receiving station feed components from statistics, this paper analyses the applicability of the proposed LH recovery process in LNG receiving station considered with the price fluctuation of LPG and NG in China. Fig. (5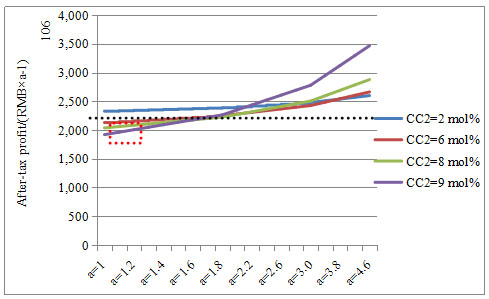 ) shows that the after-tax net profit changes with feed-in LNG’s components and the difference between LPG price and NG price for proposed LH recovery process.

Fig. (5) indicates that LNG terminal station received lighter LNG (CC2≤2 mol%) can bring better returns when LPG and NG prices are similar (a=1~2.3). On the other hand, LNG terminal station received heavier LNG (CC2≥6 mol %) can bring great economic value when there is large difference in LPG price and NG price (a≥2.3). Only if the mole concentration of C2 in feed-in LNG is less than 2 mol% and 2 times of LPG price over NG price at the same time, or just as LPG price is 2 times higher than NG price, the economic benefits for Chinese LNG receiving station using proposed LH recovery process is higher than that using NI (Plan B) process to adjust the calorific value. In the other words, in the fluctuation range of LNG feed component in China, the wider price gap between LH and downstream NG is, the greater economic values will bring. However, within the current range of China's typical LNG feed component (CC2 =4~8 mol %) and price ratio between LPG and NG (a=0.8~1.3), the highest of after-tax net profit is 2189.13×106 RMB/a for LH recovery process which is still lower than that of the Plan B.
Besides, based on an overall consideration of various factors, such as receiving terminal location and presenting situation of ethylene industry chain in China, the yield of ethane and LPG byproducts are altogether 13.15×10⁴ t/a, and it will be difficult to form ethane for downstream industry chain in local. Furthermore, there are other limits, such as complex process compared to NI, poor flexibility, difficulty of ensuring the stable operation and peak adjusting ability of gas fluctuation in downstream users, and higher process costs consumption (44.60 ×10⁶ RMB×a) compared to NI (9.08×10⁶ RMB×a). Therefore, it is not recommended that the LNG receiving station adopts the LH recovery process to adjust LNG calorific value considering current LNG industry situation and economic situation in China.
Contrary to the LH recovery process, NI Plan A and Plan B both have low consumption costs. Plan B has the lowest fuel costs and electricity costs to adjust LNG calorific value in LNG receiving station. Even if the LPG product obtained in the LH recovery process can increase additional income, the product sales of NI (Plan B) is still higher than that of the LH recovery process. Moreover, after-tax net profit of NI(Plan B) is the highest. In conclusion, under the current volume measurement system, it is suggested that LNG receiving station adopts NI Plan B process to adjust calorific value.
Under the energy measurement system, assumed that the price of NG is calculated by 0.0654 RMB/MJ. As a result, the after-tax net profit for LH recovery is 2267.30×106 RMB/a (about $ 345.5 million/a), for NI (plan A) is 2477.93×106 RMB/a (about $ 377.6 million/a) and for NI (plan B) is 2484.82×106 RMB/a (about $ 378.7 million/a). The net profit of three processes increases by 8.96%, 12.51% and 12.47% respectively compared to volume measurement. Consequently, when china’s measurement system converted volume into energy, it will be better to adjust calorific value through NI (Plan B) process for Plan B to get the highest net profit and lowest consumption cost and capital cost.
CONCLUSION
This paper analyzes the profits for LH recovery, NI Plan A and NI Plan B processes based on HYSYS simulation data. The results show that, for LNG receiving terminal, all the processes can reach the downstream users’ requirements for interchangeability. The specific results of the three processes are as follows.
1) LH recovery process is more complex, poor flexibility than NI process, and much higher than NI on consumption costs. The ethane products obtained by LH recovery process could not be utilized efficiently in China’s current LNG chain. Within the current range of China's typical LNG feed component (CC2 =4~8 mol %) and the price ratio between LPG and NG (a=0.8~1.3), the highest of after-tax net profit reaches 2189.13×106 RMB/a for LH recovery process which is still lower than that of the Plan B.
2) In view of NI process, the net profit for two injecting positions (the exit of high-pressure efflux pump and vaporizer) are approximately, and the required nitrogen gas injection ratio both are about 3.79 t N2/100 t LNG. The after-tax profit of the NI (Plan B) is 0.31% higher than that of the NI (Plan A). The liquid nitrogen injection point should be designed at the exit of high-pressure efflux pump for NI (Plan B), and the required liquid nitrogen injection ratio is about 5.99 t LN2/100 t LNG.
3) Under the volume measurement system, it is suggested that LNG receiving terminal adopts NI (Plan B) to adjust calorific value as the after-tax net profit of it is 6.17% higher than that of the LH recovery process.
4) Under the energy measurement system, the after-tax net profit of LH recovery and NI processes (Plan A and B) increases by 8.96%, 12.51% and 12.47% respectively compared to meter in volume. Consequently, when china’s measurement system converted volume into energy, it will be better to adjust calorific value through NI (Plan B) process either for Plan B has the highest net profit and the lowest consumption cost and capital cost.
CONFLICT OF INTEREST
The authors confirm that this article content has no conflict of interest.
ACKNOWLEDGEMENTS
We would appreciate Hongfang Lu and Fei Xiao for their useful suggestions. We are also grateful to two reviewers for critical review and constructive comments of the manuscript. We also thank authors whose publications haven’t been listed in the references. The work is jointly supported by Measurement Research Center of Natural Gas Company of Sinopec of China (No. 35150017-158-ZC0611-0001).
REFERENCES
| [1] | W. Xinhong, LNG fundamentals., Petroleum Industry Press: Beijing, 2014. |
| [2] | Z. Yanyu, LNG Receiving Terminal NGL Recovery Process Research, Southwest Petroleum University: Chengdu, ON, China, 2015. |
| [3] | Y. Xuhui, "Energy measurement system of natural gas", In: 7th Chinese Industrial General and Automation Academic Conference, China, 2006, pp. 179-180. |
| [4] | W. Chi, L. Chunhui, W. Jingan, and L. Tao, "The system and method for energy measurement of natural gas", Acta Meteorol. Sin., vol. 29, no. 5, pp. 403-406, 2008. |
| [5] | H. Chao, S. Tongqiang, Y. Guangyuan, L. Qingsheng, and H. Meng, "Study on strategies of calorific value adjustment in the LNG terminal", Chemical Engineering of Oil & Gas, vol. 44, no. 4, pp. 50-53, 2015. |
| [6] | Y. Cici, and B. Geoffrey, "Maximising the value of surplus ethane and cost effective design to handle rich LNG", In: 15th International Conference and Exhibition on Liquefied Natural Gas, Barcelona, Spain, 2007. |
| [7] | Z. Yangjun, Q. Chaokui, and L. Pengjun, "Discussion on LNG interchangeability and natural gas quality management in China", Chemical Engineering of Oil & Gas, vol. 41, no. 2, pp. 219-222, 2012. |
| [8] | M. Saeid, A.P. William, and G.S. James, Handbook of Natural Gas Transmission and Processing., Gulf Publication: Burlington, 2006. |
| [9] | H.P. Jin, M.S. Khan, R. Andika, M. Getu, A. Bahadori, and M. Lee, "Techno-economic evaluation of a novel NGL recovery scheme with nine patented schemes for offshore applications", Journal of Natural Gas Science and Engineering, vol. 27, pp. 2-17, 2015. [http://dx.doi.org/10.1016/j.jngse.2014.12.023] |
| [10] | T.C. Kyle, M.H. Hank, and D.W. John, "Economical options for recovering NGL/LPG at LNG receiving terminals", In: 86th Annual Convention of the Gas Processors Association, San Antonio, Texas, 2007. |
| [11] | C.C. Yang, K. Al, and H. Zupeng, "Cost-effective design reduces C2 and C3 at LNG receiving terminals", Oil & Gas Journal., vol. 10, no. 5, pp. 50-53, 2003. |
| [12] | T. Behnam, M. Mehdi, V. Ali, and S.M. Ali Moosavian, "Exergy analysis of C2+ recovery plants refrigeration cycles", Chemical Engineering Research & Design, vol. 89, no. 6, pp. 676-689, 2011. [http://dx.doi.org/10.1016/j.cherd.2010.10.006] |
| [13] | D.S. Warren, J.D. Seader, and R.L. Daniel, Product and Process Design Principles-synthesis, Analysis, and Evaluation., Wiley: Hoboken, 2010. |