- Home
- About Journals
-
Information for Authors/ReviewersEditorial Policies
Publication Fee
Publication Cycle - Process Flowchart
Online Manuscript Submission and Tracking System
Publishing Ethics and Rectitude
Authorship
Author Benefits
Reviewer Guidelines
Guest Editor Guidelines
Peer Review Workflow
Quick Track Option
Copyediting Services
Bentham Open Membership
Bentham Open Advisory Board
Archiving Policies
Fabricating and Stating False Information
Post Publication Discussions and Corrections
Editorial Management
Advertise With Us
Funding Agencies
Rate List
Kudos
General FAQs
Special Fee Waivers and Discounts
- Contact
- Help
- About Us
- Search


Current Chemical Genomics and Translational Medicine
(Discontinued)
ISSN: 2213-9885 ― Volume 12, 2018
Phenotypic Fingerprinting of Small Molecule Cell Cycle Kinase Inhibitors for Drug Discovery
Jonathan Low1, Arunava Chakravartty2, Wayne Blosser1, Michele Dowless1, Christopher Chalfant3, Patty Bragger3, Louis Stancato*, 1
Abstract
Phenotypic drug discovery, primarily abandoned in the 1980’s in favor of targeted approaches to drug development, is once again demonstrating its value when used in conjunction with new technologies. Phenotypic discovery has been brought back to the fore mainly due to recent advances in the field of high content imaging (HCI). HCI elucidates cellular responses using a combination of immunofluorescent assays and computer analysis which increase both the sensitivity and throughput of phenotypic assays. Although HCI data characterize cellular responses in individual cells, these data are usually analyzed as an aggregate of the treated population and are unable to discern differentially responsive subpopulations. A collection of 44 kinase inhibitors affecting cell cycle and apoptosis were characterized with a number of univariate, bivariate, and multivariate subpopulation analyses demonstrating that each level of complexity adds additional information about the treated populations and often distinguishes between compounds with seemingly similar mechanisms of action. Finally, these subpopulation data were used to characterize compounds as they relate in chemical space.
Article Information
Identifiers and Pagination:
Year: 2009Volume: 3
First Page: 13
Last Page: 21
Publisher Id: CCGTM-3-13
DOI: 10.2174/1875397300903010013
Article History:
Received Date: 21/10/2008Revision Received Date: 02/12/2008
Acceptance Date: 04/12/2008
Electronic publication date: 24/3/2009
Collection year: 2009
open-access license: This is an open access article distributed under the terms of the Creative Commons Attribution License (http://creativecommons.org/licenses/by/2.5/), which permits unrestrictive use, distribution, and reproduction in any medium, provided the original work is properly cited.
* Address correspondence to this author at the Cancer Growth and Translational Genetics Lilly Corporate Center Bldg. 98C, DC0434 Indianapolis, IN 46285, USA; Tel: 317-655-6910; Fax: 317-276-1414; E-mail: stancato_louis@lilly.com
| Open Peer Review Details | |||
|---|---|---|---|
| Manuscript submitted on 21-10-2008 |
Original Manuscript | Phenotypic Fingerprinting of Small Molecule Cell Cycle Kinase Inhibitors for Drug Discovery | |
INTRODUCTION
As the pharmaceutical industry nears the end of its first decade in the 21st century new technologies integrate into old paradigms to develop useful drugs in an increasingly crowded marketplace. At the heart of the pharmaceutical industry is the efficient screening of compound libraries to find molecules with a desired effect while limiting the number of complications. In the past, the majority of these assays were performed using target-based screens to detect molecules of interest by their effects on specific cellular targets. Combinatorial chemistry then modified these compounds into “drug-like” forms with the promise of greater potency and fewer side effects. While this approach has proven somewhat successful, it has done so in an often expensive and inefficient way and is therefore clearly unsustainable. Approaches to targeted drug discovery therefore must be employed. In the last decade phenotypic drug discovery (PDD), which measures compound effects based upon changes in cellular morphology, has been used increasingly in conjunction with target-based assays to derive additional information about how compound libraries affect the cell.
The success of modern phenotypic screens is due to the adaptation of HCI to drug discovery, combining computer-driven detection and analysis with immunofluorescent techniques to better characterize cellular phenotypes in response to treatment [1Lang P, Yeow K, Nichols A, Scheer A. Cellular imaging in drug discovery Nat Rev Drug Discov 2006; 5: 343-56.]. The integration of phenotypic and target-based discovery should speed up the discovery process, allowing earlier decisions on molecules of potential interest prior to lengthy development. This synergy decreases the overhead necessary to develop a series of molecules and streamlines the discovery process [2Low J, Stancato L, Lee J, Sutherland JJ. Prioritizing hits from phenotypic high-content screens Curr Opin Drug Discov Devel 2008; 11: 338-45.]. For example, although a target-based screen frequently determines the potency of a molecule against one target, and often ignores its activity against others, a phenotypic screen generates additional data about that molecule which would otherwise be missed [3Loo LH, Wu LF, Altschuler SJ. Image-based multivariate profiling of drug responses from single cells Nat Methods 2007; 4: 445-53.]. For instance compounds with high levels of toxicity may have previously progressed to animal models due to their strong effects against one specific target. With the addition of HCI cell-based assays, however, this toxicity could be detected earlier in the development cycle saving valuable time and resources. In addition, compounds with beneficial “off-target” effects previously missed in target-based screens due to weak activity against a primary target, but with an overall greater phenotypic effect, may be discovered earlier and brought forward as appropriate [1Lang P, Yeow K, Nichols A, Scheer A. Cellular imaging in drug discovery Nat Rev Drug Discov 2006; 5: 343-56., 2Low J, Stancato L, Lee J, Sutherland JJ. Prioritizing hits from phenotypic high-content screens Curr Opin Drug Discov Devel 2008; 11: 338-45.].
One of the most powerful, yet frequently overlooked, features of HCI is the individualized characterization of each cell, and the subsequent assembly of those individual data points into distinct populations. The data obtained from each cell are therefore not viewed in isolation, but rather each cell becomes part of a newly characterized subpopulation [4Low J, Huang S, Blosser W, et al. High-content imaging characterization of cell cycle therapeutics through in vitro and in vivo subpopulation analysis Mol Cancer Ther 2008; 7: 2455-63.]. In addition, HCI can easily multiplex divergent immunofluorescent assays to further resolve how a treatment affects multiple aspects of cell biology. The use of these subpopulations, rather than reading the average response of the whole treated population, becomes even more important when dealing with molecules affecting several targets where multiple subpopulations often shift in response in a concentration dependent fashion.
Two common phenotypic assays are those for cell cycle arrest and apoptosis [5Inglefield JR, Larson CJ, Gibson SJ, Lebrec H, Miller RL. Apoptotic responses in squamous carcinoma and epithelial cells to small-molecule toll-like receptor agonists evaluated with automated cytometry J Biomol Screen 2006; 11: 575-85., 6Barabasz A, Foley B, Otto JC, Scott A, Rice J. The use of high-content screening for the discovery and characterization of compounds that modulate mitotic index and cell cycle progression by differing mechanisms of action Assay Drug Dev Technol 2006; 4: 153-63.]. The obvious phenotypic changes that occur in both of these processes generate distinctive morphologies, and are highly amenable to HCI analysis and categorization. When used together these assays distinguish populations of cells that may differ in response to compound treatment due to genotype, cell cycle position, or other niche.
Here we describe a multi-parameter assay including both cell cycle and apoptotic components. This assay was used to screen a library of commercially available cellular modulators leading to cell cycle arrest in the presence or absence of detectable apoptosis. We demonstrate the differential effects of many of these compounds and display the phenotypic fingerprints for each type of cell cycle arrest. Complex multiparameter fingerprints are then linked to similar classes of molecules. Finally we show that the fingerprint data obtained from single cells can be used to classify treatments based upon their phenotypic properties. The combination of these approaches creates an overreaching view of the targeted biology that removes many issues frequently associated with data generated from total population reads and opens up possibilities for the use of targeted agents against multiple simultaneous biologies.
MATERIALS AND METHODS
Cell Culture and Compound Treatment
HCT 116 and HeLa cells were grown according to ATCC guidelines. For the assays described below, adherent cells were plated onto poly-D-lysine coated 96-well dishes (BD #356640) at a density of 3,000 cells in 100 µl of media as determined by a Coulter Z2 cell and particle counter. Cells were incubated with compounds in a final concentration of 0.5% DMSO. All compounds were prepared in ten-point curves using two-fold dilutions and a starting concentration of 5 μM. Compound dilutions and additions were performed using a Multimek-96 automated pipettor (Beckmann).
Immunofluorescence
Cells were fixed with 3.7% formaldehyde for 20 minutes at 37°C and permeabilized with 0.1% Triton-X 100 for 10 minutes at 25°C. All following dilutions were performed in PBS at 25°C. Fixative was removed and each well washed with PBS. Cells were blocked using 1% Bovine Serum Albumin (BSA) (Invitrogen #15260-037) for 1 hour at 25°C. The primary antibodies against phosphorylated-histone H3 (Upstate Biolabs #06-570) [7Hendzel MJ, Wei Y, Mancini MA, et al. Mitosis-specific phosphorylation of histone H3 initiates primarily within pericentromeric heterochromatin during G2 and spreads in an ordered fashion coincident with mitotic chromosome condensation Chromosoma 1997; 106: 348-60.] and cyclin B1(BD Pharmingen #624086) were diluted in 1% BSA to a final concentration of 5 µg/ml and this mixture added to each well for 1 hour at 25°C. Each well was then washed 3 times with 200 µl of PBS, and incubated for 1 hour at 25°C with a solution containing 5 µg/ml goat α-mouse-Alexa-555 (Molecular Probes #A-21422), 5 µg/ml goat α-rabbit-Alexa-647 (Molecular Probes #A-21244) to detect pHH3, and 200 ng/ml Hoechst 33342 to detect nuclear material (Molecular Probes #21492). TUNEL analysis was then performed using the Roche in situ cell death detection kit with fluorescein (Roche #11 684 795 910) and stored at 4°C until analysis.
Fluorescent Imaging and Statistical Analysis
Cell images were captured using a Cellomics Arrayscan VTI and analyzed with the Target Activation BioApplication reading in 4 channels at a magnification of 10X. Objects were identified using an algorithm to detect nuclear staining with Hoescht dye, and the relative levels and sub-cellular localization of TUNEL, cyclin B1 and pHH3 were determined through the respective intensities and locations of Alexa-488, Alexa-555, and Alexa-647 fluorescence. A minimum of 1000 individual cellular images or 20 fields were captured for each condition. For each cell, along with the intensity from each channel, several additional nuclear features were captured including the total nuclear area, the ratio of the perimeter of the nucleus compared to its area, and the length to width ratio of the nucleus. Arrayscan data were then log2 transformed and analyzed using unsupervised K-means clustering to group subpopulations with similar profiles [8Low J, Huang S, Dowless M, et al. High-content imaging analysis of the knockdown effects of validated siRNAs and antisense oligonucleotides J Biomol Screen 2007; 12: 775-88., 9Venables WN, Ripley BD. Modern Applied Statistics with S. 4th. 2002; p. Springer Press; New York/Heidelberg. 2002; p. 495.]. All populations were compared to asynchronous untreated control populations across all plates. Subpopulation clusters were derived from the entire population of the assay and intensities based on the standard deviation away from the mean of the control population.
RESULTS
Until recently many HCI assays determined a response by observing a single parameter, but as the technology advanced additional parameters were added to show a more complete phenotypic change in treated cells. This method was limited, however, as the phenotypic changes were viewed as an aggregate response of the entire treated population. To demonstrate the usefulness of subpopulation analysis in PDD a collection of 44 well-characterized and commercially available cellular modulators were screened. The data obtained from this screen were then analyzed first using traditional well-level averages (i.e. total population), and then by increasingly complex subpopulation analyses. The initial data generated from the average responses of the treated cells displayed the population’s primary phenotype. To demonstrate this method cells were treated with an inhibitor of PLK1 and four commonly used phenotypic parameters were observed in isolation. PLK1 is an important regulator of centrosome maturation and spindle assembly during the mitotic phase of the cell cycle and is critical for exit from mitosis [10Petronczki M, Lenart P, Peters JM. Polo on the rise-from mitotic entry to cytokinesis with Plk1 Dev Cell 2008; 14: 646-59., 11Taylor S, Peters JM. Polo and Aurora kinases: lessons derived from chemical biology Curr Opin Cell Biol 2008; 20: 77-84.]. In many, but not all, cases a marker was expected to give its strongest response when exposed to the highest concentration of the agent, and to generate a lesser response as the concentration of that agent decreased. When the entire population is observed at the level of the treated well, concentration response curves are one of the standard methods frequently used to characterize a phenotypic effect. For instance TUNEL staining, a measure of apoptosis through the use of DNA end labeling, increases in response to a wide variety of cytotoxic agents (Fig. 1A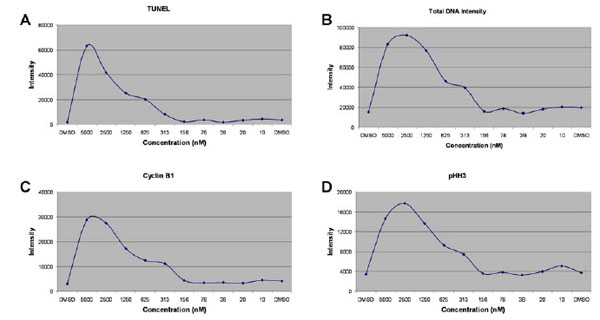 ) [12Gorczyca W, Bigman K, Mittelman A, et al. Induction of DNA strand breaks associated with apoptosis during treatment of leukemias Leukemia 1993; 7(5): 659-70., 13Gold R, Schmied M, Giegerich G, et al. Differentiation between cellular apoptosis and necrosis by the combined use of in situ tail-ing and nick translation techniques Lab Invest 1994; 71: 219-5.]. TUNEL staining alone, while useful for determining induction of apoptosis, does not fully describe the complete phenotype of a treated cell. The addition of DNA intensity shows relative changes in the DNA content of treated cells as they replicate their DNA and suggests when some of these cells may be arrested in specific cell cycle compartments (Fig. 1B). To further define cell cycle position and arrest, the G2/M marker cyclin B1 (Fig. 1C), and the mitotic marker phospo-histone H3 (Fig. 1D) were also used. PHH3 is a marker for chromosomal condensation present in mitosis and promotes the recruitment of condensin, while cyclin B1 activates CDK1 and allows progression through G2 and into mitosis [7Hendzel MJ, Wei Y, Mancini MA, et al. Mitosis-specific phosphorylation of histone H3 initiates primarily within pericentromeric heterochromatin during G2 and spreads in an ordered fashion coincident with mitotic chromosome condensation Chromosoma 1997; 106: 348-60., 14Gurley LR, Walters RA, Barham SS, Deaven LL. Heterochromatin and histone phosphorylation Exp Cell Res 1978; 111: 373-83., 15Datta NS, Williams JL, Caldwell J, Curry AM, Ashcraft EK, Long MW. Novel alterations in CDK1/cyclin B1 kinase complex formation occur during the acquisition of a polyploid DNA content Mol Biol Cell 1996; 7: 209-3.]. The measurement of these four phenotypic parameters illustrate that the highest levels of Total DNA, TUNEL, cyclin B1, and pHH3 are found at the highest concentrations of the tested compound and decrease as less compound is added to the cells. These measurements suggest a mitotic and apoptotic response to inhibition of PLK1 in this assay, but unfortunately, these data do not differentiate between the multiple phenotypes likely present. While successful in showing a general response, this method lacks the resolution necessary to determine effects at the individual cell level.

To characterize individual cellular phenotype response, distribution analyses were performed using the same data obtained from the populations shown above. This method most frequently compares the DNA content of a population of cells, but is applicable to a variety of situations found in HCI. We have previously shown that a log2 transformation of these data reduces the effects of outliers and increases the ease of analysis [8Low J, Huang S, Dowless M, et al. High-content imaging analysis of the knockdown effects of validated siRNAs and antisense oligonucleotides J Biomol Screen 2007; 12: 775-88.]. We therefore applied a log2 transformation to generate more meaningful parameter distributions for Total DNA (Fig. 2A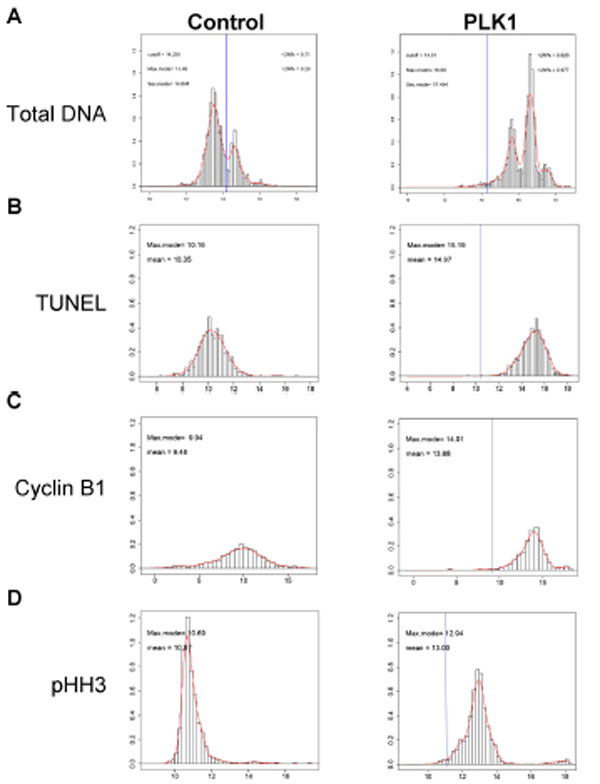 ), TUNEL staining (Fig. 2B), cyclin B1 expression (Fig. 2C), and the presence of pHH3 (Fig. 2D). Theses distributions compare PLK1-inhibitor treated cells with cells treated with DMSO alone. In all cases the distribution analyses illustrate that populations have shifted away from the mean control population (as shown by the vertical blue lines). In the case of DNA intensity, this shift is towards a much higher DNA content containing cells with 4N and 8N DNA. These three populations were averaged together as a 4N+ DNA population when observed at the well level, demonstrating the improved resolution of this technique when applied to HCI. The G2/M marker data shown from the staining of cyclin B1 and pHH3 also demonstrate that there are two distinct expression patterns in the data for each of these markers, but that all of the cells have shifted away from the average shown in the control population. When combined with the total DNA intensity data, these markers show that the population has shifted towards a likely G2/M phenotype. Although the TUNEL staining in these cells presents a uniform distribution, the increase in staining intensity suggests that the G2/M phenotype found upon PLK1 inhibition likely leads to apoptosis. The advantage of these subpopulation analyses is the increased resolution of the entire population which distinguishes populations previously undetected through well-level analysis. Detecting the differential phenotypes shown using these distribution analyses was impossible when using the total population read.
 |
Fig. (2). Distribution analysis of phenotypic parameters distinguish subpopulations Distributions were performed of the individual cellular data for the four phenotypic parameters shown in Fig. (1 |
Although uniparameter distribution analyses detected the population shifts following treatment, we were unable to link cellular parameters together and show that the same cells that had increases in DNA content were also undergoing apoptosis. To more thoroughly examine these subpopulations we used bivariate analyses to combine these parameters in a method similar to that used to display flow cytometry data. These bivariate analyses link parameters from the same cell and demonstrate additional subpopulations that may have been missed in a simpler analysis. The log2 transformed data from the DNA total intensity and TUNEL analysis were compared (Fig. 3A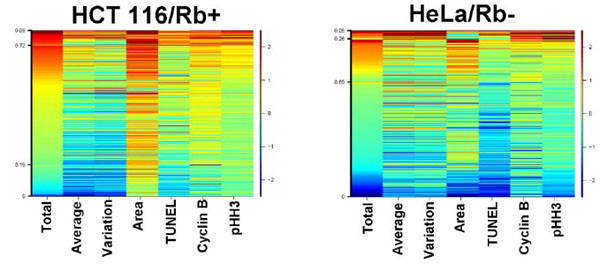 ), while the cyclin B1 and pHH3 data were compared (Fig. 3B). Three subpopulations were again distinguished based on total DNA intensity. The addition of TUNEL staining to this analysis demonstrates that apoptosis occurs across the population, but the greatest apoptotic response lies within those cells with 8N DNA content. The combination of cyclin B1 intensity data with those from pHH3 staining distinguish two populations and demonstrate that the same cells with the greatest expression of cyclin B1 also contain the largest amount of pHH3. The use of these pairwise comparisons to link parameters distinguished additional subpopulations, and further defined the subpopulations detected in the univariate analysis. Although in the case of PLK1 inhibition the subpopulation with 8N DNA content had the highest level of apoptosis, in others it was a different subpopulation with a dissimilar phenotype (depending upon the treatment, its effect on the cell, and the type of cell studied).
 |
Fig. (3). Bivariate analysis of phenotypic parameters further refine subpopulations Distribution analysis data used in Fig. (2 |
To further explore how a variety of compounds affected cell cycle arrest and apoptotic response we continued to analyze the set of 44 targeted cancer compounds currently in clinical development (Table 1). Compounds were selected for this screen for their kinase target specificity in order to generate phenotypic fingerprints. Although many of these compounds generate one specific fingerprint at all concentrations, several of them demonstrate concentration-dependent phenotypic effects resulting in multiple fingerprints, likely due to differing IC50’s against multiple cellular targets. As described above, analysis of these data at the cellular level is crucial to understanding these complex phenotypes in a concentration-dependent setting.
Although a bivariate analysis began to differentiate phenotypes and subpopulations, even greater resolution was required to discern the many varied phenotypes frequently found in a screening setting. Although we were able to link two parameters using a bivariate analysis, generating a new bivariate distribution for every two phenotypic parameters of interest was an unnecessarily complicated procedure. When interested in the overall phenotypic fingerprint of a subpopulation it becomes necessary to use a more refined method of analysis to link multiple parameters into one output. Building upon the bivariate analysis, 7 parameters were combined to obtain a phenotypic fingerprint of treatment effects across all of the cellular subpopulations. Data were extracted from individual cells and used to create clusters of the cellular subpopulations using unsupervised K-means clustering (Fig. 4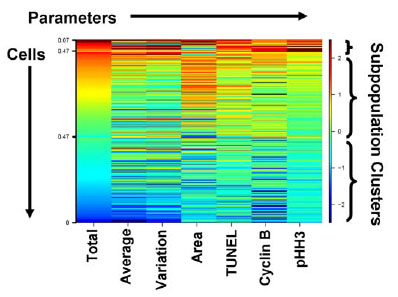 ). The output from this analysis was a heatmap generated by a user-defined number of clusters based upon similarity of cells to each other across all seven parameters (like groups with like). Although a user could request an infinite number of phenotypic clusters, the algorithm limits the output based upon phenotypic similarities present at the population level. If the user defined more clusters than the algorithm could find, the extra clusters contained zero cells. The K-means algorithm determined how the cells cluster based upon the cells in both the control and experimental populations. The colors displayed in the heatmap indicate shifts away from the average of the control population (numbered at right by standard deviations) with shifts to red denoting increases and shifts to blue denoting decreases. In the heatmaps, each row contains the data from one cell, and those cells were sorted in each cluster based upon their total DNA intensity from high to low. The numbers on the left side of each cluster refer to the fraction of the total number of cells in that cluster. One limitation of this technique as an analytical tool is the number of fluorescent channels that can be measured using fluorescent microscopy in conjunction with the subcellular localization of each fluorescent channel. Currently limitations in fluorescent probe technology and the specificity of fluorescent excitation and emission filters impedes our ability to image >4 unique fluorescent probes at any given time, although we can incorporate subcellular localization of the fluorescent probes to increase the number of potentially useful channels for fingerprint development.

To demonstrate the effectiveness of this technique across the cell cycle representative heatmaps were generated for molecules against a number of commonly targeted proteins active in one of the four major cell cycle phases: G1, S, G2, and M (Fig. 5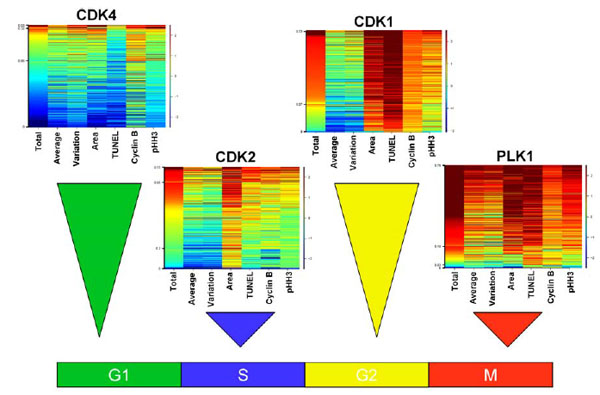 ). Following treatment with an inhibitor of CDK4, HCT-116 cells arrested in the G1 phase of the cell cycle. This arrest was characterized by one predominant cell population having low total, average, and variation of DNA intensity and lacking the G2/M markers cyclin B1 and pHH3. These cells also contained relatively small nuclei consistent with G1 arrest and virtually no apoptotic fraction (as evidenced by a lack of a TUNEL response). The CDK4 G1-arrest phenotype contrasted with that of cells arrested in S phase by an inhibitor of CDK2. In this case the primary subpopulation of cells, while also lacking high levels of cyclin B1 or pHH3, shifted into a new cluster consisting of slightly higher levels of total DNA (consistent with an S phase arrest), but retaining low average and variation of DNA intensity. Inhibitors of CDK1 have yet another phenotype as cells arrested in the G2 phase of the cell cycle. Cells arrested by CDK1 inhibitors exhibited high levels of total DNA and a concomitant increase in nuclear area to hold their 4N DNA content. As these cells were arrested in G2 and unable to progress through mitosis they expressed high levels of the G2/M markers cyclin B1 and pHH3. At the concentration shown, these cells underwent significant apoptosis as demonstrated by their increased TUNEL staining. Finally, cells arrested through inhibition of PLK1 display a mitotic arrest phenotype. Along with the increase in total DNA intensity found in cells arrested with a compound in G2, these cells had smaller nuclei due to the condensation of nuclear material. This condensation caused a corresponding increase in the average and variation of DNA intensity. Not surprisingly the mitotic markers cyclin B1 and pHH3 were at their highest levels in cells arrested in this phase of the cell cycle.

The creation of fingerprints specific to individual cell cycle inhibitors is a powerful tool to dissect cellular responses to compound libraries, and also is useful to detect the varying responses to treatment between cell lines. For example, HCT-116 and HeLa cells were both exposed to an inhibitor of CDK4/6 for 48 hours, and the subpopulations from each treatment yielded distinct fingerprints based on the gene expression patterns in each line (Fig. 6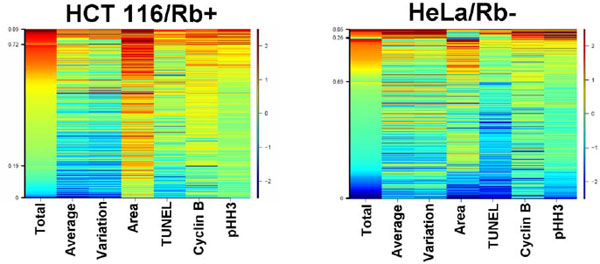 ). The HCT-116 cells were arrested primarily in S phase as shown by their DNA content, nuclear area, and low cyclin B1 and pHH3 expression, while the HeLa cells remained unaffected when compared to a control population. This differential effect is due to the pRb status of each cell line and how it relates to the given inhibitor. A CDK 4/6 inhibitor arrests the cell cycle through inhibition of Rb, a pathway inactivated in HeLa cells, but intact in HCT-116 cells. This form of analysis illustrates the usefulness of heatmaps when used in conjunction with a variety of genetically dissimilar cell lines to determine a compound’s mechanism of action.

DISCUSSION
Prior analysis of HCI data centered around the collection of DNA content and protein expression data at the level of the individual cell, but analysis at the level of the entire population. Although these readouts with changes in multiple parameters were useful in a screening setting due to their ease of analysis, they became less useful when dissecting a treatment’s mechanism of action. The primary issue with well-level analysis is that it frequently masks subtle changes in cellular parameters, whereas subpopulation analysis distinguishes between the subpopulations defined by these subtle but often important changes. Data shown as an aggregate response to treatment frequently do not display the effect of the treatment on an individual cell and can mask important phenotypic changes. These aggregate responses often return results similar to those found in ELISAs which are also unable to differentiate between a large effect in a small subpopulation of cells from a smaller effect in every cell in the population. The differential effects of subpopulations to treatment may be a critical factor when studying diseases where only a subset of the total population is crucial to driving the disease, with the most obvious example found in cancer biology where the majority of the cells respond to chemotherapy while a subset of cancer stem cells remain resistant [16Hambardzumyan D, Squatrito M, Holland EC. Radiation resistance and stem-like cells in brain tumors Cancer Cell 2006; 10: 454-56., 17Li F, Tiede B, Massague J, Kang Y. Beyond tumorigenesis: cancer stem cells in metastasis Cell Res 2007; 17: 3-14.].
As a first step towards subpopulation analysis single parameter distributions are a simple tool that can be developed with a minimal amount of statistical and informatics support and can be quickly analyzed by biologists. A bivariate analysis, while adding an additional level of statistical complexity, is well worth the time and resources taken for the analysis. Linking changes in parameters from a multiplexed assay is an excellent start to defining subpopulation biology. These uncomplicated analyses illustrate the value of automated statistical tools to ease the analysis of large and complex data sets. Although these tools are an excellent first step towards dissecting subpopulations, additional subpopulations affecting the biology of the disease and treatment may remain undetected in the absence of more complex analysis.
Multiparameter analysis using unsupervised K-means clustering further defines and refines the subpopulations present in any studied population. One advantage to using this method is that a perturbation in any one of the parameters used in the analysis can change the identity and membership of subpopulations and detect additional, previously hidden, subpopulations. The changes in the subpopulations generated by these shifts lead to a degree of sensitivity in this analysis previously unknown to HCI. Even more important than these subtle population shifts are the slight phenotypic changes which may suggest the mechanism of action of uncharacterized treatments leading to cell cycle arrest, apoptosis, or modulation of cellular signaling. The fingerprints generated using this method of analysis describe important biological phenotypes across a population of treated cells and can be used to advance novel therapeutic treatments simply by following the phenotype of interest. Thus, phenotypic effects of traditional lead optimization SAR modifications, such as those designed to affect potency, solubility, metabolism, etc, can be tracked relative to the parent molecule through a careful analysis of high content fingerprints. Previously we have shown that this analysis can be used effectively both in vitro and in vivo to drive initial drug discovery efforts and is being used in our hands to detect and advance compounds with novel biologies [4Low J, Huang S, Blosser W, et al. High-content imaging characterization of cell cycle therapeutics through in vitro and in vivo subpopulation analysis Mol Cancer Ther 2008; 7: 2455-63.].