- Home
- About Journals
-
Information for Authors/ReviewersEditorial Policies
Publication Fee
Publication Cycle - Process Flowchart
Online Manuscript Submission and Tracking System
Publishing Ethics and Rectitude
Authorship
Author Benefits
Reviewer Guidelines
Guest Editor Guidelines
Peer Review Workflow
Quick Track Option
Copyediting Services
Bentham Open Membership
Bentham Open Advisory Board
Archiving Policies
Fabricating and Stating False Information
Post Publication Discussions and Corrections
Editorial Management
Advertise With Us
Funding Agencies
Rate List
Kudos
General FAQs
Special Fee Waivers and Discounts
- Contact
- Help
- About Us
- Search


Open Biological Sciences Journal
(Discontinued)
ISSN: 2352-6335 ― Volume 4, 2018
Robust Automated Image Analysis of Activated Red Blood Cells
Jan Martens1, *, Mauro C. Wesseling3, Joachim Weickert2, Ingolf Bernhardt3
Abstract
Background:
The investigation of eryptosis, a process in red blood cells (RBCs) comparable to apoptosis, has medical importance due to a link to thrombosis. Eryptosis is indicated by an exposure of phosphatidylserine (PS) on the outer cellular membrane. Experimental data suggests a relation between an elevated intracellular Ca2+ content of RBCs and PS exposure.
Objective:
To investigate this relation in wet-lab experiments, live cell imaging with fluorescence microscopy was carried out. RBCs from blood samples were labeled with fluorescence dyes to either mark exposed PS or intracellular Ca2+. Manual analysis requires the experimenter to count all cells in these images and to classify them according to their activation states and shape changes.
Method:
A combination of well-established image analysis techniques allows us to automate this task. A preprocessing step consisting of bandpass filtering and median filtering prepares the image such that a gradient operator and Otsu thresholding can extract cell boundaries. Followed by this, a Hough transform is applied to the preprocessed image to extract the cells. The activation state of detected RBCs is classified with a thresholding of the ratio between intracellular and outercellular brightness. Measuring and thresholding intracellular fluctuations allows to classify cells into discocytes and echinocytes. With these techniques we yield robust results, while saving valuable time.
Results and Conclusion:
Our results show that the automated system detects cells with high reliability and that the classifications are comparable to manual classifications.
Article Information

Identifiers and Pagination:
Year: 2016Volume: 2
First Page: 22
Last Page: 33
Publisher Id: BIOLSCI-2-22
DOI: 10.2174/2352633501602010022
Article History:
Received Date: 04/03/2016Revision Received Date: 06/10/2016
Acceptance Date: 07/10/2016
Electronic publication date: 30/11/2016
Collection year: 2016
open-access license: This is an open access article licensed under the terms of the Creative Commons Attribution-Non-Commercial 4.0 International Public License (CC BY-NC 4.0) (https://creativecommons.org/licenses/by-nc/4.0/legalcode), which permits unrestricted, non-commercial use, distribution and reproduction in any medium, provided the work is properly cited.
* Address correspondence to this author at the Luxembourg Centre for Systems Biomedicine Universite du Luxembourg 6, avenue du Swing 4367 Belvaux, Luxembourg; Tel: +49 17678599729; E-mails: janmartens@live.de, jan.martens@uni.lu
| Open Peer Review Details | |||
|---|---|---|---|
| Manuscript submitted on 04-03-2016 |
Original Manuscript | Robust Automated Image Analysis of Activated Red Blood Cells | |
1. INTRODUCTION
Even though eryptosis of RBCs is similar to apoptosis in nucleated cells, we still lack specific knowledge about the full process. It is known that PS exposure on the outer leaflet is an indicator for this process and serves as a signal for macrophages to remove the affected cells [1Nguyen DB, Wagner-Britz L, Maia S, et al. Regulation of phosphatidylserine exposure in red blood cells. Cell Physiol Biochem 2011; 28(5): 847-56.
[http://dx.doi.org/10.1159/000335798] [PMID: 22178937] ]. On a pathological level, PS exposing cells have shown a tendency to form blood clots which can cause thrombosis [2Steffen P, Jung A, Nguyen DB, et al. Stimulation of human red blood cells leads to Ca2+-mediated intercellular adhesion. Cell Calcium 2011; 50(1): 54-61.
[http://dx.doi.org/10.1016/j.ceca.2011.05.002] [PMID: 21616535] ].
The process of PS exposure and the impact of involved factors are still being investigated. However, based upon current knowledge, the intracellular content plays a central role. An elevated intracellular concentration has an effect on proteins responsible for maintaining the distribution of lipids in the membrane leaflets. Such proteins include flippase and scramblase. When the scramblase (see e.g. Kaestner et al. [1Nguyen DB, Wagner-Britz L, Maia S, et al. Regulation of phosphatidylserine exposure in red blood cells. Cell Physiol Biochem 2011; 28(5): 847-56.
[http://dx.doi.org/10.1159/000335798] [PMID: 22178937] ]) is activated it leads to PS exposure on the outer membrane leaflet (PS is normally located in the inner membrane leaflet only [3Verkleij A, Zwaal R, Roelofsen B, Comfurius P, Kastelijn D, van Deenen L. The asymmetric distribution of phospholipids in the human cell membrane. A combined study using phospholipases and freeze-etch electron microscopy. Biochem Biophys Acta - Biomembr 1973; 323(2): 178-93.]). As a side-effect, the Gardos channel is activated by the intracellular which leads to an efflux of potassium, accompanied by Ca2+, resulting in water loss and shrinkage of the cells. Normal cells are discocytes, whereas shrunken cells are transformed to echinocytes (for shapes of RBCs, see e.g. Lim et al. [4Lim H, Wortis M, Mukhopadhyay R. Stomatocyte-discocyte-echinocyte sequence of the human red blood cell: evidence for the bilayer-couple hypothesis from membrane mechanics. Proc Nat Acad Sci USA 2002; 99(26): 16766-9.
[http://dx.doi.org/10.1073/pnas.202617299] ]). In addition to the effect on the Gardos channel, intracellular Ca2+ activates protein kinase C (PKC), which directly stimulates PS exposure in the outer membrane leaflet [1Nguyen DB, Wagner-Britz L, Maia S, et al. Regulation of phosphatidylserine exposure in red blood cells. Cell Physiol Biochem 2011; 28(5): 847-56.
[http://dx.doi.org/10.1159/000335798] [PMID: 22178937] ]. Considering these processes, it is obvious that Ca2+ plays a key role in the exposure of PS. The increase of the intracellular Ca2+ concentration can be induced by different activators.
With this goal, RBCs are isolated and incubated with either one of the activators: (i) lysophosphatidic acid (LPA) (ii) phorbol-12 myristate-13 acetate (PMA), or (iii) 4-bromo-A23187 (A23187). Each activator has a different effect on RBCs. LPA activates a non-selective voltage-dependent kation (NSVDC) channel, PMA activates the Protein Kinase C, and A23187 is a ionophore and serves as positive control. Detailed investigations using these three activators can be seen [1Nguyen DB, Wagner-Britz L, Maia S, et al. Regulation of phosphatidylserine exposure in red blood cells. Cell Physiol Biochem 2011; 28(5): 847-56.
[http://dx.doi.org/10.1159/000335798] [PMID: 22178937] -5Kaestner L, Steffen P, Nguyen DB, et al. Lysophosphatidic acid induced red blood cell aggregation in vitro. Bioelectrochemistry 2012; 87: 89-95.
[http://dx.doi.org/10.1016/j.bioelechem.2011.08.004] [PMID: 21890432] ]. Through use of these activators, the role of different factors on eryptosis can be investigated.
During the fluorescence imaging experiments, two types of images are obtained for analysis: (i) Brightfield images are regular grayscale images with mild noise and strong illumination gradients. In most images, the RBC density is relatively low, such that cells rarely overlap, but this is not always the case. Dealing with overlapping cells is important to obtain reliable results.
(ii) Fluorescence images were obtained by using Fluo-4 for Ca2+ imaging (Fluo-4 binds intracellular Ca2+ and thus stains the cell from inside) or annexin-FITC for PS imaging (annexin binds to PS on the outer membrane leaflet and leads to signals on the cellular membrane). The strength of the fluorescence signals depending on the used activators have to be detected.
A dominant degradation in these images is strong noise, which at times, resembles impulse noise. The signals of activated cells are often well-distinguishable from the background due to their brightness. Some images also display weak fluorescence signals that are easily overlooked. The light of strongly fluorescent cells is often scattered around them, leading to subtle illumination gradients in areas with many activated cells.
Contributions
Our goal is to present a robust, efficient and user-friendly automated image analysis tool that offers two main advantages: Firstly, it requires only very simple image processing methods, such as bandpass filtering, median filtering and thresholding. Reducing the number of parameters to a minimum and keeping run times low is crucial to deliver a reliable yet simple-to-use tool. Secondly, it is not necessary to train our system. In comparison, few attempts for automated blood cell counting and classification have been described in recent years. These publications focused on different goals and used different sorts of images. Noteworthy examples are the works of Hamouda et al. [6Hamouda A, Khedr A, Ramadan R. Automated red blood cell counting. Int J Comput Sci 2012; 1(2): 13-6.] (automated RBC counting for hemacytometers), Won et al. [7Won C, Nam J, Choe Y. Extraction of leukocytes in a cell image with touching red blood cells. Proc SPIE 2005; 5672: 399-406.
[http://dx.doi.org/10.1117/12.593335] ], Hiremath et al. [8Hiremath PS, Bannigidad P, Geeta S. Automated identification and classification of white blood cells (leukocytes) in digital microscopic images. Int J Comput Appl 2010; 59-63.] (identification and differentiation of white blood cells) and Tomari et al. [9Tomari R, Zakaria W, Jamil M, Nor F, Fuad N. Computer aided system for red blood cell classification in blood smear images. Procedia Comput Sci 2014; 42: 206-13.
[http://dx.doi.org/10.1016/j.procs.2014.11.053] ]. Other approaches, based on digital holographic microscopy require direct user-interaction for proper segmentation as described by Yi et al. [10Yi F, Moon I, Lee Y. Extraction of target specimens from bioholographic images using interative graph cuts. J Biomed Opt 2015; 18(12): 126015.]. In contrast to our system, machine learning techniques such as neuronal networks and supervised clustering are required within these approaches. Most images used in the other works are blood smear images with only minor perturbations.
2. MATERIALS AND METHODS
2.1. Blood Sample Preparation
Human blood samples from healthy donors were obtained from the Institute of Clinical Hematology and Transfusion Medicine of Saarland University Hospital. These samples were treated with the anticoagulant EDTA and stored at in physiological solution (145 mM NaCl, 7.5 mM KCl, 10 mM glucose, 10 mM HEPES Tris, pH 7.4). They were used within one day.
The separation of RBCs was performed in three washing and centrifugation steps at 2000 g for 5 min at room temperature, such that the buffy coat and the blood plasma were removed.
The remaining sample was diluted with physiological solution and subsequently incubated with one of the activators (2.5 µM LPA, 6 µM PMA, 2 µM A23187). Each activator leads to a specific cellular reaction. LPA is released by blood platelets after their activation. It is known to activate a non-selective voltage-dependent cation channel in RBCs [5Kaestner L, Steffen P, Nguyen DB, et al. Lysophosphatidic acid induced red blood cell aggregation in vitro. Bioelectrochemistry 2012; 87: 89-95.
[http://dx.doi.org/10.1016/j.bioelechem.2011.08.004] [PMID: 21890432] ]. PMA activates PKCα which leads to PS exposure on the outer membrane leaflet [1Nguyen DB, Wagner-Britz L, Maia S, et al. Regulation of phosphatidylserine exposure in red blood cells. Cell Physiol Biochem 2011; 28(5): 847-56.
[http://dx.doi.org/10.1159/000335798] [PMID: 22178937] ]. As a positive control for an increased intracellular Ca2+ content, A23187 is used in some experiments. It is an ionophore that directly leads to Ca2+ uptake.
Fluorescence microscopy was performed in time steps ranging from 0 min to 30 min after activation, with pictures taken in 20 second intervals. For staining, either Fluo-4 (concentration 1 imaging) or annexin-FITC (concentration 4.5 µM; for PS imaging) were used. Both dyes can be excited at a wavelength 488 nm, but have different binding regions. Fluo-4 binds directly to intracellular Ca2+, leading to signals inside the cell. FITC binds on the outer cellular leaflet, leading signals on the cellular borders. For image acquisition, cells were kept in a petri dish.
The used fluorescence microscope is an Eclipse TE 2000-E from Nikon Corporation, which has a CCD77 Visitron System GmbH camera. Pictures were taken and saved with the software Metavue Visitron System.
2.2. Image Analysis Techniques
Depending on the image type, different tasks are to be solved and thus different processing steps need to be applied. Brightfield images require the detection of RBCs and the classification of their shapes as either discocytes or echinocytes (stomatocytes are rarely present in described experiments). Cell detection gives information on the location of each individual cell such that assigning the fluorescence signals in the corresponding fluorescence images becomes possible.
In case of brightfield images, the interest lies in the detection of the RBCs. We typically use grayscale images, which offer a decent resolution, but suffer from image degradations. Such degradations involve slowly varying illumination gradients and minor noise. These gradients result from either uneven illumination or shades of cells outside the focal plane. For brightfield image processing, a preprocessing step (subdivided into four single steps) and a cell recognition step are performed (as illustrated in Fig. 1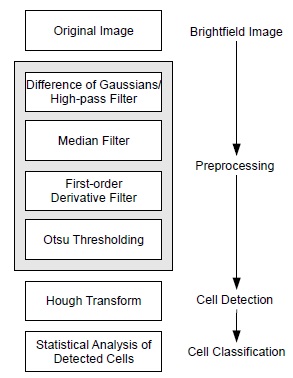 ).
).
 |
Fig. (1) Sequence of image processing steps for RBC detection. |
Noise and illumination gradients are addressed by using difference of Gaussians and median filtering. Difference of Gaussians is used as a band-pass filter, which only preserves elements of a specified frequency. This is done by subtracting two Gaussian-blurred images with different standard deviations from one another. In the underlying case, preserving high-frequent features such as the ones of RBCs is desirable, which is why a Gaussian-blurred image is subtracted from the original image (we are using the standard deviations σ1 = 0 and σ2 = 10). Illumination gradients and shades are effectively removed with this technique.
Afterwards, we remove noise using a median filter with a disc-shaped neighborhood of radius 2 pixels. As a side-effect, the median filter is smoothing the image and preparing it for upcoming steps.
The next two preprocessing steps are used for extraction of the cell boundaries. This is done by calculating the gradient magnitude of the image. The gradient is approximated by means of central differences. Under normal conditions, it is favorable to apply some presmoothing beforehand or to apply Sobel operators. Due to the median filtering, the image is already presmoothed and no additional smoothing is necessary.
The resulting image contains information on the cell boundaries. Thresholding segments this image and allows the identification of important structures. For fast, automated threshold selection, Otsu's method [11Otsu N. A threshold selection method from gray-level histograms. IEEE Trans Syst Man Cybern 1979; SMC-9(1): 62-6.] is used (the threshold is chosen such that it maximizes the between-class variance given in Eq. (1):
 |
(1) |
where µ 0 and µ1 are the mean gray values of the resulting segments, µtotal the mean gray value of the image, and w (T) the percentage of all pixels below the threshold T.
With the preprocessed image containing the relevant edge information, the Hough Transform [12Hough P. Method and means for recognizing complex patterns, US Patent 3,069,654, 1962.] is used to find circular objects within the image and is the only step requiring user parameters; note that the preprocessing steps consisting of difference of Gaussians and median filtering work sufficiently well with fixed, predetermined parameters. The result is a dataset describing the properties of located circles, with data including circle position, area, radius, location, and score. The detected circles correspond to the RBCs found in the image.
After the detection of the RBCs has been performed, the task of classifying them according to their shape remains. This is done by measuring the variance inside the respective cell of the fully preprocessed image. The preprocessed image contains only information about the most relevant edges in the images and benefits from robustness with respect to illumination gradients. Following the observation that the texture of echinocytes is more complex than the flat one of discocytes, this technique allows for a robust and simple classification of these two cell shapes based on a threshold value, which can be adapted by the user. In order to exclude the edge of the cell borders, pixels at the cell boundaries are neglected.
RBCs with an increased fluorescence intensity are found to be activated by the experimenters. The classification of the program is based on the gray values inside the respective region in the fluorescence image. If the ratio of the mean value inside the region of the cell and the background region around it exceeds a user-defined threshold, we consider this cell as activated. A value based on expert experience is used for this purpose.
Since the ratio of gray values in the fluorescence images might be altered by contrast and brightness changes, an optional affine rescaling is offered as a means of normalization before measuring the fluorescence intensity.
3. RESULTS
The developed software was tested in a variety of experiments. Typical RBC images acquired during these experiments are shown in Fig. (2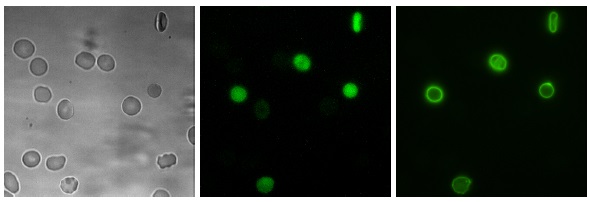 ).
).
In each case, the program's default parameters (difference of Gaussians with standard deviations σ1 = 0 and σ1 = 10; median filter with circular structuring element of radius 2; Hough transform with expected circle radius in range and a circle threshold of 130). The first results were generated by running the program on six different image sets and evaluating the program's results afterwards. The image sets resulted from experiments under various conditions (an overview is listed in Table 1). The program was executed on a system with an Intel Core i3-2330M CPU with 2.20 GHz, 4 GB RAM and a 64 bit version of the operating system Windows 7. Execution times are given in Table 2.

Program execution times for the image sets in seconds. The set numbers correspond to the set numbers in Table 1. Each image set contains a varying number of brightfield images, with each one having an associated fluorescence image (we refer to them as im

The first set serves as a negative control for fluorescence measurements since cells in the image were neither stained with a fluorescence dye nor treated with an activator. Cells are rather densely packed in some areas and require to cope with overlaps. In the second set cells were only treated with the dye Fluo-4, resulting in weak fluorescence signals. Around two thirds of all cells are echinocytes and very few cells are activated. In the third image set, the activator LPA was used, leading to rather weak signals for and a balanced amount of echinocytes and discocytes. Cells have plenty of room and did not overlap. Image set four used the activator PMA, resulting in some very strong cellular responses for . In this case echinocytes were not observed. The conditions are similar in the fifth image set, but cells were incubated for an extended period with A23187 (positive control), resulting in strong signals for . The last image set provides similar conditions, but the fluorescence dye FITC was used, leading to bright signals of PS at the outer cellular membrane.
As a statistical performance measure, sensitivity, specificity, positive predictive value and accuracy were calculated. These values are based on the numbers of the true positive (TP), true negative (TN), false positive (FP) and false negative (FN) classification of the program in comparison to human experimenter annotations. If at least one of these values is 0, the calculation of the statistical values is not possible, resulting in an indeterminable value (labeled as NaN). For their defintion, refer to the Appendix.
One should note that the specificity and accuracy were not calculated for cell detection due to the difficulty of defining TN hits for this task.
Fig. (3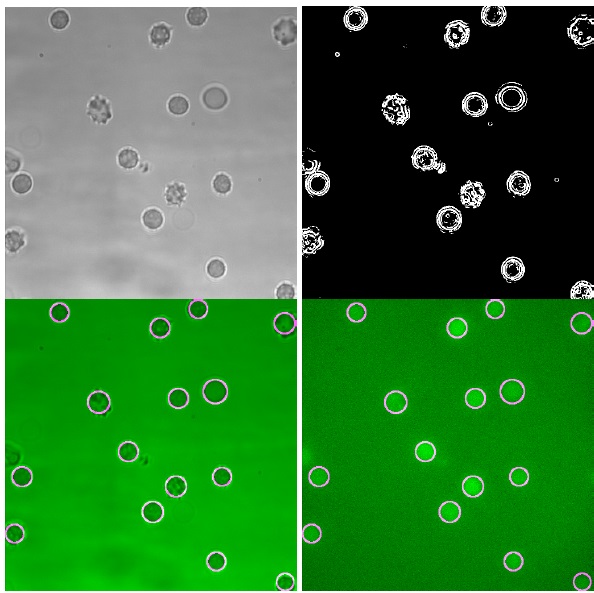 ) illustrates the typical result of this cell recognition process. As shown in Fig. (4
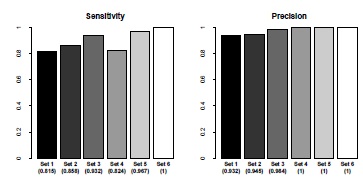 ), cell detection is generally very reliable, showing perfect or almost perfect positive predictive value. The very few detected false positive RBC detections result from overlapping cell borders in areas where RBCs are densely packed. The sensitivity proves that at worst, around of the cells are detected, but in sets with better image conditions higher values are easily achieved, such that all RBCs can potentially be recognized.

 |
Fig. (4) Sensitivity and positive predictive value for cell detection. The set numbers correspond to the set numbers in Table 1. The labels refer to the respective image sets, the numbers in parenthesis are the calculated statistical values. The raw statistical values are listed in Appendix Table 3. |
Activation classification proves to be similarly robust. As shown in the plots in Fig. (5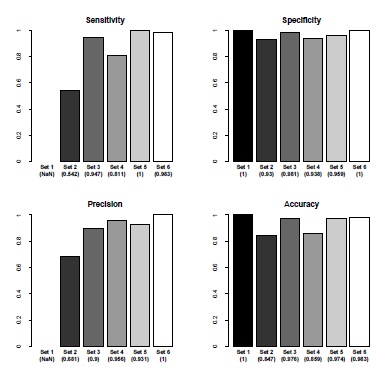 ), only image set 5 contains false negative hits, but otherwise the methods and default values of the algorithm work well and offer solid results. Sensitivity and positive predictive value are indeterminable in image set 1 since cells were not stained and thus no fluorescence signal could be measured. We are thus unable to calculate this value (labeled as NaN).
 |
Fig. (5) Sensitivity, specificity, positive predictive value and accuracy for cell activation classification. The set numbers correspond to the set numbers in Table 1. The labels refer to the respective image sets, the numbers in parenthesis are the calculated statistical values. The raw statistical values are listed in Appendix Table 4. |
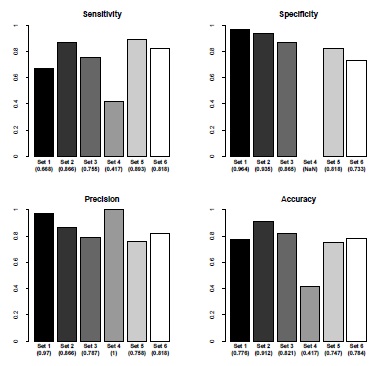 |
Fig. (6) Sensitivity, specificity, positive predictive value and accuracy for cell shape classification. The values relate to discocyte recognition. The set numbers correspond to the set numbers in Table 1. The labels refer to the respective image sets, the numbers in parenthesis are the calculated statistical values. The raw statistical values are listed in Appendix Table 5. |
The plots in Fig. (6 ), which relate to cell differentiation were generated with respect to the recognition of discocytes. As the plots indicate, these results are weaker than the previous ones. Even though the percentage of detected discocytes only drops below 70% in the image sets 1 and 4, the simple classification method based on the variance of an RBCs texture works. The lack of echinocytes in set 4 does however falsify the results, leading to an unreliable values for positive predictive value. The specificity can not be calculated. One could argue that there is still room for improvement, but considering the complexity of other potential classifiers, the results are still acceptable.
Additionally, the program's results were compared with the results of two different human experimenters. For this purpose, two experiments were conducted and the two human experimenters were asked to manually annotate the images. These annotated images were subsequently compared with the results generated by the program. For these experiments, cells were incubated with the dye Fluo-4 in a 2 mM Ca2+ solution. One experiments served as a control (see Fig. 7a ), in the second one the activator PMA was used Fig. (7b
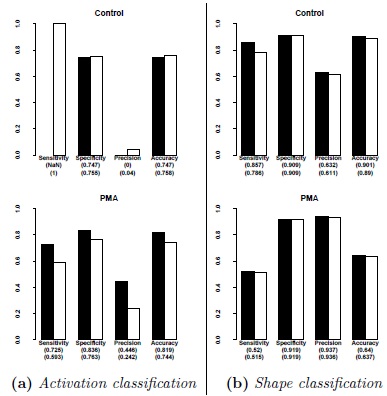 ).
).
 |
Fig. (7) Comparison of experimenter annotations with the program results. Plots indicate the results two experiments. In the first one, the activator PMA was deployed and a set of 8 brightfield images with their fluorescence counterparts were taken. The second experiment serves as a control experiment without activator with overal 9 brightfield images and corresponding fluorescence images. IN both cases, the dye Fluo-4 was used. The two experimenter annotations were considered as two different gold standards and used for calculating sensitivity, specificity, positive predictive value and accuracy. For the raw statistical values, refer to Appendix Tables 6 and 7. Sub Fig (a) depicts two plots for activation classifcation, Subfigure (b) shows two plots for shape classification for discocytes. Control describes the experiment without an activator, PMA denotes the experiment where the activator PMA was used. Results for the first experimenter are marked in black, while the values for the second experimenter are marked in white. |
Cell activation state classification of the developed program in comparison to the results of the experimenters, shows in both experiments reliable results. The difference for the control experiment in terms of sensitivity and positive predictive value results from the fact that one experimenters annotated some RBCs as strongly responding, while the other experimenter annotated no cells in the set as strongly responding. The fact that some decisions for classification are subjective shows its consequences in the plots.
Cell shape classification shows more stable and also generally better results. Notable differences between expert annotation and program annotation are seen in the experiment were the activator PMA was used. In this case it is very important to note that these images contained stomatocytes which were classified as echinocytes. Up to this point, the program has been designed to differentiate between echinocytes and discocytes only, since stomatocytes are very rare in healthy individuals. For instance, stomatocytes usually make up less than 3% in healthy individuals. Individuals with hereditary stomatocytosis can have up to 30% (e.g., [13Lichtin A. Stomatocytosis and anemia caused by hypophosphatemia 2013. Available at: http://www.msdmanuals.com/professional/ hematology-and-oncology/anemias-caused-by-hemolysis/stomatocytosis-and-anemia-caused-by-hypophosphatemia ]).
However, under in vitro conditions echinocytes and stomatocytes can occur in greater numbers. The “normal” discocytes are able to transform into either echinocytes or stomatocytes depending on a large variety of membrane and cytoplasmic parameters [4Lim H, Wortis M, Mukhopadhyay R. Stomatocyte-discocyte-echinocyte sequence of the human red blood cell: evidence for the bilayer-couple hypothesis from membrane mechanics. Proc Nat Acad Sci USA 2002; 99(26): 16766-9.
[http://dx.doi.org/10.1073/pnas.202617299] , 14Deuticke B. Membrane lipids and proteins as a basis of red cell shape and its alterations In: Red Cell Membrane Transport in Health Disease. Berlin Heidelberg, Springer 2003; pp. 27-60.
[http://dx.doi.org/10.1007/978-3-662-05181-8_2] -16Rasia M, Bollini A. Conformational change of membrane proteins leads to shape changes of red blood cells. Biochim Biophys Acta 1998; 1372(2): 198-204.
[http://dx.doi.org/10.1016/S0005-2736(98)00057-1] [PMID: 9675280] ]. In addition a spontaneous shape change occurs if the RBCs are in contact with the glass surface [17Ponder E. Hemoysis and related phenomena. New York: Grunde & Stratton 1948.]). Futhermore, the interaction of RBCs with amphiphilic substances leads to the transformation of discocytes to echinocytes or stomatocytes depending on their membrane side of insertion. When the inner membrane leaflet is extended relative to the outer one, more stomatocytes are produced, when the outer membrane leaflet is extended relative to the inner one, more echinocytes are produced [18Betz T, Bakowsky U, Müller MR, Lehr CM, Bernhardt I. Conformational change of membrane proteins leads to shape changes of red blood cells. Bioelectrochemistry 2007; 70(1): 122-6.
[http://dx.doi.org/10.1016/j.bioelechem.2006.03.019] [PMID: 16713378] , 19Gimsa J, Ried C. Do band 3 protein conformational changes mediate shape changes of human erythrocytes? Mol Membr Biol 1995; 12(3): 247-54.
[http://dx.doi.org/10.3109/09687689509072424] [PMID: 8520625] ].
Therefore, there is only a small negative impact analysing blood from healthy individuals. Under in vitro conditions, a substantial negative impact has to be taken into consideration. This could be a reason why wrong classifications have a notably negative impact on the results and are the reason why sensitivity and accuracy are lower than in earlier plots. This incident shows that a more robust model would be favorable to deal with such rare, unexpected issues.
The plots presented in Fig. (7a) make it clear that the performance of the image analysis tool depends from the subjective decision of each expert. Especially activation state classification shows strong differences and revealed a weakness in terms of classification. However, the experimenters showed tolerance for the program's decision in corner cases, where differentiating between activation states for Ca2+ was difficult. In these cases, the experimenters were willing to agree with the program, even when their own annotations were initially different. The true performance of the classifier can thus be considered to be better than Fig. (7a) indicates.
DISCUSSION AND CONCLUSION
The methods for detecting and classifying RBCs are relatively fast and the generated results are reliable.
Cell detection works very well and recognizes most cells on the images. Images with ideal conditions lead to almost perfect or even perfect results, proving that the method for automated cell detection is a valid alternative to manual cell counting. Classification of fluorescence activation states and cell shapes also work surprisingly well, even if images suffer from minor perturbations. Yet again, it is obvious that images with conditions close to the underlying assumptions about noise and illumination yield the best results.
The possibilities that a combination of more advanced methods such as texture descriptors and other active contour models offer, suggest that cell detection and differentiation can be improved further, making the overall model more robust. As an alternative to the proposed methods, we also attempted to use more sophisticated methods. Applying active contour models such as geodesic active contours [20Caselles R, Kimmel R, Sapiro G. Geodesic active contours. Int J Comput Vis 1997; 22(1): 61-79., 21Kichenassamy S, Olver K A P, Tannenbaum A, Yezzi A. Conformal curvature flows: from phase transitions to active vision. Arch Ration Mech Anal 1996; 134(3): 275-301.
[http://dx.doi.org/10.1007/BF00379537] ], the Chan-Vese model [22Chan TF, Vese LA. Active contours without edges. IEEE Trans Image Process 2001; 10(2): 266-77.
[http://dx.doi.org/10.1109/83.902291] [PMID: 18249617] ], or statistical models like the one proposed by Zhang et al. [23Zhang K, Zhang L, Song H, Zhou W. Active contours with selective or global segmentation: a new formulation and level set method. Image Vis Comput 2010; 28(4): 668-476.
[http://dx.doi.org/10.1016/j.imavis.2009.10.009] ] gave unsatisfactory results. This problem is largely caused by inconsistent illumination. Even subtle illumination inconsistencies are enough to influence segmentation with active contours negatively. A preprocessing with an edge-enhancing diffusion filter [24Perona P, Malik J. Scale-space and edge detection using anisotropic diffusion. IEEE Trans Pattern Anal Mach Intell 1990; 12(7): 629-39.
[http://dx.doi.org/10.1109/34.56205] ] did not yield notable improvements.
Machine learning approaches such as clustering and principal component analysis could offer alternative and possibly more reliable ways for cell state and cell shape classification.
Putting the possibilities of image analysis into perspective, it appears promising to view it as the foundation of upcoming findings. In comparison to other techniques, it is possible to identify more features that might be linked to biophysical processes. Flow cytometry for example, might have a higher throughput, but does not allow the classification of cell shapes and imposes cellular stress onto the RBCs. Extracting and interpreting visual features and their correlations will be the key for future projects and scientists might be able to use 2D information provided by the images for the approximation of 3D information, e.g. to calculate cellular volume based on theoretical models such as presented by Lim et al. [4Lim H, Wortis M, Mukhopadhyay R. Stomatocyte-discocyte-echinocyte sequence of the human red blood cell: evidence for the bilayer-couple hypothesis from membrane mechanics. Proc Nat Acad Sci USA 2002; 99(26): 16766-9.
[http://dx.doi.org/10.1073/pnas.202617299] ]. Thus, in conjunction with innovative ideas and interdisciplinary knowledge, image analysis has the potential to become a powerful tool.
However, it is unlikely that high-throughput analysis methods such as flow cytometry will be substituted by image analysis methods in the near future. On the other hand, manual analysis of microscope images could be sped up considerably. Optimizing algorithms and using parallel computing methods are most promising and future projects will surely result in tools allowing for computer-aided data analysis in real time.
APPENDIX


Raw data for cell activation annotations by two separate experimenters. The numbers are related to two different experiments, one control experiment without activator and one with PMA. Cells with a sufficiently strong fluorescence signal are considered as activated. Experimenter annotations are considered as gold standard.

Raw data for cell shape annotations by two separate experimenters. The numbers are related to two different experiments, one control experiment without activator and one with PMA. The values are derived with respect to discocyte classification. Discocytes classified as true positive (TP) agree with experimenter annotations. Experimenter annotations are considered as gold standard.
CONFLICT OF INTREST
The authors confirm that this article content has no conflict of interest.
ACKNOWLEDGEMENTS
Mauro C. Wesseling has been supported by the CNPq (Brazil).
REFERENCES
| [1] | Nguyen DB, Wagner-Britz L, Maia S, et al. Regulation of phosphatidylserine exposure in red blood cells. Cell Physiol Biochem 2011; 28(5): 847-56. [http://dx.doi.org/10.1159/000335798] [PMID: 22178937] |
| [2] | Steffen P, Jung A, Nguyen DB, et al. Stimulation of human red blood cells leads to Ca2+-mediated intercellular adhesion. Cell Calcium 2011; 50(1): 54-61. [http://dx.doi.org/10.1016/j.ceca.2011.05.002] [PMID: 21616535] |
| [3] | Verkleij A, Zwaal R, Roelofsen B, Comfurius P, Kastelijn D, van Deenen L. The asymmetric distribution of phospholipids in the human cell membrane. A combined study using phospholipases and freeze-etch electron microscopy. Biochem Biophys Acta - Biomembr 1973; 323(2): 178-93. |
| [4] | Lim H, Wortis M, Mukhopadhyay R. Stomatocyte-discocyte-echinocyte sequence of the human red blood cell: evidence for the bilayer-couple hypothesis from membrane mechanics. Proc Nat Acad Sci USA 2002; 99(26): 16766-9. [http://dx.doi.org/10.1073/pnas.202617299] |
| [5] | Kaestner L, Steffen P, Nguyen DB, et al. Lysophosphatidic acid induced red blood cell aggregation in vitro. Bioelectrochemistry 2012; 87: 89-95. [http://dx.doi.org/10.1016/j.bioelechem.2011.08.004] [PMID: 21890432] |
| [6] | Hamouda A, Khedr A, Ramadan R. Automated red blood cell counting. Int J Comput Sci 2012; 1(2): 13-6. |
| [7] | Won C, Nam J, Choe Y. Extraction of leukocytes in a cell image with touching red blood cells. Proc SPIE 2005; 5672: 399-406. [http://dx.doi.org/10.1117/12.593335] |
| [8] | Hiremath PS, Bannigidad P, Geeta S. Automated identification and classification of white blood cells (leukocytes) in digital microscopic images. Int J Comput Appl 2010; 59-63. |
| [9] | Tomari R, Zakaria W, Jamil M, Nor F, Fuad N. Computer aided system for red blood cell classification in blood smear images. Procedia Comput Sci 2014; 42: 206-13. [http://dx.doi.org/10.1016/j.procs.2014.11.053] |
| [10] | Yi F, Moon I, Lee Y. Extraction of target specimens from bioholographic images using interative graph cuts. J Biomed Opt 2015; 18(12): 126015. |
| [11] | Otsu N. A threshold selection method from gray-level histograms. IEEE Trans Syst Man Cybern 1979; SMC-9(1): 62-6. |
| [12] | Hough P. Method and means for recognizing complex patterns, US Patent 3,069,654, 1962. |
| [13] | Lichtin A. Stomatocytosis and anemia caused by hypophosphatemia 2013. Available at: http://www.msdmanuals.com/professional/ hematology-and-oncology/anemias-caused-by-hemolysis/stomatocytosis-and-anemia-caused-by-hypophosphatemia |
| [14] | Deuticke B. Membrane lipids and proteins as a basis of red cell shape and its alterations In: Red Cell Membrane Transport in Health Disease. Berlin Heidelberg, Springer 2003; pp. 27-60. [http://dx.doi.org/10.1007/978-3-662-05181-8_2] |
| [15] | Gedde MM, Davis DK, Huestis WH. Cytoplasmic pH and human erythrocyte shape. Biophys J 1997; 72(3): 1234-46. [http://dx.doi.org/10.1016/S0006-3495(97)78770-8] [PMID: 9138569] |
| [16] | Rasia M, Bollini A. Conformational change of membrane proteins leads to shape changes of red blood cells. Biochim Biophys Acta 1998; 1372(2): 198-204. [http://dx.doi.org/10.1016/S0005-2736(98)00057-1] [PMID: 9675280] |
| [17] | Ponder E. Hemoysis and related phenomena. New York: Grunde & Stratton 1948. |
| [18] | Betz T, Bakowsky U, Müller MR, Lehr CM, Bernhardt I. Conformational change of membrane proteins leads to shape changes of red blood cells. Bioelectrochemistry 2007; 70(1): 122-6. [http://dx.doi.org/10.1016/j.bioelechem.2006.03.019] [PMID: 16713378] |
| [19] | Gimsa J, Ried C. Do band 3 protein conformational changes mediate shape changes of human erythrocytes? Mol Membr Biol 1995; 12(3): 247-54. [http://dx.doi.org/10.3109/09687689509072424] [PMID: 8520625] |
| [20] | Caselles R, Kimmel R, Sapiro G. Geodesic active contours. Int J Comput Vis 1997; 22(1): 61-79. |
| [21] | Kichenassamy S, Olver K A P, Tannenbaum A, Yezzi A. Conformal curvature flows: from phase transitions to active vision. Arch Ration Mech Anal 1996; 134(3): 275-301. [http://dx.doi.org/10.1007/BF00379537] |
| [22] | Chan TF, Vese LA. Active contours without edges. IEEE Trans Image Process 2001; 10(2): 266-77. [http://dx.doi.org/10.1109/83.902291] [PMID: 18249617] |
| [23] | Zhang K, Zhang L, Song H, Zhou W. Active contours with selective or global segmentation: a new formulation and level set method. Image Vis Comput 2010; 28(4): 668-476. [http://dx.doi.org/10.1016/j.imavis.2009.10.009] |
| [24] | Perona P, Malik J. Scale-space and edge detection using anisotropic diffusion. IEEE Trans Pattern Anal Mach Intell 1990; 12(7): 629-39. [http://dx.doi.org/10.1109/34.56205] |