- Home
- About Journals
-
Information for Authors/ReviewersEditorial Policies
Publication Fee
Publication Cycle - Process Flowchart
Online Manuscript Submission and Tracking System
Publishing Ethics and Rectitude
Authorship
Author Benefits
Reviewer Guidelines
Guest Editor Guidelines
Peer Review Workflow
Quick Track Option
Copyediting Services
Bentham Open Membership
Bentham Open Advisory Board
Archiving Policies
Fabricating and Stating False Information
Post Publication Discussions and Corrections
Editorial Management
Advertise With Us
Funding Agencies
Rate List
Kudos
General FAQs
Special Fee Waivers and Discounts
- Contact
- Help
- About Us
- Search


Current Chemical Genomics and Translational Medicine
(Discontinued)
ISSN: 2213-9885 ― Volume 12, 2018
Establishing a High-content Analysis Method for Tubulin Polymerization to Evaluate Both the Stabilizing and Destabilizing Activities of Compounds
Chi Shing Sum, Debra Nickischer, Ming Lei, Andrea Weston, Litao Zhang, Liang Schweizer*
Abstract
Microtubules are important components of the cellular cytoskeleton that play roles in various cellular processes such as vesicular transport and spindle formation during mitosis. They are formed by an ordered organization of α-tubulin and β-tubulin hetero-polymers. Altering microtubule polymerization has been known to be the mechanism of action for a number of therapeutically important drugs including taxanes and epothilones. Traditional cell-based assays for tubulin-interacting compounds rely on their indirect effects on cell cycle and/or cell proliferation. Direct monitoring of compound effects on microtubules is required to dissect detailed mechanisms of action in a cellular setting. Here we report a high-content assay platform to monitor tubulin polymerization status by directly measuring the acute effects of drug candidates on the cellular tubulin network with the capability to dissect the mechanisms of action. This high-content analysis distinguishes in a quantitative manner between compounds that act as tubulin stabilizers versus those that are tubulin destabilizers. In addition, using a multiplex approach, we expanded this analysis to simultaneously monitor physiological cellular responses and associated cellular phenotypes.
Article Information
Identifiers and Pagination:
Year: 2014Volume: 8
Issue: Suppl-1
First Page: 16
Last Page: 26
Publisher Id: CCGTM-8-16
DOI: 10.2174/2213988501408010016
Article History:
Received Date: 27/8/2013Revision Received Date: 4/1/2014
Acceptance Date: 13/1/2014
Electronic publication date: 7/2/2014
Collection year: 2014
open-access license: This is an open access article licensed under the terms of the Creative Commons Attribution Non-Commercial License (http://creativecommons.org/licenses/by-nc/3.0/) which permits unrestricted, non-commercial use, distribution and reproduction in any medium, provided the work is properly cited.
* Address correspondence to this author at the Lead Discovery and Optimization, Bristol-Myers Squibb Company, USA; Tel: (609)818-6759; E-mail: liang.schweizer@bms.com
| Open Peer Review Details | |||
|---|---|---|---|
| Manuscript submitted on 27-8-2013 |
Original Manuscript | Establishing a High-content Analysis Method for Tubulin Polymerization to Evaluate Both the Stabilizing and Destabilizing Activities of Compounds | |
INTRODUCTION
Microtubules are important structural components of the cytoskeleton. Microtubules are composed of polymerized α-tubulin and β-tubulin subunits organized into structures called protofilaments, ten to fifteen of which associate to form the hollow cylindrical polymers of microtubules [1Desai A, Mitchison TJ. Microtubule polymerization dynamics Annu Rev Cell Dev Biol 1997; 13: 83-117.
[http://dx.doi.org/10.1146/annurev.cellbio.13.1.83] ]. The dynamics of microtubule assembly and disassembly play an important role in cellular processes such as vesicular transport [2Hamm-Alvarez SF, Sheetz MP. Microtubule-dependent vesicle transport: modulation of channel and transporter activity in liver and kidney Physiol Rev 1998; 78: 1109-29.]. Also, it has long been known that, in cells undergoing cell division, the organization of microtubules into spindle fibers allows polarized migration of duplicated chromosomes during mitosis.
A number of well characterized anti-cancer drugs have demonstrated cytotoxic effects by altering microtubule dynamics in cancer cells, in turn disrupting the formation of mitotic spindles and ultimately the progression of mitotic process. For example, paclitaxel binds to a pocket within β-tubulin that putatively counteracts the effect of GTP hydrolysis, resulting in stabilization of microtubule structure [3Amos LA, Lowe J. How Taxol stabilises microtubule structure Chem Biol 1999; 6: R65-9.
[http://dx.doi.org/10.1016/S1074-5521(99)89002-4] ]. Another class of compounds, including nocodazole, vinblastine, colchicine or tubulysin, interferes with microtubule dynamics by causing tubulin depolymerization [4Jordan A, Hadfield JA, Lawrence NJ, McGown AT. Tubulin as a target for anticancer drugs: agents which interact with the mitotic spindle Med Res Rev 1998; 18: 259-96.
[http://dx.doi.org/10.1002/(SICI)1098-1128(199807)18:4<259::AID-MED3>3.0.CO;2-U] ]. The stabilization of microtubules or disruption of tubulin polymerization by these compounds leads to cell cycle arrest and cancer cell death. As a result, monitoring drug effects on microtubule polymerization is essential to addressing anti-cancer activity. On the other hand, many other therapeutic approaches aim to avoid interference of tubulin dynamics, given that this may cause cytotoxicity. Therefore, an assay that can accurately monitor microtubule dynamics is broadly applicable to drug discovery programs seeking to optimize and progress lead compounds.
The commonly used methods to assess compounds for their microtubule activity include both biochemical and cell-based assays. The biochemical assays normally employ purified tubulin, and are based on the principle that polymerization of tubulin leads to changes in turbidity. The change in turbidity can be monitored as absorbance change due to the light scattering property of tubulin polymerization [5Shelanski ML, Gaskin F, Cantor CR. Microtubule assembly in the absence of added nucleotides Proc Natl Acad Sci USA 1973; 70: 765-8.
[http://dx.doi.org/10.1073/pnas.70.3.765] , 6Gaskin F. Analysis of microtubule assembly kinetics using turbidimetry Methods Mol Biol 2011; 777: 99-105.
[http://dx.doi.org/10.1007/978-1-61779-252-6_7] ]. A fluorescent-based version of the biochemical assay takes advantage of the ability of polymerized tubulin to bind the fluorescent molecule DAPI with higher affinity than unpolymerized tubulin [7Bonne D, Heusele C, Simon C, Pantaloni D. 4',6-Diamidino-2-phenylindole, a fluorescent probe for tubulin and microtubules J Biol Chem 1985; 260: 2819-5.]. Accordingly, tubulin polymerization is reflected by an increase in fluorescence intensity of DAPI, and tubulin depolymerization leads to decreased fluorescence intensity of DAPI. These assays typically require a relatively large amount of purified tubulin, resulting in an assay that is not cost-effective for screening large numbers of compounds. Cell-based assays for tubulin polymerization often utilize either fluorescent microscopy or cell cycle analysis. In fluorescent microscopic studies, either the α- or β-tubulin can be labeled directly with a tubulin antibody-conjugated fluorescent probe, or indirectly via a secondary antibody. Such studies, while straightforward, are limited in throughput, and they lack adequate methods for quantification (e.g., [8Khalil MW, Sasse F, Lunsdorf H, Elnakady YA, Reichenbach H. Mechanism of action of tubulysin, an antimitotic peptide from myxobacteria Chembiochem 2006; 7: 678-83.
[http://dx.doi.org/10.1002/cbic.200500421] , 9Ma YM, Zhou YB, Xie CM, Chen DM, Li J. Novel microtubule-targeted agent 6-chloro-4-(methoxyphenyl) coumarin induces G(2)-M arrest and apoptosis in HeLa cells Acta Pharmacol Sin 2012; 33: 407-17.
[http://dx.doi.org/10.1038/aps.2011.176] ]). Quantitative cell-based assays for assessing microtubule activities of compounds are often achieved by measuring the indirect effects on cell cycle which result from a disruption of microtubule networks. Tubulin stabilizers and destabilizers cause cell cycle arrest at the G2/M phase [10Bhalla KN. Microtubule-targeted anticancer agents and apoptosis Oncogene 2003; 22: 9075-86.
[http://dx.doi.org/10.1038/sj.onc.1207233] ], and therefore measurement of the percentage of cells arrested in G2/M phase is often used as a surrogate endpoint for microtubule activity. The cell cycle analysis can be efficient due to a simple workflow and amenability to high throughput platforms; however, the method is not direct and cannot be used to discern mechanistically between tubulin stabilization and destabilization.
To address the need for a quantitative cell-based assay for direct measurement of tubulin effects, we describe here the development of a high-content platform to monitor tubulin polymerization. High-content assays have the power to simultaneously measure a variety of cell features in a highly quantitative manner, and they have been previously applied to the study of compound cytotoxic effects on tubulin, in which certain cytotoxic compounds can lower the tubulin staining intensity [11Ross-Macdonald P, de Silva H, Guo Q, et al. Identification of a nonkinase target mediating cytotoxicity of novel kinase inhibitors Mol Cancer Ther 2008; 7: 3490-8.
[http://dx.doi.org/10.1158/1535-7163.MCT-08-0826] ]. This approach indicates the feasibility of a quantitative high-content analysis at least in a 96-well format [11Ross-Macdonald P, de Silva H, Guo Q, et al. Identification of a nonkinase target mediating cytotoxicity of novel kinase inhibitors Mol Cancer Ther 2008; 7: 3490-8.
[http://dx.doi.org/10.1158/1535-7163.MCT-08-0826] ]. In the present study, we seek to address the bi-directional polymerization or de-polymerization status in a 384-well screening assay format. The biologically relevant measurement parameters were identified using a set of compounds with known microtubule activity in an unbiased parameter screen. For benchmarking, we also compared the data from the high-content assay with a biochemical assay and a cell-cycle assay. Our results demonstrate that this high-content assay platform is sensitive, reproducible and correlates well with data generated using both the biochemical and cell cycle assays. Importantly, this assay can distinguish tubulin stabilizers from destabilizers and has been applied to profile compounds for tubulin activities. Finally, we expanded this high-content platform to multiple cellular response analyses linking mechanisms of tubulin interaction to associated cellular phenotypes.
MATERIALS AND METHODS
Reagents
Nocodazole was purchased from Sigma-Aldrich (St. Louis, MO). The anti-tubulin antibody (anti-α-Tubulin, CBL270) from rats was obtained from Millipore (Billerica, MA), and the anti-rat secondary antibody conjugated to Alexa488 was obtained from Life Technology (Carlsbad, CA). Other high-content reagents used in washing and blocking were obtained from ThermoFisher Scientific (Pittsburg, PA). Cell culture reagents were purchased from Life Technologies or Sigma.
Cell Culture
A549 and HCT116 cells from ATCC were grown in RPMI 1460 medium (Gibco) Life Technology (Carlsbad, CA) supplemented with 10% FBS (Sigma, St Louis, MO) and Penicillin-Streptomycin (Gibco). One day prior to assay, cells were harvested from tissue culture flasks and resuspended in growth medium in the absence of antibiotic and antifungal agents. Cells were seeded in 384-well clear bottom black-wall poly-D-lysine coated microplates (BD Falcon) at a density of 2,000 cells per well. The microplates were maintained at 37 °C in a CO2 incubator overnight until assay.
Tubulin High-Content Assay
The effect on cellular microtubule structure was assayed by treating the cells with increasing concentrations of compounds at 37 °C for either 3, 6 or 18 h. At the end of treatment, cells were fixed at room temperature with 4% formaldehyde freshly prepared in DPBS containing Ca2+ and Mg2+ (DPBS+/+) for 30 min. Fixed cells were washed twice with DPBS+/+, followed by a permeabilization step for 20 min using Permeabilization Buffer (ThermoFisher), and washing for two times in DPBS+/+. Cytoplasmic tubulin structures were stained using standard fluorescent staining technique. Blocking was performed for 1 h with 1X Blocking Buffer (ThermoFisher). The anti-α-tubulin rat primary antibody was diluted 1:125 in 1X Blocking Buffer and incubated overnight at 4 °C. The anti-rat secondary antibody conjugated to Alexa488 was used at 1:500 diluted in 1X Blocking Buffer for 3 h at room temperature. Hoechst33342 (Life Technology) was used for nuclear counter staining at 4 μg/mL and was included in the secondary antibody incubation step. Cells were washed twice with DPBS+/+ after each antibody incubation step. Fluorescent images were acquired on GE InCell 2000 high-content platform using a 20X objective.
Analysis of high-content images was carried via in GE Analysis Workstation using multi-target analysis. Segmentation was performed for nuclei, cytoplasmic and organelle structures. Tubulin staining was measured as general cytoplasmic staining or from identified organelle structures. In order to determine the proper measurements, all available parameters were measured and exported into Spotfire (Tibco) for comparison. Concentration-response curves were analyzed using GraphPad Prism v5 (La Jolla, CA), or by in-house data analysis software.
Tubulin Polymerization Fluorescence Assay
The direct effect of compounds on tubulin polymerization was determined in a biochemical fluorescent-based assay (Cytoskeleton, Denver, CO), essentially according to manufacturer’s protocol. Briefly, purified tubulin from porcine brain (2 mg/mL) in assay buffer (80 mM PIPES pH 6.9, 2.0 mM MgCl2, 0.5 mM EGTA) was allowed to polymerize in the presence of 1 mM GTP, along with 10% glycerol as a polymerization enhancer, as well as 6.3 μM DAPI to follow the extent of polymerization fluorimetrically. The reaction mixtures were incubated with increasing concentrations of compound in 384-well black wall microplates with a non-binding surface (Corning, Tewksbury, MA). Fluorescence changes were monitored kinetically in the Spectramax Gemini fluorescence plate reader (Molecular Devices, Sunnyvale, CA) at 37 °C for 1 h, using excitation at 360 nm and emission at 420 nm. Kinetic measurements were calculated by the area under the curve (AUC) using Softmax Pro v5.4.1 (Molecular Devices, Sunnyvale, CA). Data were analyzed using GraphPad Prism, or by in-house data analysis software.
Cell Cycle Assay
Cell cycle assays with HCT116 cells were carried out by treatment with compounds at 37 °C for 24 h. Cells were then fixed with 4% paraformaldehyde prepared in DPBS+/+ for 15 min, followed by washing two times in DPBS+/+ and blocking for 1 h at room temperature. Cells were permeabilized and labeled with anti-Phospho-Histone H3 (Ser) antibody (Cell Signaling, Danvers, MA) diluted 1:200 in blocking buffer for 1 h at RT and then anti-goat secondary antibody Alexa488 (Life Technology) at 1:1000 dilution along with DAPI at 5 μg/ml for nuclear staining.
RESULTS
Establishment of a High-Content Platform to Monitor Tubulin Activity
To establish a high throughput cellular based assay to quantify tubulin stabilization and destabilization, high content screening (HCS) was explored since the microtubule network in our model cell line A549 can be visualized by fluorescence staining with anti α-tubulin antibody (Fig. 1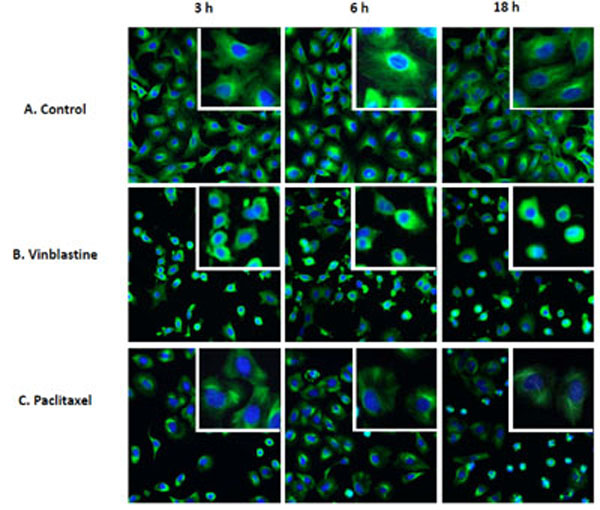 ). Compounds known to affect microtubule assembly were used as tool molecules to develop this tubulin activity assay. These tool molecules include colchicine, vinblastine, nocodazole and tubulysin, all of which disrupt microtubule assembly, as well as paclitaxel, which is known to stabilize microtubule assembly [4Jordan A, Hadfield JA, Lawrence NJ, McGown AT. Tubulin as a target for anticancer drugs: agents which interact with the mitotic spindle Med Res Rev 1998; 18: 259-96.
[http://dx.doi.org/10.1002/(SICI)1098-1128(199807)18:4<259::AID-MED3>3.0.CO;2-U] ]. We also included camptothecin, a DNA topoisomerase I inhibitor [12Hsiang YH, Hertzberg R, Hecht S, Liu LF. Camptothecin induces protein-linked DNA breaks via mammalian DNA topoisomerase I J Biol Chem 1985; 260: 14873-8.], and a compound known not to interact with tubulin. These latter two molecules were used as negative controls to assess the specificity of the assay. The HCS method was then optimized by adjusting cell number, fluorescent labeling conditions and exposure time during image acquisition. Fluorescent images of the tubulin network were acquired on the GE InCell 2000 high-content platform as in Fig. (1). As shown in the control, very fine microtubule strands that resemble the cytoskeletal network covering the entire cytoplasmic area were clearly observable in A549 cells (Fig. 1A). In agreement with its known effects on tubulin activity, the destabilizer, vinblastine, caused diffuse tubulin staining due to disruption of the microtubule network that occurred as soon as 3 h after treatment at 2 μM, and this effect could sustain up to 18 h (Fig. 1B). In terms of the cell morphology, cells treated with vinblastine became round and with visibly smaller cytoplasmic area. In contrast, 2 μM paclitaxel treatment led to thickening of the microtubule fibers that were observable as early as 3 h and as late as 18 h. Morphologically, cells became round after a 3-h treatment with paclitaxel, and at 18 h, a large number of cells showed condensed nulcei, suggesting apoptosis could be taking place (Fig. 1C). Moreover, those cells showing condensed nuclei appeared to have the tubulin structure completely collapsed, suggesting that these cells have died from severe toxicity. Overall, the results clearly indicate qualitatively distinguishable tubulin effects from different treatments and tubulin staining can be used to assess the activities of compounds on tubulin. To enable precise detection of time-dependent effect and concentration-dependent effect, there is a need to develop a method that quantifies the images in a way that capture the characteristic changes.

Development of a Quantification Method to Distinguish the Effects of Tubulin Stabilization and Destabilization
A challenge for developing a high-content assay for tubulin activity assessment was to determine the appropriate algorithm that can capture the opposing tubulin effects of stabilizers and destabilizers and thus reflect the observed effects on microtubule networks. To develop a quantification method, vinblastine, paclitaxel and a negative control were utilized in a concentration-response study with 6-h treatment. Image analysis was subsequently performed with the goal to identify response measurements that can robustly distinguish the opposing effect of microtubule stabilizers and destabilizers. Segmentation of the nuclei was achieved by the use of Hoechst nuclear stain, while segmentation of cellular boundary was achieved by means of the α-tubulin fluorescent staining. Furthermore, the tubulin structures in each cell are segmented as intracellular “organelle” objects (Fig. 2A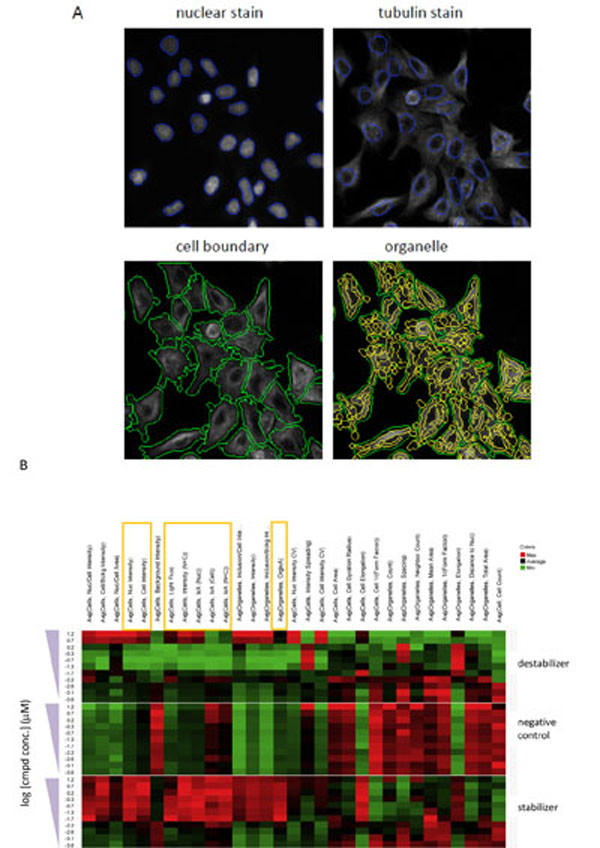 ). Quantification of the tubulin staining was performed by taking the tubulin structures as single cell objects or by prior segmentation of the structures as cytoplasmic “organelles”. Fig. (2B) shows a set of heat maps generated from such a concentration-response study with the test set, in which a number of different response measurements were taken for both the cell objects and organelles. These measurements can be grouped broadly into three categories: 1) measurements of intensity, 2) measurements of intensity distribution, and 3) morphological measurements (Table 1). Measurements of intensity include those that measure average intensity and total intensity (also called integrated intensity), whereas measurements of intensity distribution include those that provide a statistical description on the intensity signals. The morphological measurements are the object area, gyration, elongation and form factor (Table 1). As shown in Fig. (2B), the characteristic opposite effects of stabilizers and destabilizers are reflected by intensity measurements (category 1). Specifically, compared with the negative control, increasing concentrations of paclitaxel can result in increasing magnitude of the intensity measurements either in the cellular objects or in the identified organelle, while increasing concentrations of vinblastine lead to decreasing magnitude of the measurements, with exceptions at the two highest concentrations in which severe cytotoxicity caused the tubulin network to become collapsed and condensed (data not shown). In contrast, the opposing effects between stabilizers and destabilizers are not discernible with measurements from categories 2 and 3.

To further validate the quantification method, the response measurements in category 1 under different durations of compound treatment were analyzed (Fig. 3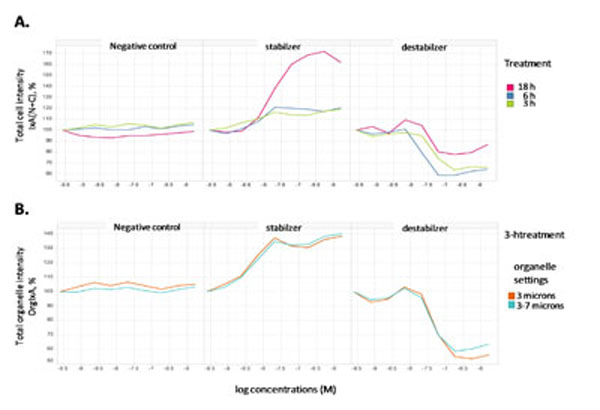 ). Total cell intensity [IxA(N+C)] measurements demonstrated significant differences comparing paclitaxel, vinblastine and the negative control compound (Fig. 3A). No significant change for the total cell intensity was found with the negative control at all time points. While paclitaxel showed dramatic increase of total cell intensity at 18 h, the increase could be due to the results of complete collapse of tubulin structure in those apoptotic cells which we have observed in Fig. (1C). The increase at 3 h and 6 h by paclitaxel, although moderate, was concentration-dependent and the similarity at both time points was consistent with the observations in Fig. (1). With vinblastine, clear decrease of total cell intensity was shown with at all three time points with the 18 h having the least effect, most likely due to cellular toxicity. To minimize the interference of cellular toxicity and dead cells, we focused on shorter treatment time and aim at identifying a readout in category 1 that significantly differentiates among negative control, vinblastine and paclitaxel. As shown in Fig. (3B), measurements of the organelle objects can yield good assay windows at 3h for both vinblastine and paclitaxel, with opposite trends. In addition, we compared the quantification for two different sizes of organelles identified during object segmentation. With either size, the resultant measurement is found to give a reasonable assay window for both paclitaxel and vinblastine. The average change with the stabilizer was 50±18% (n=5) and with the destabilizer was 57±7% (n=3), indicating consistency of the measurement. Therefore, we finalized the measurements of the organelle objects as our high content assay quantification method.

Validation of High-Content Analysis Assay
With the quantification method identified, we then examined the data reproducibility by comparing the estimated potency values from two experiments. Five compounds including both stabilizers and destabilizers were tested in two independent experiments. The measured potency values for each compound from the two experiments were plotted as individual symbols (Fig. 4A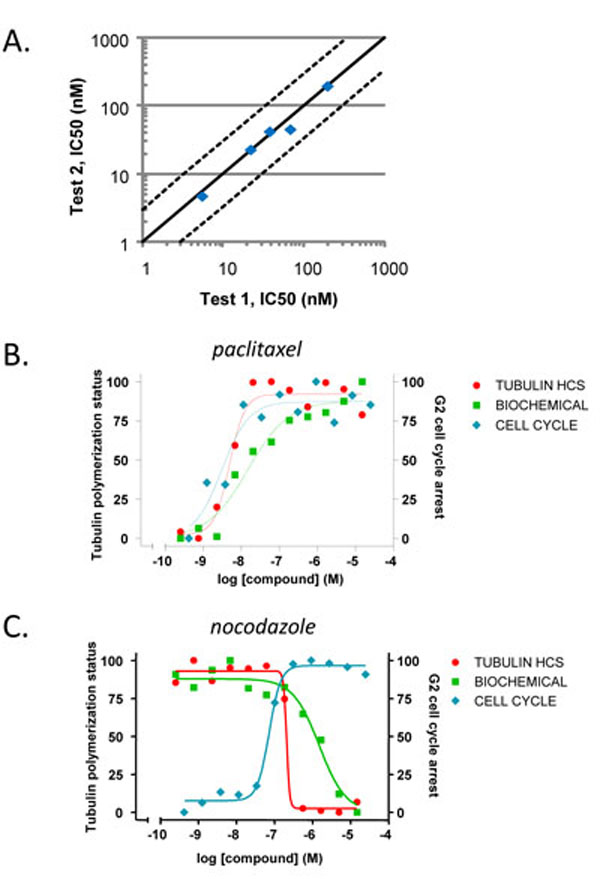 ). Regression analysis of the compound potency values yielded a slope of 0.96 and r2 = 0.98, suggesting tight correlation and therefore good assay reproducibility for this high-content approach.

To further validate the assay, we compared the measurements from the present high-content tubulin assay with biochemical and cell cycle assays (Fig. 4B, 4C and Table 2). As expected, paclitaxel demonstrated similar activities in high content analysis as in the cell cycle assay and the biochemical assay (Fig. 4B). The activities of the tubulin destabilizer nocodazole are comparable in the high-content analysis and the cell cycle assay, while its potency in the biochemical assay might be slightly weaker (Fig. 4C). The higher sensitivity observed when interrogating compounds in a cellular context can most likely be related to the availability of a milieu of associated proteins involved in regulating microtubule dynamics. Most importantly, the high-content assay enables us to distinguish the opposite effects of a stabilizer and a destabilizer similar to biochemical assays. In contrast, the cell cycle assay does not provide such differentiation. Taken together, these results highlight the value derived from an HCS approach to monitoring tubulin dynamics. All those results indicate that the established high-content analysis not only distinguishes tubulin stabilizers from destabilizers as biochemical assays, but also reflects cellular environment.
Expansion of High-Content Assay to Multiple Response Analysis
An added advantage of the high-content assay is the ability to measure multiple response parameters. Hence, we examine the different measurements and noted a concentration-dependent effect of both stabilizers and destabilizers on cell shapes, cell areas and cell counts (Fig. 5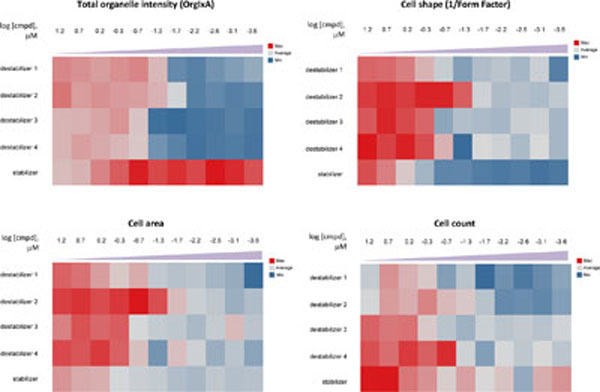 ). This observation is in line with the actions of these compounds on cytoskeleton; such effects are especially reflected by cell shape measurement. Consequently, these additional phenotypic measurements could be useful to verify the mechanisms of action of these compounds.

Applying this multiple response analysis approach, we performed a dose-response study for a small set of compounds to monitor both tubulin activity and cell shape. The results from this study are shown in Fig. (6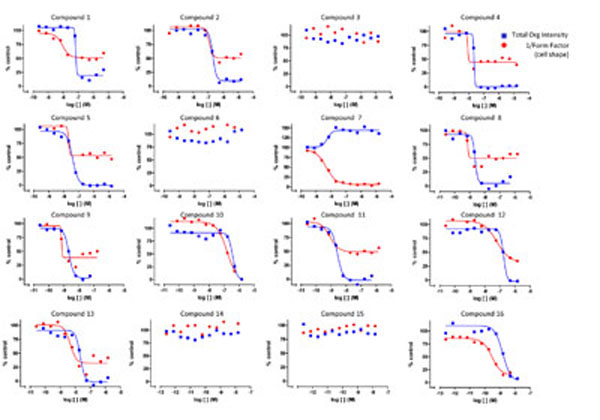 ). It can be seen that compound 7 is a stabilizer and induces a change in cell shape, whereas compounds 3, 6, 14 and 15 lack tubulin activity and do not cause any associated morphological change. The remaining compounds appear to be tubulin destabilizers with relatively similar efficacies on tubulin. However, their specific effect on cell shape can be different from each other. For example, compounds 10 and 16 have similar activities in effecting changes in cell shape, while compounds 1, 2, 4, 5, 8, 9, 11, 12 and 13 differ from compounds 10 and 16 in their efficacy at inducing changes in cell shape. While the reason for this is not understood, these different profiles suggest distinct underlying mechanisms of action for these compounds. Such profiling data could potentially provide evidence for differentiation of compounds.

DISCUSSION
We have established a high-content based platform that directly measures the effects of small molecules on tubulin status in cells. This high-content platform not only demonstrates the same trend of tubulin stabilizing and destabilizing activities as the biochemical methods do, but it also offers a cell-based environment to further dissect the abilities of compounds to enter the cells and to affect tubulin in the associated cellular protein complex. Furthermore, this cell-based high-content analysis provides a more sensitive readout for tubulin polymerization as reflected by increased compound potencies compared to corresponding biochemical assay results. Therefore, this high-content analysis could be employed as a primary cell-based assay to determine the compound tubulin activity for structure-activity relationship studies. Additionally, it can be applied as a liability assay when tubulin effect might be undesirable. Hence, the assay can find broad utility in oncology and other types of drug discovery programs. Compared with other cellular assays used to evaluate tubulin agents in the past, such as cell cycle analysis, our direct tubulin assay allows tubulin stabilizers to be distinguished from destabilizers; Also, we optimized our assay for compound treatment at 3 hours to avoid the complication of compound cytotoxicity from longer time treatments. Moreover, this analysis can be coupled to the evaluation of various phenotypic cellular endpoints to further characterize the cellular effects by the compounds. In our study, we further demonstrated that multi-response analysis could help to differentiate compounds that may otherwise all appear to have similar effects on tubulin. The differentiation of compound cellular activities could provide mechanistic insight and play a critical role in the final selection of drug candidates. The positive compounds identified from this study could be followed up in proliferation assays to assess their effects on cell growth in a panel of cell lines. On the other hand, biochemical analyses can be performed to further address their mechanisms of action. Tubulin-active compounds have been shown to bind to various distinct sites on tubulin [4Jordan A, Hadfield JA, Lawrence NJ, McGown AT. Tubulin as a target for anticancer drugs: agents which interact with the mitotic spindle Med Res Rev 1998; 18: 259-96.
[http://dx.doi.org/10.1002/(SICI)1098-1128(199807)18:4<259::AID-MED3>3.0.CO;2-U] ]. Competitive radioligand binding assays can be performed to determine the sites of interaction. Recently, competitive mass spectrometry binding assay has been applied to determine compound binding to colchicine-, vinblastine- and or paclitaxel-binding sites in tubulin [13Li CM, Lu Y, Ahn S, Narayanan R, Miller DD, Dalton JT. Competitive mass spectrometry binding assay for characterization of three binding sites of tubulin J Mass Spectrom 2010; 45: 1160-6.
[http://dx.doi.org/10.1002/jms.1804] ].
Although this high content platform confirmed certain advantages as we have highlighted here, it still faces some challenges. While high-content assays can be implemented on an automated platform and are amenable to a high throughput setting, the data acquisition is still relatively time consuming. One general disadvantage about high-content assays compared with the majority of other types of cell-based assays is that the size and number of image files produced by the platform can be considerably large, requiring a database solution. Fortunately, data storage nowadays is more affordable than in the past, and multiple database solutions are currently available. Another challenge of developing a high-content assay is to establish an optimal quantification algorithm that accurately reflects the biological response. We approached these issues systematically by first assessing the different response measurements in a heat map, from which we then determined a number of possible response measurements for further validation. Additionally, we examined the assay window given by the selected measurements to assess their sensitivity under the desirable assay conditions. We also addressed the reproducibility of the measurements and compared the data across different assay platforms, as would be the case for assay development for any other platform. This systematic approach can be applied generally to facilitate the development of any high content assay.
CONFLICT OF INTEREST
The authors are employees of Bristol-Myers Squibb Company.
ACKNOWLEDGEMENTS
We would like to acknowledge the cell culture support from Cellular Resource Group, especially, Zia Lozewski. We also thank Mike Lenard, Normand Cloutier and Mike Thibeault for their efforts in the establishment of high-content platform at Hopewell site at Bristol-Myers Squibb Company.
REFERENCES
| [1] | Desai A, Mitchison TJ. Microtubule polymerization dynamics Annu Rev Cell Dev Biol 1997; 13: 83-117. [http://dx.doi.org/10.1146/annurev.cellbio.13.1.83] |
| [2] | Hamm-Alvarez SF, Sheetz MP. Microtubule-dependent vesicle transport: modulation of channel and transporter activity in liver and kidney Physiol Rev 1998; 78: 1109-29. |
| [3] | Amos LA, Lowe J. How Taxol stabilises microtubule structure Chem Biol 1999; 6: R65-9. [http://dx.doi.org/10.1016/S1074-5521(99)89002-4] |
| [4] | Jordan A, Hadfield JA, Lawrence NJ, McGown AT. Tubulin as a target for anticancer drugs: agents which interact with the mitotic spindle Med Res Rev 1998; 18: 259-96. [http://dx.doi.org/10.1002/(SICI)1098-1128(199807)18:4<259::AID-MED3>3.0.CO;2-U] |
| [5] | Shelanski ML, Gaskin F, Cantor CR. Microtubule assembly in the absence of added nucleotides Proc Natl Acad Sci USA 1973; 70: 765-8. [http://dx.doi.org/10.1073/pnas.70.3.765] |
| [6] | Gaskin F. Analysis of microtubule assembly kinetics using turbidimetry Methods Mol Biol 2011; 777: 99-105. [http://dx.doi.org/10.1007/978-1-61779-252-6_7] |
| [7] | Bonne D, Heusele C, Simon C, Pantaloni D. 4',6-Diamidino-2-phenylindole, a fluorescent probe for tubulin and microtubules J Biol Chem 1985; 260: 2819-5. |
| [8] | Khalil MW, Sasse F, Lunsdorf H, Elnakady YA, Reichenbach H. Mechanism of action of tubulysin, an antimitotic peptide from myxobacteria Chembiochem 2006; 7: 678-83. [http://dx.doi.org/10.1002/cbic.200500421] |
| [9] | Ma YM, Zhou YB, Xie CM, Chen DM, Li J. Novel microtubule-targeted agent 6-chloro-4-(methoxyphenyl) coumarin induces G(2)-M arrest and apoptosis in HeLa cells Acta Pharmacol Sin 2012; 33: 407-17. [http://dx.doi.org/10.1038/aps.2011.176] |
| [10] | Bhalla KN. Microtubule-targeted anticancer agents and apoptosis Oncogene 2003; 22: 9075-86. [http://dx.doi.org/10.1038/sj.onc.1207233] |
| [11] | Ross-Macdonald P, de Silva H, Guo Q, et al. Identification of a nonkinase target mediating cytotoxicity of novel kinase inhibitors Mol Cancer Ther 2008; 7: 3490-8. [http://dx.doi.org/10.1158/1535-7163.MCT-08-0826] |
| [12] | Hsiang YH, Hertzberg R, Hecht S, Liu LF. Camptothecin induces protein-linked DNA breaks via mammalian DNA topoisomerase I J Biol Chem 1985; 260: 14873-8. |
| [13] | Li CM, Lu Y, Ahn S, Narayanan R, Miller DD, Dalton JT. Competitive mass spectrometry binding assay for characterization of three binding sites of tubulin J Mass Spectrom 2010; 45: 1160-6. [http://dx.doi.org/10.1002/jms.1804] |