- Home
- About Journals
-
Information for Authors/ReviewersEditorial Policies
Publication Fee
Publication Cycle - Process Flowchart
Online Manuscript Submission and Tracking System
Publishing Ethics and Rectitude
Authorship
Author Benefits
Reviewer Guidelines
Guest Editor Guidelines
Peer Review Workflow
Quick Track Option
Copyediting Services
Bentham Open Membership
Bentham Open Advisory Board
Archiving Policies
Fabricating and Stating False Information
Post Publication Discussions and Corrections
Editorial Management
Advertise With Us
Funding Agencies
Rate List
Kudos
General FAQs
Special Fee Waivers and Discounts
- Contact
- Help
- About Us
- Search


Current Chemical Genomics and Translational Medicine
(Discontinued)
ISSN: 2213-9885 ― Volume 12, 2018
Identifying Small Molecules which Inhibit Autophagy: a Phenotypic Screen Using Image-Based High-Content Cell Analysis
J.V. Peppard1, *, C. Rugg1, M. Smicker1, C. Dureuil2, B. Ronan2, O. Flamand2, L. Durand2, B. Pasquier2, *
Abstract
Autophagy plays an important role in cancer and it has been suggested that it functions not only as a tumor suppressor pathway to prevent tumor initiation, but also as a pro-survival pathway that helps tumor cells endure metabolic stress and resist death triggered by chemotherapeutic agents, including acquired resistance. We aimed to identify small-molecule autophagy inhibitors using a HTS/HCA approach through a phenotypic, cell image-based assay, in order to screen multiple biological targets simultaneously and to screen compounds in a physiologically relevant environment. LC3 is a component of the autophagosome, which undergoes a cytoplasmic redistribution from diffuse to punctate dots during autophagy. We employed HeLa cells stably expressing EGFP-LC3 in a primary phenotypic screen. As a first step, a “Validation Library” of about 8,000 pre-selected compounds, about 25% of which had known biological activity and the others representing a range of chemical structures, was run in duplicate both to assess screening suitability and likely hit rate, and to give a valuable preview of possible active structures or biological targets. The primary screen of about 0.25 million compounds yielded around 10,500 positive compounds. These were tested in a suite of further cellular assays designed to eliminate unwanted positives, together with the application of chemi- and bioinformatics to pick out compounds with known biological activity. These processes enabled the selection of compounds that were the most promisingly active and specific. The screening “tree” identified, amongst others with as yet unidentified targets, chemical series active against autophagy-relevant biological targets ULK or Vsp34, validating the phenotypic screening methods selected. Finally, about 400 compounds were fully qualified after following this triage. The development of the assays, compound screening process and the compound triage is described.
Article Information
Identifiers and Pagination:
Year: 2014Volume: 8
Issue: Suppl-1
First Page: 3
Last Page: 15
Publisher Id: CCGTM-8-3
DOI: 10.2174/2213988501408010003
Article History:
Received Date: 21/10/2013Revision Received Date: 10/11/2013
Acceptance Date: 25/11/2013
Electronic publication date: 7/2/2014
Collection year: 2014
open-access license: This is an open access article licensed under the terms of the Creative Commons Attribution Non-Commercial License (http://creativecommons.org/licenses/by-nc/3.0/) which permits unrestricted, non-commercial use, distribution and reproduction in any medium, provided the work is properly cited.
* Address correspondence to these authors at the Sanofi Tucson Innovation Center, 2090 Innovation Park Drive, Tucson, Arizona 85755, U.S.A; Tel +1 520 544 6875; Fax +1 520 544 6804; E-mail: jane.peppard@sanofi, and Oncology R&D, Sanofi, 94403 Vitry-sur-Seine, France; Tel +33 1 58 93 89 93; Fax: +33 1 58 93 34 71; E-mail: benoit.pasquier@sanofi.com
| Open Peer Review Details | |||
|---|---|---|---|
| Manuscript submitted on 21-10-2013 |
Original Manuscript | Identifying Small Molecules which Inhibit Autophagy: a Phenotypic Screen Using Image-Based High-Content Cell Analysis | |
INTRODUCTION
Autophagy (from the Greek, “auto”: oneself; “phagy”: to eat) refers to a cellular degradation pathway that involves delivery of cytoplasmic cargo sequestered inside double-membraned vesicles to the lysosome. The cellular events during autophagy follow distinct stages (Fig. 1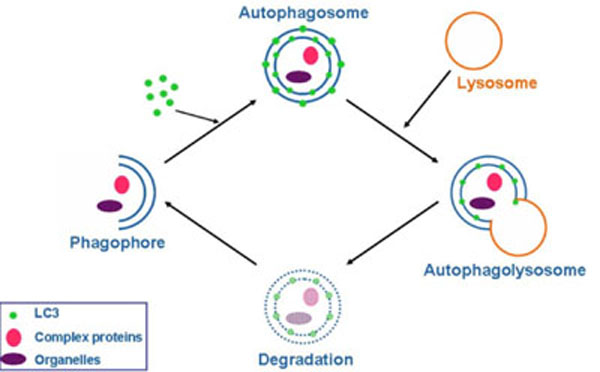 ): vesicle nucleation (formation of the isolation membrane/phagophore), vesicle elongation and completion, fusion of the double-membraned auto phagosome with the lysosome to form an auto-lysosome, and finally, lysis of the autolysosomal contents and recycling of nutrients. Basal autophagy is necessary for most cells to eliminate protein aggregates and damaged organelles and can be rapidly upregulated during various pathological and physiological states, such as starvation. Starvation–induced autophagy enables the degradation of proteins, carbohydrates and lipids, which allows the cell to adapt its metabolism and meet its energy needs. Cancer is the first disease that was linked to autophagy. The prevailing current view is that autophagy functions both as a tumor suppressor pathway that prevents tumor initiation, and as a pro-survival pathway that helps tumor cells endure metabolic stress and resist death triggered by chemotherapeutic agents. Autophagy may also contribute to acquired resistance of tumor cells to chemotherapeutic agents [1Rubinsztein DC, Codogno P, Levine B. Autophagy modulation as a potential therapeutic target for diverse diseases Nat Rev Drug Discov 2012; 11: 709-30.
[http://dx.doi.org/10.1038/nrd3802] , 2Choi AMK, Ryter SW, Levine B. Autophagy in human health and disease N Engl J Med 2013; 368: 651-2.
[http://dx.doi.org/10.1056/NEJMra1205406] ].

The cellular pathway to autophagy has been well studied on the molecular level [2Choi AMK, Ryter SW, Levine B. Autophagy in human health and disease N Engl J Med 2013; 368: 651-2.
[http://dx.doi.org/10.1056/NEJMra1205406] , 3Codogno P, Merhpour M, Proikas-Cezanne T. Canonical and non-canonical autophagy: variations on a common theme of self-eating? Nat Rev Mol Cell Biol 2012; 13: 7-12.]. Autophagy is negatively regulated by the serine/threonine kinase mammalian Target of Rapamycin (mTOR) which acts upstream of the UNC-51-like kinase 1 (ULK1) complex. Autophagy can be induced by inhibiting mTOR complex 1 (mTORC1) using starvation or inhibitors such as rapamycin. Another key regulator is the Beclin 1 complex, a regulatory platform, consisting of Beclin 1, the Class III phosphatidylinositol 3-kinase (PI3KC3/V-ps34) and the autophagy-related gene (Atg) protein Atg14L. The activity of PI3KC3/Vps34 is regulated during starvation and generates the phosphatidylinositol 3-phosphate (PtdIns3P) required for the onset of autophagosomal membrane nucleation. Two ubiquitin-like protein conjugation systems are also necessary for the formation of the autophagosome, the Atg5-Atg12 and the microtubule-associated protein 1 light-chain 3 (MAP1LC3/Atg8, hereafter called LC3) systems. In the LC3 system, cytosolic LC3 is cleaved by the protease Atg4 (LC3-I) then converted to phosphatidylethanolamine (PE) at the autophagosomal membrane (LC3-II) by ATG7/ATG3. LC3 has multiple functions in autophagy, including expansion and fusion of autophagosomes. LC3 status can serve as a biomarker for autophagy, and by fluorescently tagging LC3, autophagosomes can be detected and their localization patterns observed [4Klionsky DJ, Abeliovich H, Agostinis P, et al. Guidelines for the use and interpretation of assays for monitoring autophagy in higher eukaryotes Autophagy 2008; 4: 151-75., 5Mizushima N, Yoshimori T, Levine B. Methods in mammalian autophagy research Cell 2010; 140: 313-25.
[http://dx.doi.org/10.1016/j.cell.2010.01.028] ].
Because of the lack of specific autophagy inhibitors and the potential therapeutic applications in cancer [1Rubinsztein DC, Codogno P, Levine B. Autophagy modulation as a potential therapeutic target for diverse diseases Nat Rev Drug Discov 2012; 11: 709-30.
[http://dx.doi.org/10.1038/nrd3802] , 2Choi AMK, Ryter SW, Levine B. Autophagy in human health and disease N Engl J Med 2013; 368: 651-2.
[http://dx.doi.org/10.1056/NEJMra1205406] ], we aimed to identify small molecule autophagy inhibitors using the Sanofi chemical library. We chose to approach the screen with a phenotypic, cell image-based assay, rather than selecting from the multitude of potential molecular targets, in order to cast our net wide and to screen compounds in the more physiologically relevant environment of intact cells. In the primary screen, HeLa cells stably transfected with EGFP-LC3 were starved and the formation of EGFP-containing “granules” was quantitated by cell image analysis to identify inhibitors of autophagosome formation, an early step in the autophagy process. We also designed a screening tree with the aim to first identify all possible autophagy inhibitors with the primary screen and then actively filter this compound set in order to home in on the compounds most specific and suitable for our targeted pathway. A suite of phenotypic cellular assays was set up and only compounds qualifying through this filtering process were accepted as true positives. Here, we describe the screening progression and the immediate outcome of this phenotypic approach to small molecule screening.
MATERIALS AND METHODS
Reagents & Equipment
Unless otherwise specified, all chemicals were purchased from Sigma-Aldrich (St. Louis, MO); tissue culture reagents and supplies from Life Technologies (Carlsbad, CA), Corning (Tewksbury, MA) or Thermo-Fisher Scientific (Waltham, MA). Draq5 was purchased from Biostatus (Shepshed, UK). Multiwell plates were purchased from Greiner BioOne (Monroe, CA), Corning or Matrical Bioscience (Spokane, WA). Bulk reagents (cells, medium, etc.) were dispensed to all plate wells with a Multidrop Combi (Thermo-Fisher) or a Matrix Wellmate fitted with plate stackers (Thermo-Fisher), and compounds transferred with a CyBi®-Well 384-channel simultaneous pipettor (CyBio, Boston, MA). Serial dilutions of compounds were performed using a BioMek FX® (Beckman Coulter, Brea, CA). Multi-well plates were washed with either a Skatron EMBLA-384 (Molecular Devices, Sunnyvale, CA) or Bio-TekEL405TM (Winooski, VT) platewasher; washers were presterilized with bleach, then ethanol and flushed thoroughly with sterile water before use. The IN Cell Analyzer 3000, a confocal line-scanning instrument, along with cell analysis software modules, was purchased from GE Life Sciences (Piscataway, NJ).
HeLa EGFP-LC3 Clone C10 Cells
EGFP-wild type LC3B plasmid was constructed as follows. The LC3B coding sequence was amplified from EST clone BC015810.1 (IMAGE) by PCR and then cloned into pEGFP-C1 (Clontech, Mountain View, CA). The resulting plasmid allowed the expression of EGFP-LC3B fusion protein under CMV promoter control. HeLa cells (ATCC, Manassas, VA) were stably transfected with EGFP-wild type LC3B plasmid using Fugene 6 (Roche Applied Science, Indianapolis, IN). Cells were then sorted based on EGFP intensity using a FACSDiva (Becton Dickinson, San Jose, CA) and single-cell derived clonal populations with high EGFP expression generated. HeLa EGFP-LC3 Clone C10 was selected based on fluorescence intensity (Fig. 2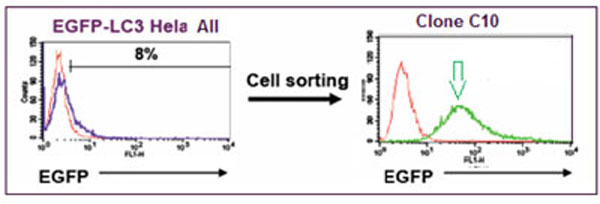 ) using a FACSCalibur (Becton Dickinson) and on EGFP-LC3 grains observed by iCyte (Compucyte, Cambridge, MA). A lack of Pgp expression, desirable when screening compounds that may otherwise be pumped out of the cell, was confirmed using PE-conjugated anti-Pgp antibody (Becton Dickinson) with cells analyzed on the FACSCalibur. EGFP expression in these cells was monitored over time and found to be stable until at least passage 18. In preparation for screening, a large single batch of cells at passage 5 was frozen in vials in liquid nitrogen, and to maintain assay performance, cells were kept in culture only until passage 18 and then replaced with a fresh vial of cells.

Cell Assays Used in the Screening Tree
Three assays were set up for identifying active inhibitors of autophagy. For simplicity, the methods detailed in this section are the final protocols used in screening. Details of the assay development strategy are described in Results.
1. Primary Screen: Cell Imaging Assay for Autophagy
HeLa EGFP-LC3 Clone C10 cells were expanded in growth medium (DMEM high glucose with glutamine, supplemented with 10% FBS (heat inactivated, qualified), 100 units/ml Penicillin/Streptomycin and 1 mg/ml Geneticin) and detached from culture flasks using 0.05% Trypsin-EDTA. Cells were plated (4,000/well in 50 µl growth medium) into 384 well black-walled, glass bottom assay plates (Matrical) and incubated at 37ºC/ 5% CO2 overnight. After washing the cells three times (80 µl Earle’s Balanced Salt Solution, EBSS) with an EMBLA-384 washer, 40 µl EBSS was left in the wells and 5 µl compounds or controls added directly at 10x final concentration. Screening compounds were tested at 10 µM/0.3% DMSO (final); autophagy inhibitor control was 33 nM wortmannin/0.3% DMSO, negative (starvation, positive autophagy) control was 0.3% DMSO. To inhibit lysosomal breakdown of phagosomes, hydroxychloroquine sulfate (HC) was diluted in EBSS and 5 µl was added to all wells (10 µM final). Cells were incubated at 37ºC/ 5% CO2 for 2 hr.
To fix and stain the cells, 25 µl of 12% formaldehyde in Dulbecco’s phosphate-buffered saline (DPBS) was added to all wells (4% final). Plates were incubated at 4°C overnight, fixative was aspirated from wells and cells washed three times with 80 µl EBSS using a plate washer with a final aspiration leaving 15 µl volume. The nuclear stain Draq5 (50 µl in DPBS, 146 nM final) was added and incubated in the dark at room temperature for 2 hr whereupon cells were washed three times with 80 µl DPBS, leaving the final 80 µl in the well. Plates were sealed with black tape and stored at 4°C. Plates were imaged within 24 hr on the IN Cell Analyzer 3000 using 488 nm (excitation) and emission filter 535-45 nm for EGFP and 647 nm/695-55 nm for Draq5, and analyzed in-line using the Granularity Analysis Module GRN1 image analysis module of the IN Cell analysis software.
2. Counterscreen: Effect of Compound on Cell Viability using the Parental HeLa Cell Line in Full Growth Medium
Cell viability of wild type (WT) HeLa cells was determined in the presence of test compounds at the same concentration used in the primary screen. Cells were detached from culture flasks using 0.05% Trypsin-EDTA and plated into Falcon 384-well white solid bottom assay plates: 1,500 cells in 45 µl growth medium were added to each well and plates incubated at 37ºC/ 5% CO2 overnight. Cells were treated with 5 µl test compounds at 10 µM / 0.3% DMSO, where maximum toxicity (high control) was defined by 3.3 µM staurosporine/0.3% DMSO and compared to the low control defined by 0.3% DMSO. After a further 24 hr incubation, viability was determined with the CellTiter-Blue® Cell Viability Assay (Promega, Madison, WI) as recommended by the manufacturers, and the fluorescent signal was read on an EnVision® plate reader (Perkin Elmer, Waltham, MA).
3. Secondary assay: effect of compound on cell viability in an alternate tumor cell line H1299 with or without nutrient starvation for 48 hr
The primary screen was aimed at identifying compounds that inhibit autophagy in starved HeLa cells. Ideally for our purpose, these compounds should reduce cell viability in low nutrient conditions but have little or no effect in high nutrient conditions. A 24 hr full-growth medium assay of HeLa cells was used for the counterscreen but as a final check we added a secondary assay into the screening tree to compare in parallel the effect of compounds on cell viability in the presence or absence of nutrients. As an added filter a different cell line was selected, the human lung carcinoma cell line H1299.
H1299 cells (obtained from ATCC) were expanded in growth medium (RPMI-1640 supplemented with 10% FBS (Heat inactivated, qualified) and 100 units/ml Penicillin/Streptomycin) and detached from culture flasks using 0.05% Trypsin-EDTA. Either 500 (for growth medium) or 2,000 (for starvation medium) cells in 45 µl growth medium were added to each well of 384-well white solid bottom tissue culture plates using a WellMate and plates were incubated at 37ºC/ 5% CO2 over night. The next day, medium was removed and replaced as appropriate with either 45 µl of growth medium or starvation medium (EBSS plus 100 units/ml Penicillin/Streptomycin). A 5 µl volume of compound (10x final concentration) in EBSS was added and the plates were incubated for a further 48 hr. Cell viability was assessed with CellTiter-Blue® Cell Viability Assay as before and the fluorescent signal was read on an EnVision® plate reader.
Data Analysis
Data were analyzed using Microsoft Excel (Redmond, WA), Spotfire® (TIBCO, Palo Alto, CA), and GeneData Screener® (Lexington, MA), as well as automated image analysis using the software provided with the IN Cell as already described. Images and associated data were stored on the Cellomics® Store database (Thermo-Fisher) and retrieved and further processed for analysis via Screener®. Compound plate maps were retrieved from ActivityBase (IDBS, Bridgewater, NJ) and associated with image-based data via Screener®. In the primary assay, compound plates were set up as shown in Fig. (3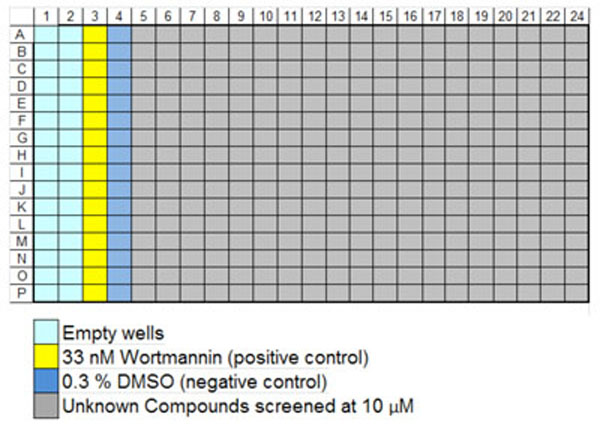 ) and run at 10 µM in singlicate. Averaged intra-plate assay controls (maximal inhibition vs. no inhibition) were used to normalize results obtained with the compounds in each plate, and determine the plate Z’ [6Zhang JH, Chung TDY, Oldenburg KR. A simple statistical parameter for use in evaluation and validation of high throughput screening assays J Biomol Screening 1999; 4: 67-73.
[http://dx.doi.org/10.1177/108705719900400206] ].

RESULTS
Cell Assay and Image Analysis to Detect Early Autophagy: Assay Development
In the initial set-up for image analysis, HeLa-EGFP-LC3 Clone 10 cells were nutrient starved and then incubated for 2 hours with test compound in the presence of the lysosomotropic agent Hydroxychloroquine (HC). Inhibiting lysosome function with HC blocks the final degradation of EGFP-LC3 in the lysosome [4Klionsky DJ, Abeliovich H, Agostinis P, et al. Guidelines for the use and interpretation of assays for monitoring autophagy in higher eukaryotes Autophagy 2008; 4: 151-75., 5Mizushima N, Yoshimori T, Levine B. Methods in mammalian autophagy research Cell 2010; 140: 313-25.
[http://dx.doi.org/10.1016/j.cell.2010.01.028] ] and thus increases the numbers of fluorescently labeled autophagosomes available for imaging. Cells were imaged on the IN Cell Analyzer 3000, an automated, line-scanning confocal cell imager, with on-the-fly cell feature analysis using the Granularity Analysis Module GRN1. In this algorithm, cells are first identified by their nuclear stain and a measurement region for each cell is defined from the nucleus. Intense fluorescently areas (‘grains’) within this region are identified and analyzed (Fig. 4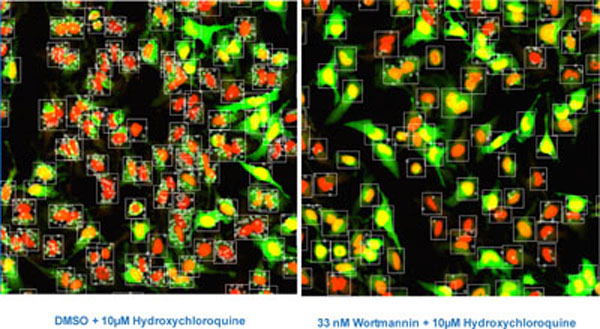 ). In our assay, these grains represent the accumulated EGFP-LC3 labeled autophagosomes. The algorithm reports features for each cell selected for analysis in the well and well-level statistics are computed from these cell-level features. The features selected for analysis are shown in Table 1.

As a first step, optimal concentrations of HC and wortmannin were determined. HeLa-EGFP-LC3 cells were set up in 384-well plates as described in Materials and Methods, transferred to EBSS and treated for 2 hr with a concentration range of both compounds as indicated. The images were analyzed to determine the % cells/well with, initially, >4 grains per cell. Incubation with either 5 or 10 µṂ HC produced similar IC50 values for wortmannin (Fig. 5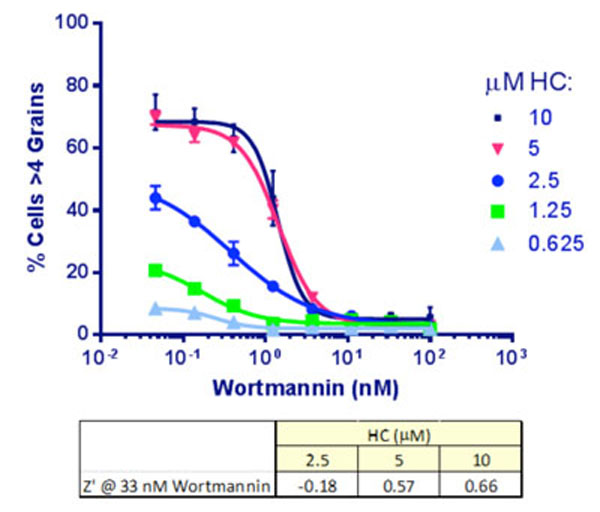 ). We chose 33 nM wortmannin to provide the positive (max. inhibition) control. At this concentration of wortmannin, increasing HC was found, as expected, to improve the signal and the Z’ values [6Zhang JH, Chung TDY, Oldenburg KR. A simple statistical parameter for use in evaluation and validation of high throughput screening assays J Biomol Screening 1999; 4: 67-73.
[http://dx.doi.org/10.1177/108705719900400206] ] by inhibiting the dynamic lysosomal degradation of the autophagosomes: 10 µM HC was chosen for inclusion in the assay.

Next, the effects on the assay signal of increasing compound incubation times were compared, adding 10 µṂ HC immediately after compound addition. The response to wortmannin was already maximal by 2 hr starvation (Fig 6A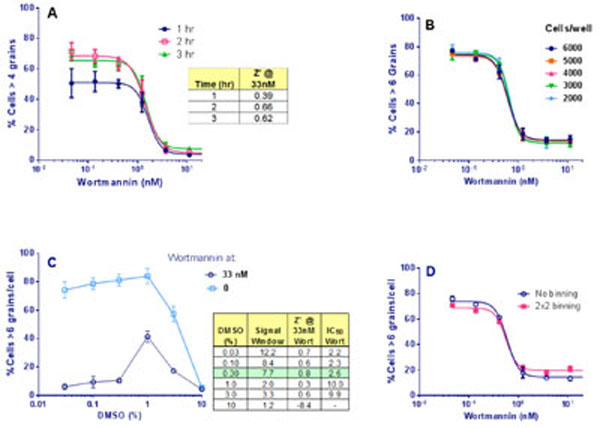 ). Therefore, we selected a starvation time of 2 hr post compound and HC addition.

The IN Cell 3000 is a semi-confocal instrument and until this stage we had been using plastic imaging plates, but now switched to glass plates from Matrical, glass being a more suitable medium for high resolution imaging. The number of grains resolved per cell was observed to increase upon this plate change due to the sharper images obtained. We therefore increased the response threshold, from >4 to >6 grains/cell. Finally, a cell number titration and DMSO titration were completed. Similar statistics were achieved for all cell concentrations chosen (Fig. 6B), and DMSO was found to have no effect at ≤ 0.3% (Fig. 6C). Therefore, the screening assay protocol was set to 4,000 cells per well with a final DMSO concentration of 0.3%.
Image binning combines pixels together and sums their intensity. It increases scan and image analysis speeds and reduces the size of data files, and therefore is very beneficial for HTS. However, binning decreases image resolution. To determine if image binning was feasible for this assay, cells were treated as already described and imaged on the IN Cell 3000. The images were then analyzed using either no binning or 2x2 binning to determine % cells with > 6 grains per cell. Binning had no effect on Z’, or wortmannin IC50 values (Fig. 6D) and so 2x2 image binning was adopted for primary screening. Under these conditions each 384-well plate took 30 min to acquire and analyze.
Primary Screening
Transitioning from assay development to primary screening involved an assay qualification step, whereby a “Validation Library” of about 8,000 pre-selected compounds was run on two separate days using reagents and equipment configured identically with the planned screening process. This step allowed us to check the reproducibility of compound activity in the assay, get a projected expected hit rate, and also assess the plate to plate variability in terms of Z’, before committing to an entire screen. A reasonable correlation was observed between % activities of compounds on the 2 days (Fig. 7A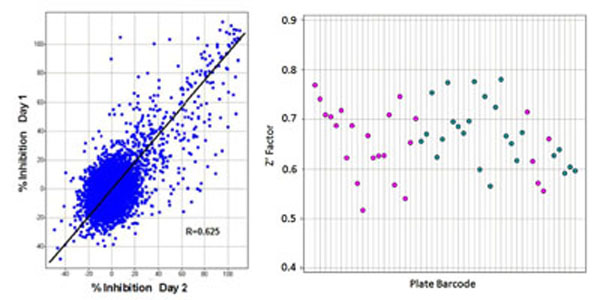 ). From our assay development we were expecting a Z’ for controls well above our minimum acceptable level of >0.4 for a cell-based screen, and this was achieved for all plates, with an average Z’ of 0.66 (Fig. 7B). The assay was accepted into HTS and went on to test around 240,000 more compounds in the primary screen. The screening assay was run with the aid of a small robotics assembly consisting of a Thermo-Fisher CatX robot and plate “hotel” feeding a Combi and the plates were read off-line on the IN Cell 3000, usually overnight. Statistics for the primary screen followed those of the validation screen closely, with the excellent plate Z’ being maintained and very few repeat assays required. With a cut-off of >30% inhibition of grain formation, a hit rate of 2.8% was obtained, about 10,500 compounds (Fig. 8
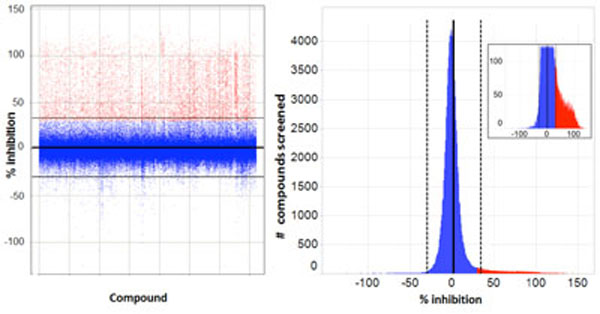 ).
).


Reanalysis of Archived Images
As with many large compound libraries, a certain number of fluorescent compounds interfering with the GFP or Draq5 readout through actually binding to cells are present in the collection. Also, a number of compounds will be significantly cytotoxic even in a 2-hr assay. Example images of such compounds are shown in Fig. (9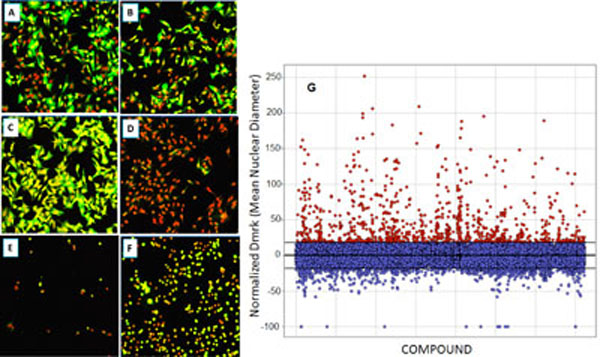 ), A-F. Quantitative cell image analysis allowed us to set additional criteria to identify these categories. Therefore, following the completion of primary screening, fluorescent, quenching and acutely toxic compounds were picked out by applying a secondary data analysis. Highly fluorescent compounds staining cells are easily identified since they produce an increase in Icyt (average GFP intensity in cytoplasmic region), and this is often accompanied by an increase in Dmrk (average nuclear diameter) because fluorescent compounds can interfere with nuclear mask determination. GFP quenchers produce a decrease in Icyt values. Toxic compounds can be identified using the features Npass, Icyt and Dmrk. Acutely toxic compounds reduce the number of cells analyzed per well (Npass), and compounds that do not reduce cell number but produce undesirable morphological changes such as nuclear shrinkage and cell rounding, will decrease Icyt and Dmrk values significantly as compared to controls. Such false positive or undesirable compounds were filtered by eliminating those that reduce raw Npass values in 4 fields of view to below 200 cells (this represents about an 80% reduction in cell number) or increase, or decrease, normalized Dmrk and Icyt values by more than 3 standard deviations from mean control values (Fig . 9G). Example data from such compounds are shown in Table 2.
 |
Fig. (9) Compound qualification: example images (20x) of cells after treatment with compounds excluded through the secondary data analysis; Green – EGFP channel fluorescence, Red – nuclear channel fluorescence. (A): Positive control (0.3% DMSO); (B): Negative Control (33 nM wortmannin); (C): Fluorescent compound; (D): EGFP quenching compound; (E): very toxic compound; (F): somewhat toxic compound. Data associated are shown in Table 2. (G): Re-analysis of primary screen image data to remove fluorescent compounds. Compounds were removed that increased the normalized Dmrk (average nuclear diameter) or Icyt (average intensity in cytoplasmic region) values by more than 3 SDs from mean values (Mean = 0.06±6.05 – horizontal lines). |
Confirmation Assay
After these filters had been applied, about 30% of the compounds were eliminated and a selection of 7,500 compounds were re-tested in triplicate at 10 µM in a confirmation of the primary assay, with the same ≥ 30% inhibition cut-off (Fig. 10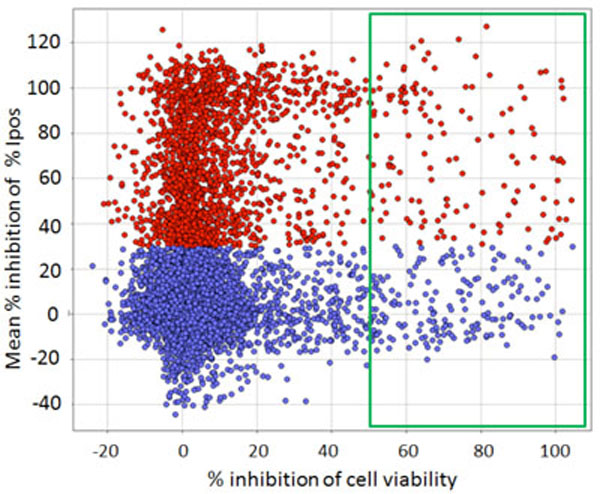 ). From this we confirmed about 2,000 (27%) of the compounds. Interestingly, this low confirmation rate was directly brought about by our original rather “relaxed” hit criterion of ≥30% inhibition: only 13% of compounds with between 30 and 50% inhibition in the primary assay were confirmed, whereas 46% of compounds with > 50% inhibition confirmed (data not shown).

Counterscreen
The primary screen selected compounds that inhibited autophagy when the cells were placed in starvation medium, which would ultimately lead to cell death although not in the 2 hr time-frame of the assay. Acutely toxic compounds that eliminated cells were removed in the secondary data analysis, but we also wished to eliminate compounds that were toxic to cells not undergoing autophagy and over a longer time period. Compounds successfully reaching the confirmation stage were therefore further tested for toxicity occurring in full growth medium, again at 10 µM in triplicate, using the WT HeLa cell line growing in full growth medium for 24 hr and a standard cell viability assay. Those compounds showing >50% toxicity (a further 122) were eliminated by this assay (Fig. 10).
Chemical Triage
At this stage, the remaining compounds were examined for structural attributes and their previously documented activities in other screens. Those with undesirable properties (frequent hitters, non-specific inhibitors, undesirable chemical structure, etc.) were identified and around 350 were removed from consideration.
Dose Response Determination
Confirmed compounds (~1,400) were placed in a 10-point dose response (in triplicate) from 30 µM to 1.5 nM. Those compounds that were demonstrably dose responsive and also achieved a maximum activity of >30% inhibition were considered active, and about 1,200 compounds fit these criteria. A range of activities were observed (Fig. 11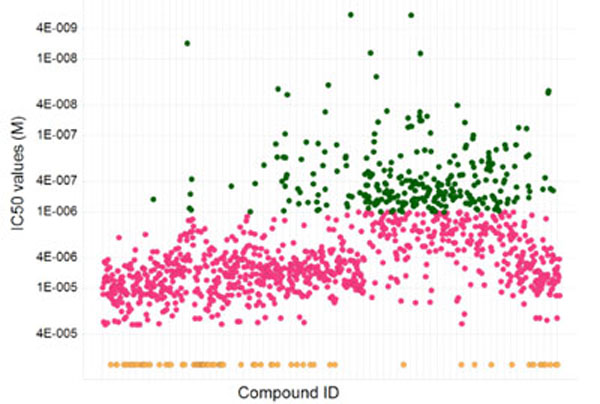 ) from nM to µM. Nearly 300 compounds showed nM activity.

Secondary Assay
Finally, we added a longer-term cell death assay into the screening tree in a second cell type, the tumor cell line H1299, to identify compounds that selectively brought about cell death under starvation conditions but not under normal growth conditions by 48 hr. From this about 400 compounds that were not toxic for either cell type in full nutrient conditions and only caused loss of viability under starvation conditions were identified (Fig. 12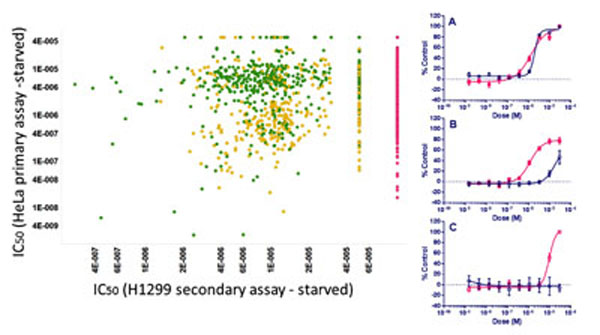 ) and classified as “Active Specific”.

DISCUSSION
Our HTS/HCA screening technology was effectively deployed to perform a good-sized screen of about 0.25 million compounds, and in hindsight, we could have done many more. The assay was simple once developed and both robust and relatively inexpensive. Compounds inhibiting EGFP-LC3 granule formation by >30% at 2 hr in starvation medium were designated positive (~7,000 out of 246,000 tested). At the same time, parameters of cell health (number, nuclear size) could be collected to identify particularly toxic compounds; fluorescent compounds could also be identified, as well as GFP signal quenchers. An advantage of image-based assays is that such filters can be applied early and in a single assay, making these assays much “cleaner” for compound qualification. Compounds that were cytotoxic to WT HeLa cells given a longer exposure (24 hr) to compound, and when in full growth medium and not nutrient deprived, were also identified and removed from consideration.
Applying these filters, moving from the primary screening hit rate of 2.8% and around 10,500 compounds, after dose response only ~ 1,200 compounds (0.5%) remained, with IC50 values ranging from low nM to µM in the EGFP-LC3 primary assay. For further compound characterization, both bio- and chemi-informatics were extensively employed to assign possible functions or cellular pathways to the compounds, based on both internal archived data for each compound or compound series, and on external literature. As examples (results not shown), we found compound series that inhibit PI3KC3/Vps34 using recombinant Vps34 protein in a TR-FRET format, and another family was known active against ULK from results with the Millipore Kinase ProfilerTM assay panel. We also found series for which the targets were unidentified. In order to fully qualify the compound activity in relation to the autophagy mechanism and also that activity was not confined to HeLa cells, we added a further assay pair into the screening tree in a second cell type, the tumor cell line H1299, in full dose response mode, to select for compounds that only caused cell death under starvation conditions and not with full growth medium, by 48 hr. From this, about 400 compounds were identified as both active and specific for inhibiting starvation-induced autophagy. The final screening “tree” and outcome of compound triage is illustrated in Fig. (13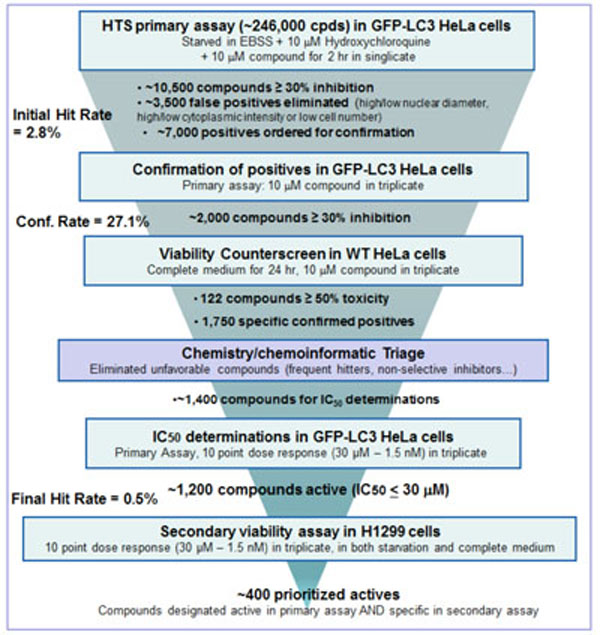 ).
).
 |
Fig. (13) Screening tree of HTS process. |
Different groups have already described that the two kinases Vps34 and ULK are key regulators of the autophagy machinery [1Rubinsztein DC, Codogno P, Levine B. Autophagy modulation as a potential therapeutic target for diverse diseases Nat Rev Drug Discov 2012; 11: 709-30.
[http://dx.doi.org/10.1038/nrd3802] , 7Russell RC, Tian Y, Yuan H, et al. ULK1 induces autophagy by phosphorylating beclin-1 and activating Vps34 lipid kinase Nat Cell Biol 2013; 7: 741-50.
[http://dx.doi.org/10.1038/ncb2757] -9Jaber N, Dou Z, Chen JS, et al. Class III PI3K Vps34 plays an essential role in autophagy and in heart and liver function Proc Natl Acad Sci USA 2012; 109(6): 2003-8.
[http://dx.doi.org/10.1073/pnas.1112848109] ]. The fact that we identified compounds active against these 2 potential drug targets for autophagy in our screen validates the design and the well-defined and planned path of our HTS on autophagy. Chemical matter needs to be further explored, including selectivity assessments and ADMET, in order to support discovery and move the project forward. Many autophagy inhibitors used in the autophagy field are in fact promiscuous compounds, such as 3-methyladenine (3-MA), or compounds with limited potency, such as hydroxychloroquine. Though there are already clinical trials ongoing using hydroxychloroquine for cancer, there remains an urgent need to identify potent and selective compounds for therapeutic applications.
There has been a great deal of discussion in the field about the advantages and difficulties of “phenotypic screening” although in reality, cellular assays have been routine in HTS for many years and any cellular assay (e.g. Ca+-rise readouts, cAMP readouts …) is phenotypic until the intended molecular target is confirmed. While phenotypic screening has the apparent disadvantage of a lack of a known molecular target at the outset, the converse aspect is that setting up such assays does not require the prior selection of a molecular target which might turn out to be the wrong one. In addition, since these are cellular assays, compounds that cannot access intra-cellular targets or function in the presence of physiological protein levels are weeded out early; and as screening libraries grow bigger and the quality better, the frequent though dubious argument that bad characteristics can be overcome later should become less employed. It should also be acknowledged that picking even an obvious molecular target has not historically created a straight pathway to drug discovery, and many approved molecules later reveal side effects or a polypharmacology that belies any specificity for the original target [10Overington JP, Al-Lazikani B, Hopkins AL. How many drug targets are there? Rev Drug Discov 2006; 5: 993-6.
[http://dx.doi.org/10.1038/nrd2199] , 11Gregori-Puigjané E, Setola V, Hert J, et al. Identifying mechanism-of-action targets for drugs and probes Proc Natl Acad Sci USA 2012; 109: 11178-83.
[http://dx.doi.org/10.1073/pnas.1204524109] ]. An analysis of 75 first-in-class small molecules approved by the FDA in the 10 years before 2009, when the target-based HTS approach was at its zenith, showed that 28 came from phenotypic screening approaches where no target was defined beforehand, and 17 from target-based approaches [12Swinney DC, Anthony J. How were new medicines discovered? Nat Rev Drug Discov 2011; 10: 507-19.
[http://dx.doi.org/10.1038/nrd3480] ]. Deploying the huge chemical library resources of large pharmaceutical companies in a phenotypic assay means that they are truly being assessed against the complex biological machinery that contributes to a cellular response in ways that might produce something entirely novel as well as biologically active.
As we have ramped up our expertise in image-based screening and put the necessary data reduction methods in place, the screening of many more compounds has progressively become less of a technical challenge, with the next major hurdle being the substitution into screening, for non-oncology targets at least, of “more relevant” cell types (e.g. primary cells; iPSC-derived cells). However, a further and harder to quantitate disadvantage that exists for a project completing a large-scale phenotypic screen is that it presents a generation of medicinal chemists that were trained largely on the target-based approach with a daunting amount of chemical data and a more obscure biology. After chemi- and bio-informatics triage of a compound set, it is often hard for project teams to distract attention from compounds that have a historic track record with a molecular target in favor of perhaps more novel pathways or as yet unknown targets interacting with other positive compound series or “singletons”. But enabling the required processes has been widely recognized as necessary [13Lee JA, Hu SC, Willard FS, Cox KL, et al. Open innovation for phenotypic drug discovery: the PD2 assay panel J Biomol Screen 2011; 16: 588-602.
[http://dx.doi.org/10.1177/1087057111405379] , 14Eggert US. The why and how of phenotypic small-molecule screens Nat Chem Biol 2013; 9: 206-9.
[http://dx.doi.org/10.1038/nchembio.1206] ] and tools are increasingly available [15Guha R, Bender A, Eds. Computational Approaches in Cheminformatics
and Bioinformatics. USA: Wiley 2011.
[http://dx.doi.org/10.1002/9781118131411] , 16Kotz J. Phenotypic screening, take two SciBX 2012; 5 doi:10.1038/scibx.2012.380
[http://dx.doi.org/10.1038/scibx.2012.380] ]. Given the striking success of phenotypic approaches to deliver first-in-class therapies [12Swinney DC, Anthony J. How were new medicines discovered? Nat Rev Drug Discov 2011; 10: 507-19.
[http://dx.doi.org/10.1038/nrd3480] ], devising and implementing higher throughput approaches to post-screening, biomedical/translational qualification of compounds should be the next frontier of the continuing challenge to deliver new medicines for unmet medical needs.
CONFLICT OF INTEREST
The authors confirm that this article content has no conflicts of interest.
ACKNOWLEDGEMENTS
We would like to thank Christophe Marcireau, Alain Le Brun, Hélène Goulaouic, Laurent Schio, Christelle Castell, Racquel Paranal, Robert Dinerstein and Amar Drawid for their valuable input and discussion.
ABBREVIATIONS
REFERENCES
| [1] | Rubinsztein DC, Codogno P, Levine B. Autophagy modulation as a potential therapeutic target for diverse diseases Nat Rev Drug Discov 2012; 11: 709-30. [http://dx.doi.org/10.1038/nrd3802] |
| [2] | Choi AMK, Ryter SW, Levine B. Autophagy in human health and disease N Engl J Med 2013; 368: 651-2. [http://dx.doi.org/10.1056/NEJMra1205406] |
| [3] | Codogno P, Merhpour M, Proikas-Cezanne T. Canonical and non-canonical autophagy: variations on a common theme of self-eating? Nat Rev Mol Cell Biol 2012; 13: 7-12. |
| [4] | Klionsky DJ, Abeliovich H, Agostinis P, et al. Guidelines for the use and interpretation of assays for monitoring autophagy in higher eukaryotes Autophagy 2008; 4: 151-75. |
| [5] | Mizushima N, Yoshimori T, Levine B. Methods in mammalian autophagy research Cell 2010; 140: 313-25. [http://dx.doi.org/10.1016/j.cell.2010.01.028] |
| [6] | Zhang JH, Chung TDY, Oldenburg KR. A simple statistical parameter for use in evaluation and validation of high throughput screening assays J Biomol Screening 1999; 4: 67-73. [http://dx.doi.org/10.1177/108705719900400206] |
| [7] | Russell RC, Tian Y, Yuan H, et al. ULK1 induces autophagy by phosphorylating beclin-1 and activating Vps34 lipid kinase Nat Cell Biol 2013; 7: 741-50. [http://dx.doi.org/10.1038/ncb2757] |
| [8] | Johnson EE, Overmeyer JH, Gunning WT, et al. Gene silencing reveals a specific function of hVps34 phosphatidylinositol 3-kinase in late versus early endosomes J Cell Sci 2005; 119: 12119-32. |
| [9] | Jaber N, Dou Z, Chen JS, et al. Class III PI3K Vps34 plays an essential role in autophagy and in heart and liver function Proc Natl Acad Sci USA 2012; 109(6): 2003-8. [http://dx.doi.org/10.1073/pnas.1112848109] |
| [10] | Overington JP, Al-Lazikani B, Hopkins AL. How many drug targets are there? Rev Drug Discov 2006; 5: 993-6. [http://dx.doi.org/10.1038/nrd2199] |
| [11] | Gregori-Puigjané E, Setola V, Hert J, et al. Identifying mechanism-of-action targets for drugs and probes Proc Natl Acad Sci USA 2012; 109: 11178-83. [http://dx.doi.org/10.1073/pnas.1204524109] |
| [12] | Swinney DC, Anthony J. How were new medicines discovered? Nat Rev Drug Discov 2011; 10: 507-19. [http://dx.doi.org/10.1038/nrd3480] |
| [13] | Lee JA, Hu SC, Willard FS, Cox KL, et al. Open innovation for phenotypic drug discovery: the PD2 assay panel J Biomol Screen 2011; 16: 588-602. [http://dx.doi.org/10.1177/1087057111405379] |
| [14] | Eggert US. The why and how of phenotypic small-molecule screens Nat Chem Biol 2013; 9: 206-9. [http://dx.doi.org/10.1038/nchembio.1206] |
| [15] | Guha R, Bender A, Eds. Computational Approaches in Cheminformatics
and Bioinformatics. USA: Wiley 2011. [http://dx.doi.org/10.1002/9781118131411] |
| [16] | Kotz J. Phenotypic screening, take two SciBX 2012; 5 doi:10.1038/scibx.2012.380 [http://dx.doi.org/10.1038/scibx.2012.380] |